Stormchaserchuck1
-
Posts
3,294 -
Joined
-
Last visited
Content Type
Profiles
Blogs
Forums
American Weather
Media Demo
Store
Gallery
Everything posted by Stormchaserchuck1
-
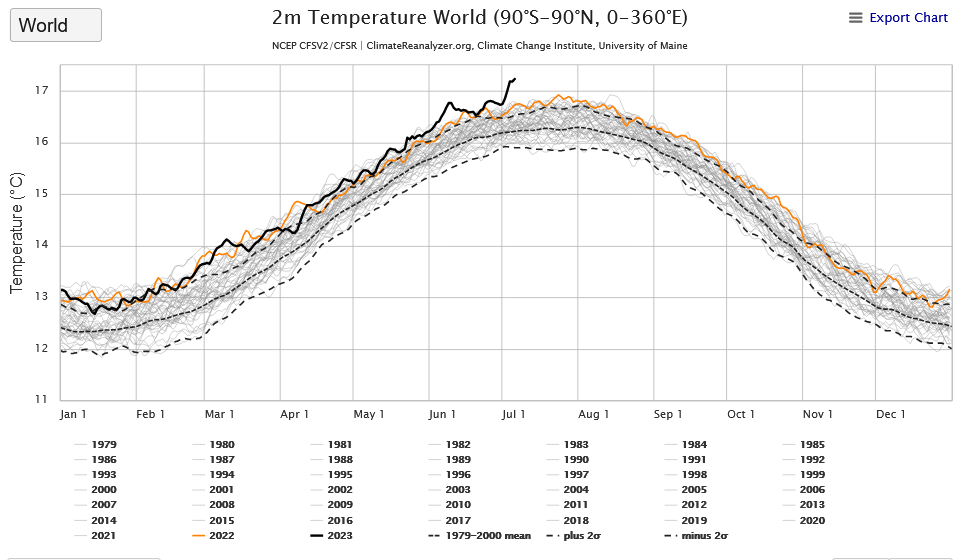
Pretty nice -NAO setting up here the next few days. Watch to see if the SW builds a strong High pressure, to move across later in the month, and we have generally been busting warmer here in -nao's.
-

El Nino 2023-2024
Stormchaserchuck1 replied to George001's topic in Weather Forecasting and Discussion
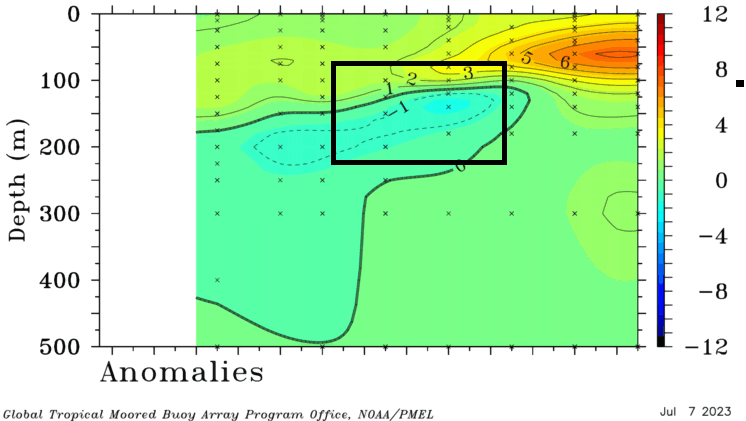
Back to +7c in the eastern subsurface.. The El Nino may become a self-perpetuating system, given how round its yearly evolution is. I think it will be interesting to see the unfoldment of the N. Pacific pattern if the central-subsurface remains cold and Nino 3-4 move into Moderate territory. this tendency toward cold bias will have been what we have seen through a lot of 2020-2022. -
-
If this cold pool doesn't go anywhere, it's going to be more of a -pna Winter. Amazing to see the Nino getting squeezed out in the subsurface, after the Kelvin waves last Oct-Feb.
-
2023 Mid-Atlantic Severe Wx Thread (General Discussion)
Stormchaserchuck1 replied to Kmlwx's topic in Mid Atlantic
A big storm here in Fallston, many lighting bolts, lots of booms. Maybe 25+ less than 1 mile strikes.- 2,785 replies
-
- 1
-

-
- severe
- thunderstorms
- (and 3 more)
-
El Nino 2023-2024
Stormchaserchuck1 replied to George001's topic in Weather Forecasting and Discussion
The MEI does have a higher correlation to the global 500mb pattern than Nino 3.4 SSTs, so to miss something by 0.8 does matter. I've yet to see a strong Nino pattern anywhere around the globe. There was thought that the Atlantic Hurricane season would see a bounce this year, with last years relative-low, but that historically is really only possible if El Nino stays weaker. 2002 and 2004 both had 15 Atlantic NS, the record high for El Nino. -
El Nino 2023-2024
Stormchaserchuck1 replied to George001's topic in Weather Forecasting and Discussion
A strong -PNA setting up for late July, on the 384hr ensemble mean. This would negate a lot of the +pna action recently, and if the central-subsurface continues to cool, this fits too.. strong correlation there, validating in LR models right now.
-
The -NAO streak continues.. models trended toward +EPO and highs in the 90s today, with -NAO setting in place. Everytime a -NAO happens, we trend warmer/SE ridge, and the pacific short term goes +epo. This has been happening since 2019, more often than a coincidence. Especially since 2021.
-
I can see the coast being a gravitation for pressure systems in the Winter by the way the pattern is.. We have seen a lot of this since year 2000.
-
2023 Mid-Atlantic Severe Wx Thread (General Discussion)
Stormchaserchuck1 replied to Kmlwx's topic in Mid Atlantic
Really getting warm today. I like this pattern setting up with a trough over the Midwest/Great Lakes through mid-July.- 2,785 replies
-
- 1
-
-
- severe
- thunderstorms
- (and 3 more)
-
El Nino 2023-2024
Stormchaserchuck1 replied to George001's topic in Weather Forecasting and Discussion
ONI research: 2023 -0.7 -0.4 -0.1 0.2 0.5 5 month: (1.2) Best CPC ONI matches: -2010 (1.7) [1.6 peak], -2007 (1.1) [1.6 peak], 2006 (0.8) [0.9 peak], -2003 (1.2) [0.4 peak], 1997 (1.3) [2.4 peak], -1995 (0.9) [1.0 peak], 1989 (1.1) [-0.1 peak], -1988 (1.7) [1.8 peak], 1982 (0.7) [2.2 peak], -1978 (1.0) [0.4], 1976 (1.3) [0.9 peak], 1972 (1.4) [2.1], 1965 (0.8) [2.0 peak], -1964 (1.7) [0.8 peak], 1957 (1.1) [1.8 peak], -1954 (1.3) [0.9 peak], 1951 (1.2) [1.2 peak] ...A lot of weak events in the mix. A few early peakers, and the Strong el nino events qualify but some movements to Strong Nina's had faster pushes, then what qualifies as +0.5(1.2). You can tell that the trend evens out over the whole dataset (5/5 Strong events qualify doesn't tell the whole story). https://origin.cpc.ncep.noaa.gov/products/analysis_monitoring/ensostuff/ONI_v5.php 2003 was Neutral, 2006 was Weak, 1995 was Weak, 1989 was Neutral, 1978 was Neutral, 1976 was Weak, 1964 was Weak, 1954 was Weak. -
El Nino 2023-2024
Stormchaserchuck1 replied to George001's topic in Weather Forecasting and Discussion
Again, the subsurface warmth is getting suffocated out. In the long range, it will be hard for the El Nino to continue to strengthen rapidly with central-subsurface profile like this. I've done research correlating this region with N. Hemisphere pattern, and the developing of cool anomalies supports -PNA conditions. This generality continues into the Winter: The more warm or cold the central-ENSO-subsurface is, the more the N. Pacific pattern will or won't react. (I've tested OLR, 850mb winds, SLP, SSTs, and 200mb winds, sigma, etc, and the central-subsurface has the highest correlation of all at D+0.)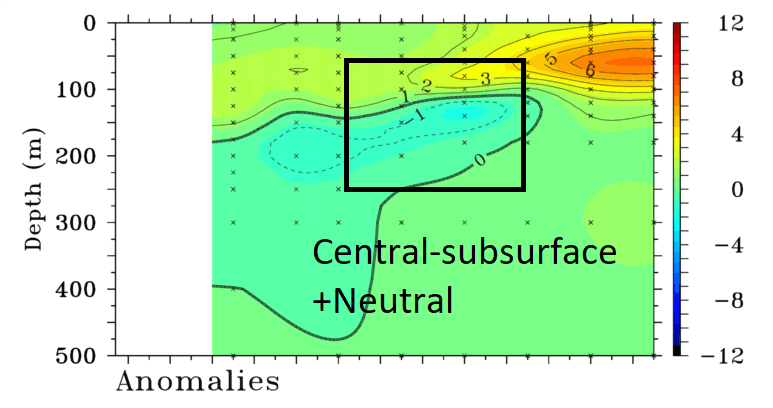
-
It's still a macro-pattern, that means more activity with fewer systems. Seem pretty fitting going into an El Nino winter. Watch the central-ENSO subsurface, this has been cooling, and if that region continues not to warm the El Nino will have less effect in the Winter, despite what happens at the surface.
-
2023 Mid-Atlantic Severe Wx Thread (General Discussion)
Stormchaserchuck1 replied to Kmlwx's topic in Mid Atlantic
Yeah, the air is too saturated. Im watching cumulus building to the north but it's nothing like the last few days (Harford Co) edit: nevermind, the storm is really going. Probably close to 1" of rain. -
low to mid 90s today across the area with -NAO. The pattern is N-S is elongating a trough or ridge, through Hadley Cells (15N-80N). I think in the Winter a -NAO will be hard to lock cold, but a stronger El Nino could overpower. This -NAO = warmth thing is really unbelievable because it is happening so often.
-
2023 Mid-Atlantic Severe Wx Thread (General Discussion)
Stormchaserchuck1 replied to Kmlwx's topic in Mid Atlantic
90F here, Sunny. You can tell the air is saturated though. -
El Nino 2023-2024
Stormchaserchuck1 replied to George001's topic in Weather Forecasting and Discussion
^That's a good post. I'm worried about the cold pool developing in the central-subsurface too. The mid-July -PNA may be with an enhancement of this. It's been a tough area to stay constantly warm since the Winter, with a few short term cooler pushes having happened since March, overall a weaker +. -
El Nino 2023-2024
Stormchaserchuck1 replied to George001's topic in Weather Forecasting and Discussion
Nice -PNA, 594dm block ~7/14. These correlate with a cooler central-subsurface. After a series of +pna's, I wonder if this is evening out, giving less credence to El Nino effecting the N. Hemisphere pattern. It may seem like I'm doing heavy play-by-play, but there are some strong constants right now in the global pattern that I would like to see break. -
2023 Mid-Atlantic Severe Wx Thread (General Discussion)
Stormchaserchuck1 replied to Kmlwx's topic in Mid Atlantic
Some rain with 2nd cluster of clouds. Areas that didn't see so much so far might do better tomorrow. I like this front moving across the Midwest ~7/8. -
2023 Mid-Atlantic Severe Wx Thread (General Discussion)
Stormchaserchuck1 replied to Kmlwx's topic in Mid Atlantic
Some booms to my SSE (Harford county), nice building cumulus, partly sunny. It just rained 3 hours ago. We are drought busting like crazy. For now on, take months of below average rainfall as instability in the Spring/Summer. Although, if it wasn't El Nino, I don't know that we would be getting this. -
2023 Mid-Atlantic Severe Wx Thread (General Discussion)
Stormchaserchuck1 replied to Kmlwx's topic in Mid Atlantic
7-7/8 looks interesting with a trough cutting into/through the midwest. -
El Nino 2023-2024
Stormchaserchuck1 replied to George001's topic in Weather Forecasting and Discussion
3 years prior to 57-58, we had the most negative monthly PDO on record until last year. It was a transition time/event break point. -
El Nino 2023-2024
Stormchaserchuck1 replied to George001's topic in Weather Forecasting and Discussion
Global SSTs, chicken and egg. I do know that when a warm/cold front move by, the SSTs warm/cool thereafter. ENSO Is SST, but I wouldn't put much weight on other areas unless it's extreme, or a deviation from upper level pattern. -
El Nino 2023-2024
Stormchaserchuck1 replied to George001's topic in Weather Forecasting and Discussion
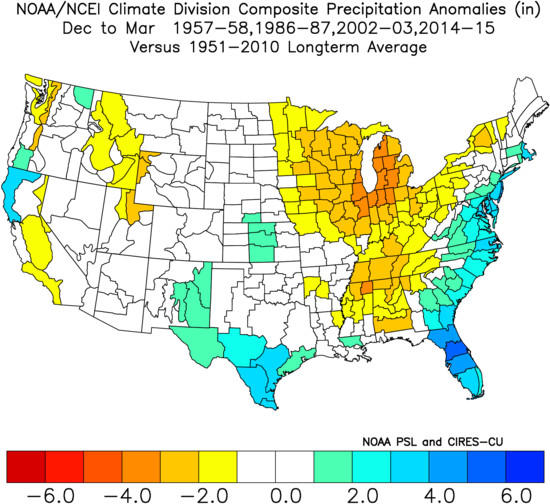
3 year -ENSO followed by 2-year +ENSO, 4th year being an El Nino, also includes 02-03 and 14-15. (4) years since 1950 forward and backward: 57-58, 86-87, 02-03, and 14-15, not a bad list of years if I'm right about our continuation probability next year. edit: 76-77 qualifies and minus 54-55. That's a lot of weak events though. You might want to phase out the Weak Nino's. 86-87 and 14-15 are El Nino, -QBO matches out of the list.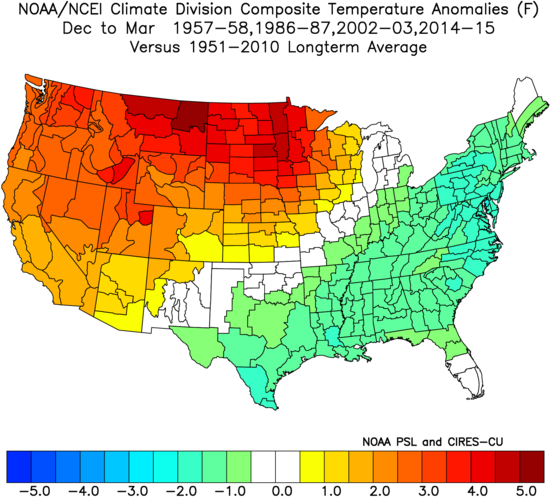
-
El Nino 2023-2024
Stormchaserchuck1 replied to George001's topic in Weather Forecasting and Discussion
I've found 1957-8 and 1986-7 could be good Winter analogs, Both were the start of 2 year El Nino's, which I see as a possibility if this one doesn't go too strong (it's about potential energy). They also both came off 3-year La Nina/-Neutral.