RU848789
-
Posts
3,616 -
Joined
-
Last visited
Content Type
Profiles
Blogs
Forums
American Weather
Media Demo
Store
Gallery
Everything posted by RU848789
-
Two Mdt to high impact events NYC subforum; wknd Jan 6-7 Incl OBS, and mid week Jan 9-10 (incl OBS). Total water equiv by 00z/11 general 2", possibly 6" includes snow-ice mainly interior. RVR flood potential increases Jan 10 and beyond. Damaging wind.
RU848789 replied to wdrag's topic in New York City Metro
6 pages for a storm that's 6+ days out in an extremely fragile setup, which could easily miss us or just rain on us (along 95), tells us how snow-starved we all are. I just like the fact that there's some chance of getting decent snow and something to track for a change. We are certainly due for a little luck after watching every threat fizzle last winter and we haven't even had any real threats so far this winter.- 3,610 replies
-
- 4
-

-
- snow
- heavy rain
- (and 5 more)
-
The NWS Philly cancelled the wind advisory as of about 10 pm, as they're not seeing the high winds aloft mixing down to the surface as much as expected. There will still be gusts to 30-40 mph, but those are below advisory criteria. Lots of rain still to come, especially along and SE of 95. There is a strong low level jet, generally 40 to 50 kt, along the New Jersey coast, but the strongest winds are not mixing down given how warm the ocean is. Surface obs near the coast are generally reporting 30 to 35 mph gusts. Will go ahead and cancel the Wind Advisory, these winds are below Wind Advisory criteria.
-
Latest NAM still wants to bring accumulating snow to the 95 corridor, but it stands alone, as no other models show more than a dusting to an inch or so outside of areas well N/W of 95 with only areas like higher elevations of the Poconos, Sussex and interior SENY getting more than an inch. Would be a coup if it verified. I'll be happy with mood flakes and maybe a dusting in the Edison area.
-
I understand it's unlikely, but at some point, with both the NAM and GFS showing several inches of snow down through the 95 corridor, (except for the perfect snowhole over NYC metro on the GFS) one has to wonder if there's some chance they're on to something and maybe we could get some white stuff. Stranger things have happened...
-
Had a few flurries at Allaire State Park in Monmouth County around noon (was playing disc golf there)... As an aside, CPK hit 30F on 11/25 its first temp AOB 32F, but I don't recall any freeze watches/warnings - did I miss that somehow?
-
Thanks, did know that, but was more looking for hourly output from the globals and NAM/RDPS, even though the higher resolution convection allowing versions of those (NAM3K and HRDPS) are available hourly, as you noted - but I've observed that sometimes the lower resolution versions do better with non-convective systems like this one. And TT does have the HRDPS, which is hourly. Would also be nice to have IBM's/TWC's GRAF model output somewhere, which supposedly has very good accuracy scores, but I haven't seen it available anywhere (some media outlets use it though) to the public.
-
No offense, but for me and thousands of others, the primary issue is the RU game in Piscataway, with tailgating from maybe 7 am to noon, which looks mostly dry on most models (maybe 0.05-0.1" before noon), but then the steady rains look to move in sometime in the 12-2 pm timeframe on most models (kickoff is noon), so the timing is really critical for fans and there is definitely significant variability on QPF starting around 2 pm, with some models showing 0.1-0.2" from 2-5 pm while others show closer to 0.3-0.4". My one big question for folks is where can I find hourly precip forecasts from the models (even if it's a pay site)? Pivotal premium only has 3 hr increments on some models and 6 hr increments on others and I'd love to see finer output. i know I can get hourly once the HRRR and RAP are in range, but it would be nice to have that, too for the globals and NAM/RDPS. Thanks...
-
Models keep bouncing around for total event QPF, but narrowing down on 1/2-1" from maybe 78 to 84 and 1-1.5" from 78 down through SNJ/SEPA. NWS calling for a general 1-2" in most locations, including NYC, so they're a bit more bullish on the rain. For me the issue is the RU game in Piscataway, with tailgating from maybe 7 am to noon, which looks mostly dry on most models, but then the steady rains look to move in sometime in the 12-2 pm timeframe on most models (kickoff is noon), so the timing is really critical for fans and there is definitely significant variability on QPF starting around noon, with some models (6Z NAM and RDPS) showing no rain through 2 pm and very little rain through 5 pm, even, while other models are showing 0.1-0.2" through 2 pm and maybe 1/4-1/2" total through 5 pm. The NWS has about 1/4" through 2 pm and almost an inch from 2 pm to 8 pm in their hourly graphic. For most people the difference between 0.1" and 0.3" of rain is inconsequential, but not for fans out in the open. Crossing fingers for the NAM/RDPS to be right.
-
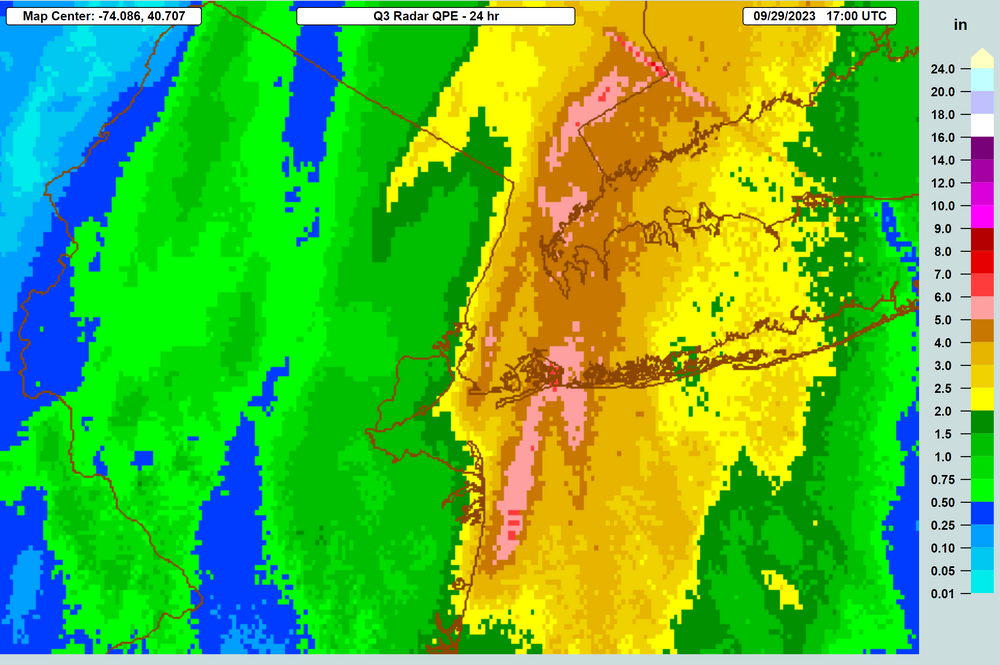
As the rainfall graphic below shows, the amount of rain east of the Hudson in NYC/SENY and just off the NJ coast (except some very heavy rains at the immediate coast and just into NJ across from the Hudson) has been incredible, with the following highlights from the story linked below. There will likely be parts of that area that get 7-9" of rain, which is 2 months worth in one day. https://www.cnn.com/2023/09/29/weather/new-york-city-northeast-rain-flood-forecast-climate-friday/index.html In Brooklyn: A month’s worth of rain, up to 4.5 inches, fell in only 3 hours on Friday morning, according to National Weather Service data. This three-hour rainfall total is only expected about once every 100 years in Brooklyn, according to NOAA estimates. In Manhattan: Nearly 2 inches of rain fell in one hour in Central Park, the second-wettest hour there in 80 years. More than 5 inches of rain have fallen there so far. In Queens: It’s a top-10 wettest day at John F. Kennedy International Airport, where more than 4 inches of rain has fallen since midnight.
- 886 replies
-
- 8
-
-
- heavy rain
- flooding potential
- (and 2 more)
-
Yeah, the Euro ensemble mean shifted west about 60 miles from 12Z (but 0Z last night was even about 60 miles further west), with obviously more members hitting west of Maine.
-
12Z Euro landfall about 100 miles NE of 0Z, so it's looking like 0Z was a bit of a blip and not a trend...
-
NHC is not ready to jump onto the Euro solution at 0Z, probably because the gap has tightened between the other globals and the Euro (and we have improved hurricane models like the HAFS-B) since Sandy's coup in 2012, plus the Euro has stumbled for a few recent storms. Here's what they said in their latest discussion: The latest NHC track was a compromise between the 6z GEFS and ECMWF ensembles in the days 4/5 time frame, as it is still too early to know if any leftward bend will occur as Lee approaches North America.
-
The 6Z Euro ensembles looked like they moved back east somewhat relative to last night's 0Z run, but as far as I know the 6Z operational only goes out to 90 hours, so I'm guessing we'll have to wait for 12Z to see if 0Z was a blip or not. Would certainly be interesting if the Euro is on to a westward shift about 5 days out vs. the other models, paralleling, somewhat, the Euro sniffing out Sandy's NW hook into NJ (although that was a monster coup, 7 days out). https://www.weathernerds.org/tc_guidance/storm.html?tcid=AL13
-
That's New Brunswick, CA, between far east Maine and SW Nova Scotia and the storm is predicted to go from 981 mbar in the frame below to 989 at landfall in far SW Nova Scotia (if one assumes this being correct 6 days out). I've seen 970-980 at or very close to landfall, which implies a Cat 1/2 system (likely transitioning to extratropical), based on the SS scale. A pretty big deal for that neck of the woods. Anyone from Cape Cod to Newfoundland should be prepared.
-
True. The Euro was the westernmost model at landfall at 12Z and now it's the easternmost at 0Z, looking a lot like the CMC at 12Z, which also didn't quite make it to even hitting Canada, while the 0Z CMC hits downeast Maine like the 12Z Euro did - they basically flip-flopped. While the GFS moved from a Newfoundland landfall to a Nova Scotia landfall. I know op runs are not to be trusted at this range, but it's fun to look at them...
-
The Euro is also about 18-24 hours "slower" than the GFS/CMC - lots to resolve before we really have a handle on this one...
-
Cat 5... BULLETIN Hurricane Lee Advisory Number 11 NWS National Hurricane Center Miami FL AL132023 1100 PM AST Thu Sep 07 2023 ...LEE BECOMES A CATEGORY 5 HURRICANE... ...DANGEROUS BEACH CONDITIONS EXPECTED TO DEVELOP AROUND THE WESTERN ATLANTIC THROUGH EARLY NEXT WEEK... SUMMARY OF 1100 PM AST...0300 UTC...INFORMATION ----------------------------------------------- LOCATION...17.3N 52.4W ABOUT 705 MI...1135 KM E OF THE NORTHERN LEEWARD ISLANDS MAXIMUM SUSTAINED WINDS...160 MPH...260 KM/H PRESENT MOVEMENT...WNW OR 295 DEGREES AT 14 MPH...22 KM/H MINIMUM CENTRAL PRESSURE...928 MB...27.41 INCHES
-
Good points, but on the last one, I'd say it's not an apples to apples comparison, as most winter storms, at least in the NE US, aren't fully formed entities that move for several days across the country, as they're usually the product of multiple pieces of energy coming together to form the ultimate winter storm, usually less than one day before the wintry weather begins. Hurricanes, by contrast, are mostly fully formed storms (at least once named) subject to a variety of steering factors, but I'd argue they're easier to predict 5 days in advance, as we've often seen with many tropical systems (not all, of course).
-
Good memory! Sam was forecast to hit 115 mph at 120 hrs... https://www.nhc.noaa.gov/archive/2021/al18/al182021.discus.001.shtml?
-
I said the exact same thing on FB when the first advisory came out and I've been tracking storms for a long time - maybe it has happened, but I don't recall it. Just looked back at a few of the big ones over the last 25 years (the ones on the NHC archive page) and Ida was the closest, with 110 mph predicted at 72 hours in the first advisory.
-
Question for you. In theory, wind gusts greater than 65 mph are usually needed to uproot mature trees and there was a report of 30 trees down on HHI, so I assume then, that at least at times and maybe in isolated locations, winds probably gusted over 65 mph, even if those speeds weren't recorded at the few stations on the island. So, was wondering what the max recorded gusts were on HHI (the public info statement from the NWS office doesn't show any gusts on HHI over 40 mph, unless I'm not aware of place names). Any input on that? Edit: looking at the PNS for the area, there were gusts of 69 mph on Tybee Island about 7 miles SW of HHI, 66 mph in Beaufort about 10 miles NE of HHI and 64 mph in Calibogue Sound about 1-2 miles SW of HHI. I just find it hard to believe that some places on HHI wouldn't have had 60+ mph gusts given reports of gusts that high surrounding the island, despite the reports of only ~35 mph gusts - looks more like the vagaries of wind variability and maybe instrument issues on HHI stations. https://forecast.weather.gov/product.php?site=NWS&issuedby=CHS&product=PNS&format=CI&version=1&glossary=1 https://www.wtoc.com/2023/08/31/not...island-residents-grateful-low-impacts-idalia/https://www.weather.gov/media/pqr/wind/wind.pdf
-
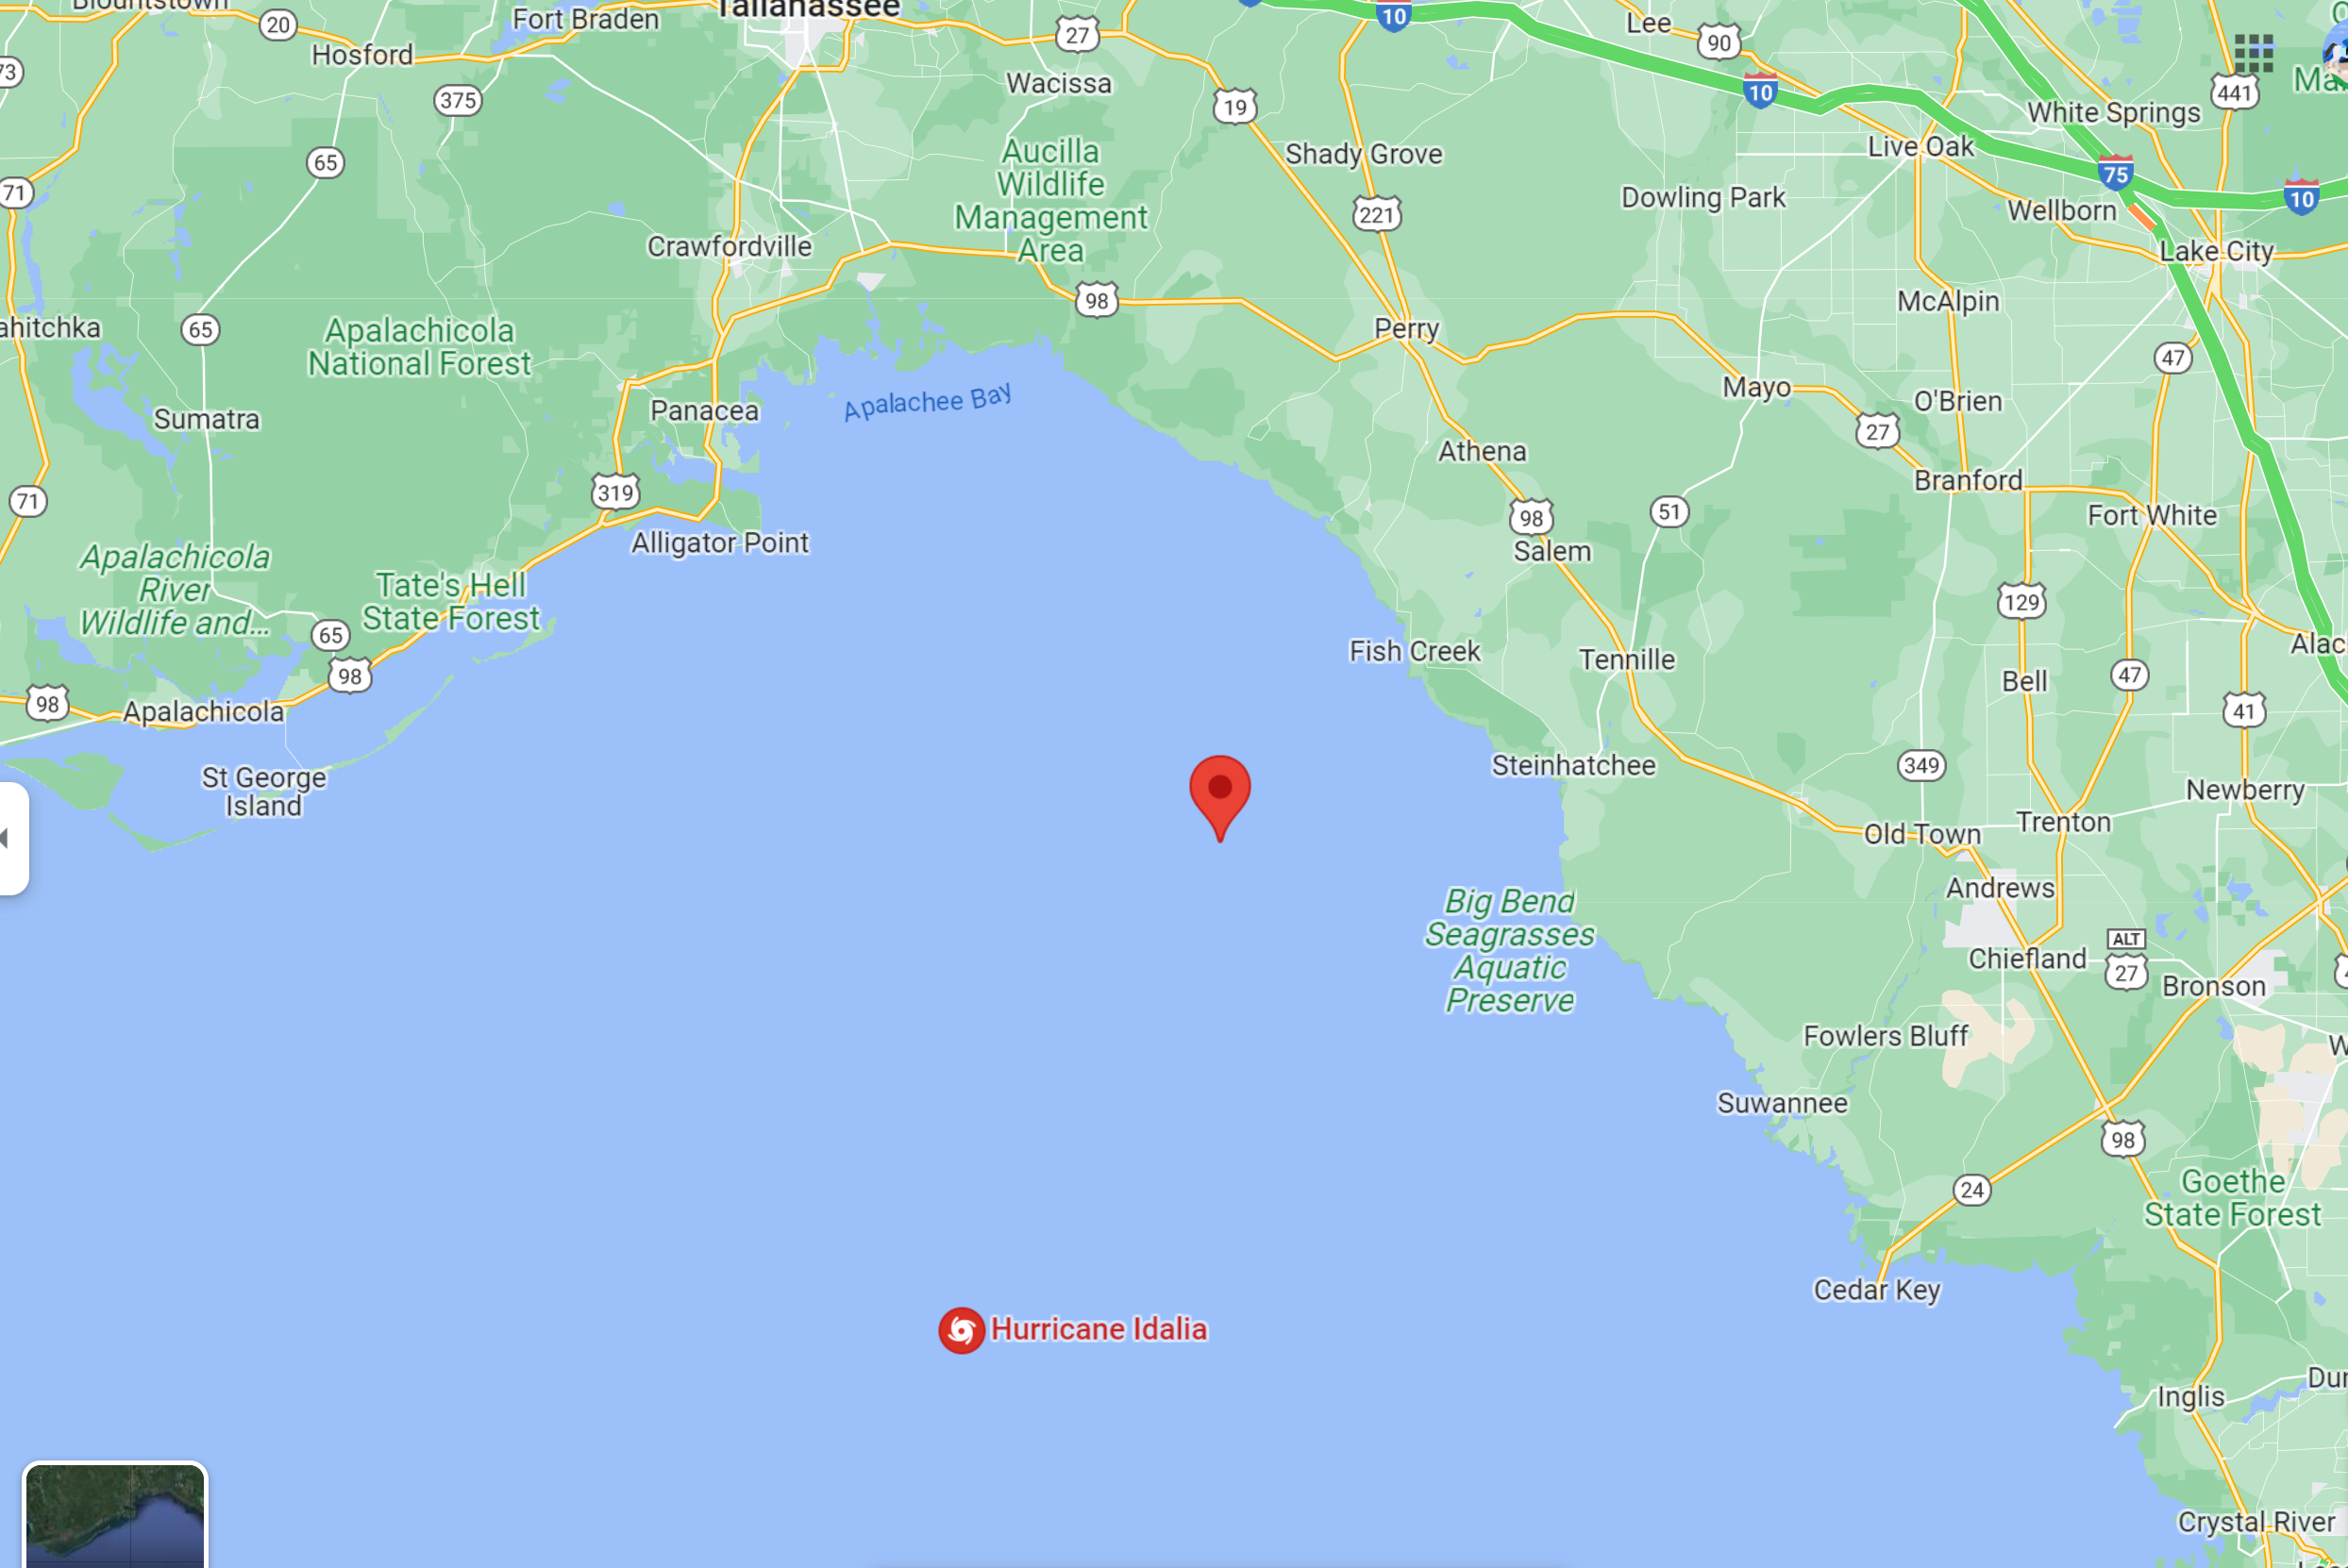
Looks like the beach just SSW of Perry is going to be ground zero for landfall in about 90 minutes, given the NNE motion at 18 mph with 125 mph winds, as the storm weakened a touch... Hurricane Idalia Tropical Cyclone Update NWS National Hurricane Center Miami FL AL102023 700 AM EDT Wed Aug 30 2023 ...CATASTROPHIC STORM SURGE AND DESTRUCTIVE WINDS OCCURRING IN THE FLORIDA BIG BEND REGION... ...7 AM POSITION UPDATE... Radar and Air Force Reserve Hurricane Hunter aircraft data indicate that an eyewall replacement cycle has begun. Idalia's maximum sustained winds are now estimated near 125 mph (205 km/h) with higher gusts. This change in wind speed does not diminish the threat of catastrophic storm surge and damaging winds. The estimated minimum pressure indicated by Air Force Reserve Hurricane Hunter aircraft data is 947 mb (27.96 inches). SUMMARY OF 700 AM EDT...1100 UTC...INFORMATION ---------------------------------------------- LOCATION...29.6N 83.8W ABOUT 55 MI...90 KM NW OF CEDAR KEY FLORIDA ABOUT 65 MI...105 KM SSE OF TALLAHASSEE FLORIDA MAXIMUM SUSTAINED WINDS...125 MPH...205 KM/H PRESENT MOVEMENT...NNE OR 20 DEGREES AT 18 MPH...30 KM/H MINIMUM CENTRAL PRESSURE...947 MB...27.96 INCHES

-
Just a 110C+ gradient from top to bottom, lol...
-
As feared and somewhat expected, the NHC is now forecasting that Idalia will be a 130 mph Cat 4 storm at landfall in the Big Bend area, about 20 miles ESE of St. Mark's and 35 miles NW of Steinhatchee (i.e., the middle of freakin' nowhere, with no towns within 10 miles of landfall including inland of there - which is not a bad thing) tomorrow morning around 8 am EDT. Other than the intensity, the only other change was a minor shift of the track about 10 miles further NW than earlier today at 5 pm. Good luck tomorrow to anyone in the path of this storm. Surprised nobody posted the discussion. Here it is... https://www.nhc.noaa.gov/text/refresh/MIATCDAT5+shtml/292056.shtml? Hurricane Idalia Discussion Number 14 NWS National Hurricane Center Miami FL AL102023 1100 PM EDT Tue Aug 29 2023 Satellite and NWS radar imagery show that Idalia is becoming increasingly more organized. The eye on the Tampa WSR-88D is becoming better defined and the cloud pattern on GOES 16 imagery consists of a growing Central Dense Overcast with a strong convective band over the eastern semicircle of the circulation. Reconnaissance aircraft measurements show that the central pressure is steadily falling and is now around 958 mb. Flight-level and SFMR-observed winds along with Doppler velocity data from the aircraft support an intensity of 95 kt for this advisory. Idalia is now moving faster toward the north or slightly east of north with a motion estimate of 010/16 kt. The hurricane is moving between a mid-level trough over the northwestern Gulf of Mexico and ridge over the Bahamas and Greater Antilles. The system is expected to turn north-northeastward within the next 12 hours, make landfall along the northeastern Gulf coast, and then move northeastward to eastward on the southern side of a mid-level trough moving off the northeast U.S. coast. The 12-hour track forecast point for this advisory has been nudged a bit westward, a little west of the model consensus, but close to the latest GFS and ECMWF solutions. It should be noted that some credible models, i.e. the HAFS-A and HAFS-B predictions, are even a little father west. After landfall, Idalia is expected to move near or along the coast of Georgia and the Carolinas in 24-36 hours. Uncertainty in the track forecast beyond 48 hours remains quite large, with some of the global models turning Idalia southward, while some of the regional hurricane models show the storm moving out to sea. Given the uncertainties, the official track forecast shows a slow southeastward motion in 4 to 5 days. Based on the current strengthening trend and the favorable thermodynamic and oceanic conditions, significant strengthening seems likely up to landfall. The new official intensity forecast calls for Idalia to reach category 4 strength at landfall. This is fairly close to the HAFS And HWRF regional hurricane model simulations. After the center moves back over the Atlantic, significant restrengthening is not anticipated at this time due to the expectation of strong vertical west-southwesterly vertical wind shear. Dangerous winds are likely to spread well inland near the path of Idalia due to its relatively fast forward motion. KEY MESSAGES: 1. Catastrophic impacts from storm surge inundation of 12 to 16 feet above ground level and destructive waves are expected somewhere between the Wakulla/Jefferson County line and Yankeetown, Florida. Life-threatening storm surge inundation is likely elsewhere along portions of the Florida Gulf Coast where a Storm Surge Warning is in effect. Residents in these areas should follow any advice given by local officials. 2. There is the potential for destructive life-threatening winds where the core of Idalia moves onshore in the Big Bend region of Florida, with hurricane conditions expected elsewhere in portions of the Hurricane Warning area along the Florida Gulf Coast. Strong winds will also spread inland across portions of northern Florida and southern Georgia near the track of the center of Idalia where Hurricane Warnings are in effect. Residents in these areas should be prepared for long-duration power outages. Damaging hurricane-force winds are possible in portions of eastern Georgia and southeastern South Carolina where Hurricane Watches are in effect. 3. Areas of flash, urban, and moderate river flooding, with locally considerable impacts, are expected across the Florida Big Bend, central Georgia and South Carolina, through eastern North Carolina into Thursday. FORECAST POSITIONS AND MAX WINDS INIT 30/0300Z 27.7N 84.5W 95 KT 110 MPH 12H 30/1200Z 30.0N 83.9W 115 KT 130 MPH...ON COAST 24H 31/0000Z 32.3N 81.3W 70 KT 80 MPH...INLAND 36H 31/1200Z 33.5N 78.6W 50 KT 60 MPH...OVER WATER 48H 01/0000Z 33.8N 75.0W 50 KT 60 MPH 60H 01/1200Z 33.5N 72.5W 50 KT 60 MPH 72H 02/0000Z 32.9N 71.0W 45 KT 50 MPH 96H 03/0000Z 32.0N 69.4W 45 KT 50 MPH 120H 04/0000Z 31.0N 68.4W 45 KT 50 MPH
-
Perhaps this is banter, but figured folks here might know the answers to this. I've always found it odd that the NHC will only do forecast predictions at 12 hour intervals, thus often "missing" key data points, like landfall -anyone know the rationale for that? Just look at the 5 pm advisory, which had a forecast for the storm to be up to 115 mph by 2 am tomorrow. However, due to the idiosyncracies of the NHC forecasts, the next published point is 2 pm tomorrow, after landfall when the storm is forecast to be at 85 mph. I don't know why, in situations like this, the NHC doesn't publish intermediate forecasts, i.e., at landfall around 8-9 am tomorrow along the Big Bend area. It's true that their discussion does say, "The 12-hour intensity forecast shows a 100-kt (115 mph) major hurricane. It is imperative to realize that Idalia is expected to continue strengthening beyond that time, possibly close to the 110 kt (125 mph) shown in the previous forecast, before the center reaches land," but how many people are reading the 5th paragraph down in the discussion vs. looking at the track graphics. Another pet peeve - why don't they put the windspeeds on the 12 hour timepoints on the track forecast instead of the inexact S, H, and M designations?