

salbers
-
Posts
643 -
Joined
-
Last visited
Content Type
Profiles
Blogs
Forums
American Weather
Media Demo
Store
Gallery
Everything posted by salbers
-
I like to see the satellite animations alternating with the text - fyi.
-
Spire's SRFS 12z model run has the track moving more to the NE actually passing over New Orleans.
-
Here is James Van Fleet's discussion: https://www.linkedin.com/feed/update/urn:li:activity:7239270198455783424/ I'll suggest a central pressure of 970-975mb. Perhaps that's close to a category 2.
-
James van Fleet video with SRFS model discussion: https://x.com/SpireWxClimate/status/1833165234900451340
-
Here's the story over the next couple of days with the RAP: https://rapidrefresh.noaa.gov/RAP/jsloopUpdated.cgi?dsKeys=rap_ncep_jet:&runTime=2024090721&plotName=totp_full_sfc&fcstInc=60&numFcsts=52&model=rr&ptitle=RAP and RRFS Model Fields - Experimental&maxFcstLen=51&fcstStrLen=-1&domain=full&adtfn=1&resizePlot=1
-
ICON also has vigorous development after the merger: https://www.pivotalweather.com/model.php?m=icon&p=sfcwind_mslp&rh=2024090715&fh=loop&r=gom&dpdt=&mc= GFS is initializing the low at 12z south of where the satellite circulation center is for the former 90L.
-
The RAP shows this merger: https://www.pivotalweather.com/model.php?rh=2024090715&fh=loop&dpdt=&mc=&r=gom&p=sfcwind_mslp&m=rap I'll update the thread title to mention 90L & 91L. Both of these are still distinctly visible on satellite so it will be interesting to see how they can merge. https://col.st/hoN7H
-
2024 Atlantic Hurricane Season
salbers replied to Stormchaserchuck1's topic in Tropical Headquarters
It's a good website though for some reason Microsoft Teams flags it as a security risk. Perhaps Claude can help in tightening this up? -
Is there a parent web site to the ATCF page? I'm having some challenges with the direct link. 35kt is enough for a tropical depression though it may have yet to be classified as such.
-
Discussion of this system in the Spire video with the SRFS: https://www.linkedin.com/feed/update/urn:li:activity:7237851905635299330/
-
What we've been following in the NW Gulf since Aug 30 in the "2024 Atlantic Hurricane Season" thread. Looks like an energetic circulation on visible satellite here: https://col.st/i3X9I One coastal / buoy station (LUIT2) recently had sustained NE winds around 22kt.
-
2024 Atlantic Hurricane Season
salbers replied to Stormchaserchuck1's topic in Tropical Headquarters
Thanks GaWx - Fyi I've mentioned the Spire Hi-res model also showing this since last Friday (with a break over the weekend) as well. The model forecasts were discussed at the time in some online video presentations. This model (called SRFS) has been more consistently to the north than the ICON. One place to see a collection of these videos is here: https://insights.spire.com/jvf -
2024 Atlantic Hurricane Season
salbers replied to Stormchaserchuck1's topic in Tropical Headquarters
La Nina is barely getting started it seems with the SST indices. We might want to give this more time for later in the season. -
2024 Atlantic Hurricane Season
salbers replied to Stormchaserchuck1's topic in Tropical Headquarters
The system in the NW Gulf continues to spin up in the eyes of the Spire and HRRR Hi-res models over the next 48 hours. -
2024 Atlantic Hurricane Season
salbers replied to Stormchaserchuck1's topic in Tropical Headquarters
FYI - both Spire's Hi-res model and the HRRR do some spinup of the Gulf low during the next 48 hours, keeping it more to the north. ICON brings it more to the south like yesterday's run. -
2024 Atlantic Hurricane Season
salbers replied to Stormchaserchuck1's topic in Tropical Headquarters
In the Gulf the ICON model has the low in the western Gulf eventually merging with a wave coming in from the east. Perhaps the western Gulf low is being supported by a short wave visible in water vapor satellite to the west near the Big Bend? https://www.pivotalweather.com/model.php?rh=2024090218&fh=loop&dpdt=&mc=&r=caribbean&p=sfcwind_mslp&m=icon (ICON loop) https://col.st/OeOjg (Water vapor satellite) -
2024 Atlantic Hurricane Season
salbers replied to Stormchaserchuck1's topic in Tropical Headquarters
By September 10 we get this chance in the ECMWF judging from the model trend loop in the East Atlantic. https://www.pivotalweather.com/model.php?m=ecmwf_full&p=sfcwind_mslp&rh=2024090212&fh=198&r=eatl&dpdt=loop&mc= -
2024 Atlantic Hurricane Season
salbers replied to Stormchaserchuck1's topic in Tropical Headquarters
Convection flaring up off the TX coast, though the circulation is more off to the SW. https://col.st/sge0Q -
2024 Atlantic Hurricane Season
salbers replied to Stormchaserchuck1's topic in Tropical Headquarters
Indeed there could also be something of a circulation underneath all the convection south of New Orleans. Pressures are also lower there. -
2024 Atlantic Hurricane Season
salbers replied to Stormchaserchuck1's topic in Tropical Headquarters
Yes the ICON has it drifting offshore toward the S for 8+ days: https://www.pivotalweather.com/model.php?rh=2024090112&fh=loop&dpdt=&mc=&r=caribbean&p=sfcwind_mslp&m=icon On satellite one storm is presently firing just W of the center. https://col.st/5slRG -
2024 Atlantic Hurricane Season
salbers replied to Stormchaserchuck1's topic in Tropical Headquarters
The animation above indeed looks to show a southward drift. -
2024 Atlantic Hurricane Season
salbers replied to Stormchaserchuck1's topic in Tropical Headquarters
Circulation now more evident in the NW Gulf with visible satellite: https://col.st/2RN4G -
2024 Atlantic Hurricane Season
salbers replied to Stormchaserchuck1's topic in Tropical Headquarters
True about the global models. The Spire Hi-res regional model that runs out to 6-days had such development in two consecutive runs on Friday. This is discussed in a video made on Friday: https://www.linkedin.com/in/james-van-fleet-2365b556/recent-activity/all/ Meanwhile at buoy 42002 the pressure is still dropping (overall compared with yesterday) and SW winds picking up. Wind Direction (WDIR): SW ( 230 deg true ) Wind Speed (WSPD): 11.7 kts Wind Gust (GST): 19.4 kts Atmospheric Pressure (PRES): 29.82 in Air Temperature (ATMP): 83.3 °F Water Temperature (WTMP): 87.3 °F Wind Speed at 10 meters (WSPD10M): 13.6 kts Wind Speed at 20 meters (WSPD20M): 13.6 kts Combined plot of Wind Speed, Gust, and Air Pressure -
2024 Atlantic Hurricane Season
salbers replied to Stormchaserchuck1's topic in Tropical Headquarters
Visible satellite animation suggests a circulation center just south of Galveston, though the trough is also sheared to the SE. https://col.st/eOQUB Buoy station 42002 has a pressure of 1012mb at 1740 UTC. Winds: WNW (290°) at 9.7 kt gusting to 13.6 kt Link to data: https://www.ndbc.noaa.gov/obs.shtml Update: at 2110 UTC this station has a pressure of 29.81" or 1009mb. A close 2nd for lowest pressure is Alice TX on land with 29.83". Part of the drop is from the semi-diurnal atmospheric tide, though the trend is clearly down in the graph shown below. Link to the 42002 station (including live data and panoramic camera image): https://www.ndbc.noaa.gov/station_page.php?station=42002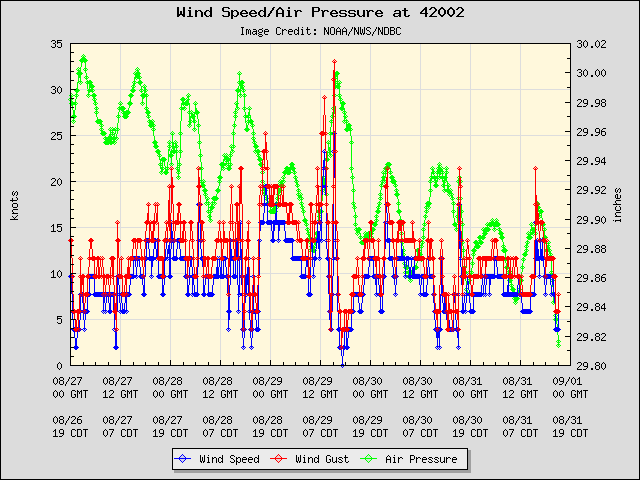
-
Yes this hurricane's large size gives it more total energy and more impact - thus its peak winds (category) are only part of the story.


