TheClimateChanger
-
Posts
4,598 -
Joined
-
Last visited
Content Type
Profiles
Blogs
Forums
American Weather
Media Demo
Store
Gallery
Everything posted by TheClimateChanger
-
Another? We haven't seen this pattern much at all this summer. The highest heat anomalies have been over the Mid Atlantic, Ohio Valley, and Southeast.
-
Pittsburgh, Pa Summer 2024 Thread.
TheClimateChanger replied to meatwad's topic in Upstate New York/Pennsylvania
Looks like some rain on the way for a change. At the moment, the radar depiction looks exaggerated from ground truths. Wheeling has only had 0.01" despite some dark greens and yellows overhead for some time (see below). Cloud ceiling is way up at 12,000 feet, so dry air in the lower levels are making it difficult for the rain to make it all the way to the surface. There are, however, some embedded, slow-moving heavier downpours, especially across Greene and southern Washington Counties. The Washington County Airport recently observed thunder, although no measurable rain has fallen yet.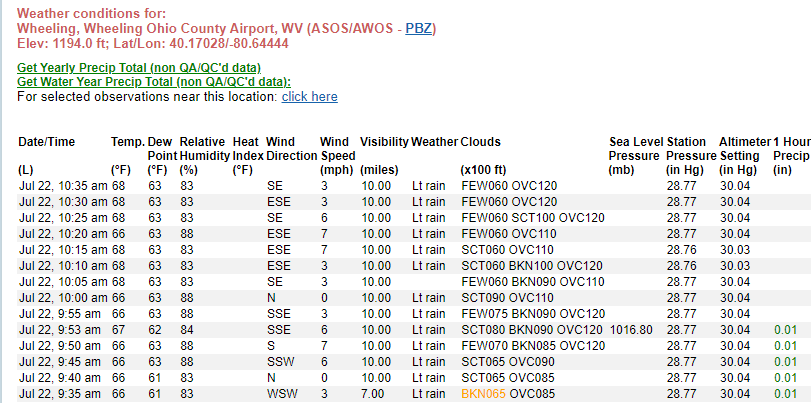
-
Looks like a rough winter for a snow weenie in Miami.
-
Summer 2024 Medium/Long Range Discussion
TheClimateChanger replied to Chicago Storm's topic in Lakes/Ohio Valley
Lots of filthy air up there in Canada. -
Central Pa. Summer 2024
TheClimateChanger replied to mahantango#1's topic in Upstate New York/Pennsylvania
Do you guys think this enormous smoke plume will help to lower temperatures as it moves east? -
Summer 2024 Medium/Long Range Discussion
TheClimateChanger replied to Chicago Storm's topic in Lakes/Ohio Valley
Looks like summer is over, between all the volcanos and this gigantic smoke pall forming over west North America, the sun doesn’t stand a chance. -
2024-2025 La Nina
TheClimateChanger replied to George001's topic in Weather Forecasting and Discussion
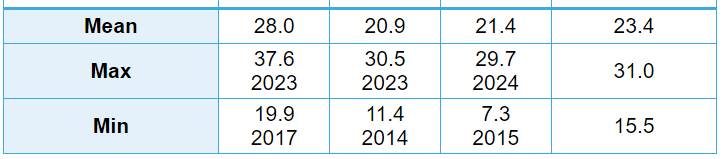
So my conclusion is this: Winter minima have been increasing at Detroit. The trend is, however, lessened by the impact of anomalously cold minima temperatures observed in the first couple of decades after the official observation site moved to the southwest. In recent decades, the trend is actually overstated due to increasing urbanization in the vicinity of the international airport. Moving forward, I would expect mean winter minimum temperatures to continue to climb, reaching the mid 20s F by mid-century (2040s - 2060s) and 30F by the end of this century [perhaps even higher in a heightened carbon scenario]. -
2024-2025 La Nina
TheClimateChanger replied to George001's topic in Weather Forecasting and Discussion
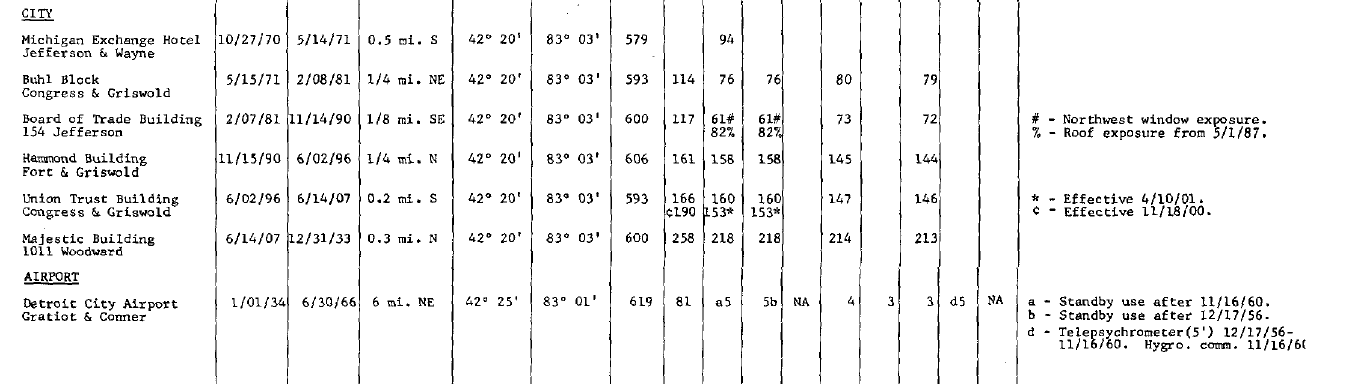
Looking at the historic station thread. We also see good reason to conclude that the minimum temperatures in the 19th century and early 20th century were colder than observed. What we see is this: There was a rooftop exposure in general through 1933, at ever increasingly tall buildings - presumably to accommodate wind and other measurements. A trend which reached its zenith atop the Majestic Building some 218 feet above the ground. From at least 1881 through April 1887, the thermometer was housed in an enclosure on a northwest window of the Board of Trade Building. Looking at the stated height above ground, this appears to have been housed on a 4-6th story window of a building that appears to have been between about 6 and 8 stories high judging by the roof height reported after the station was moved to the roof on May 1, 1887. Rooftop stations have been observed to report higher temperatures than corresponding ground-based stations, and window stations even higher. With proper siting and a location away from the core urban heat island, it is likely that temperatures would have been substantially cooler than reported. For more information on the Majestic Building, see: Majestic Building (Detroit) - Wikipedia
-
2024-2025 La Nina
TheClimateChanger replied to George001's topic in Weather Forecasting and Discussion
In recent decades, the difference between the two sites has gotten smaller as development has increased near the international airport. City Airport still tends to observe higher minima, however. The difference has shrunk to a bit less than 1F. City Airport [2010-2024] DTW [2010-2024]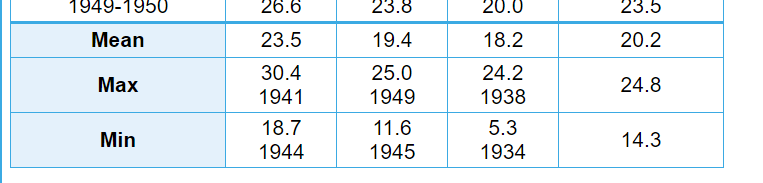
-
2024-2025 La Nina
TheClimateChanger replied to George001's topic in Weather Forecasting and Discussion
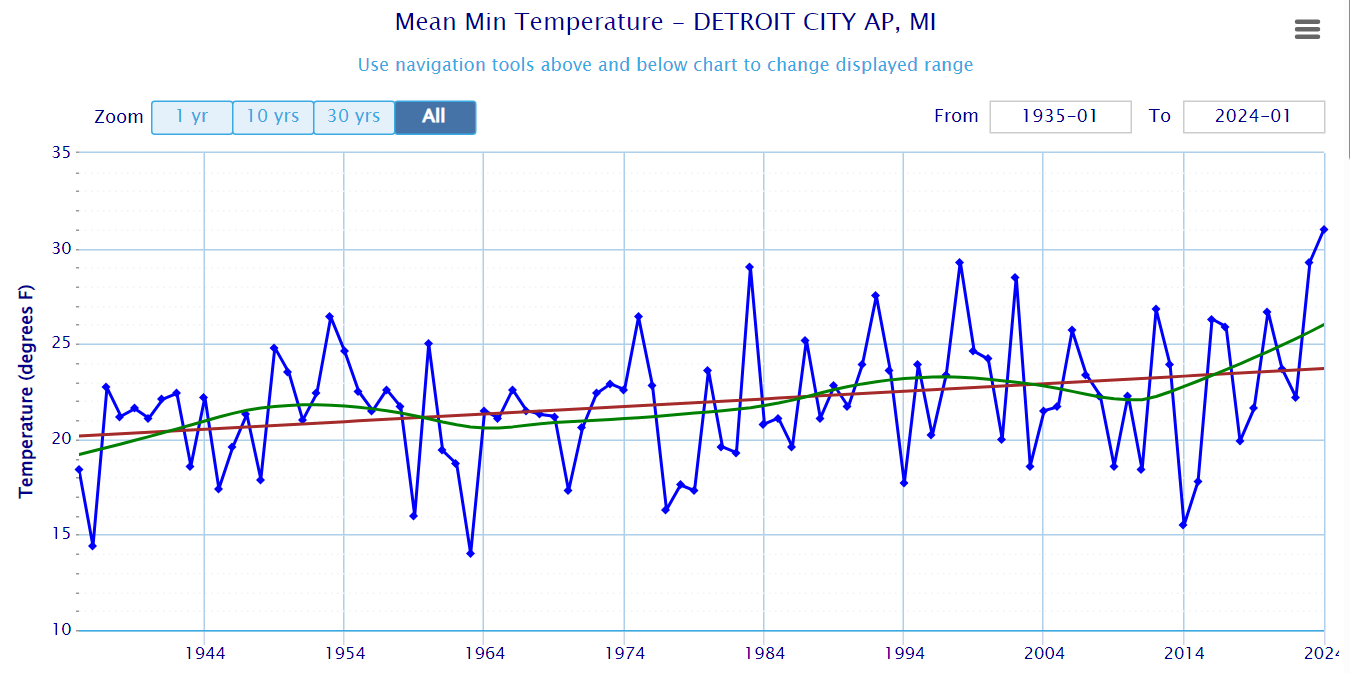
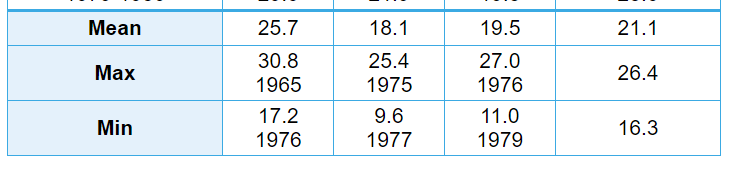
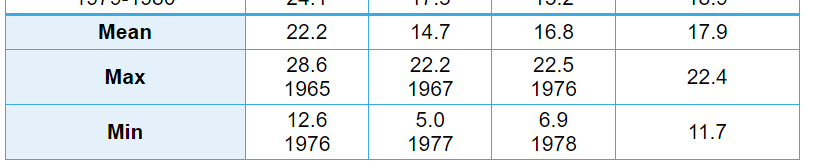
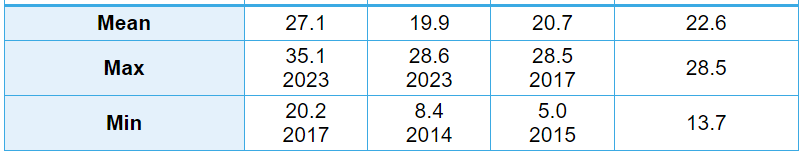
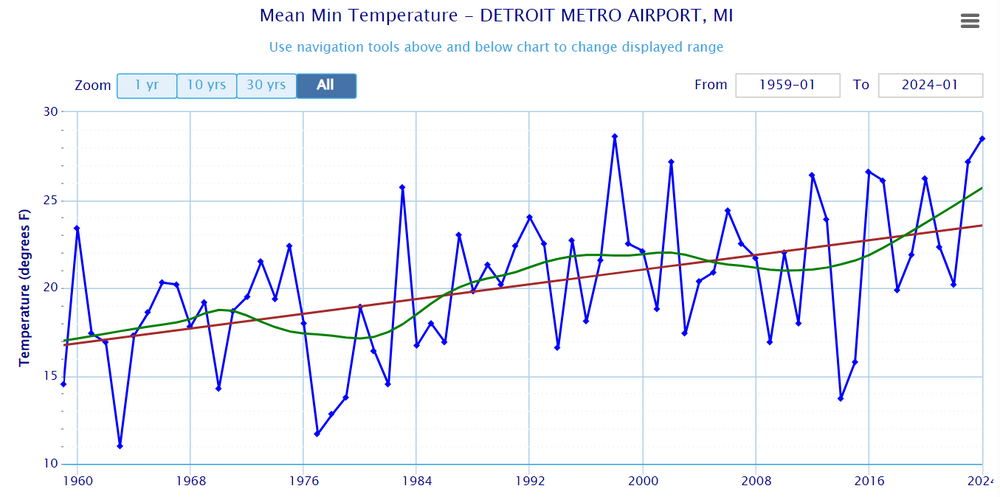
In fact, we see the 1960s and 1970s "cold" spell pretty much evaporates when we correct for site location. Meaning the extreme cold minima present in those decades in Detroit are largely an artifact of moving the official observation site from the urban City Airport location to a low-density, semi-rural or ex-urban site well to the southwest. We see a mean minima of 20.2F at City Airport for the period 1934-1950. The so-called warm winter period. Shockingly, from 1966 to 1980 [the so-called cold winter period], the mean minimum temperature at Detroit City Airport was nearly 1F higher. But at the official observation site [KDTW], it was much colder with a mean minimum temperature more than 2F cooler than the 1934-1950 mean at City Airport and more than 3F cooler than the mean at City Airport for the corresponding time frame. No comparative data for 1934-1950 are available, since record keeping did not begin at the site until 1958. It became the official site for Detroit on July 1, 1966.
-
2024-2025 La Nina
TheClimateChanger replied to George001's topic in Weather Forecasting and Discussion
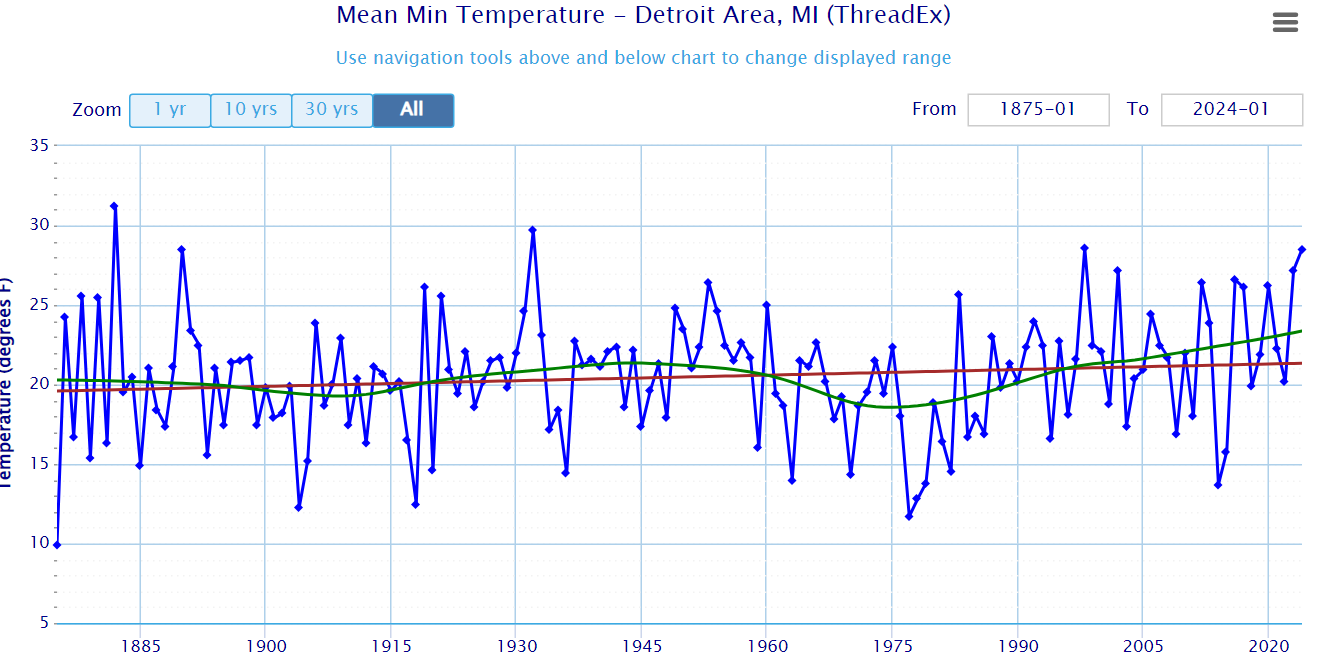
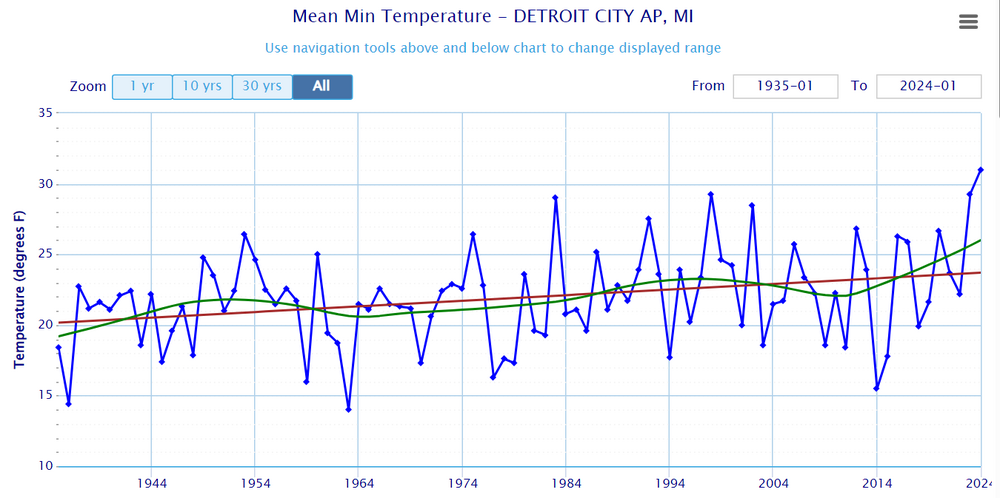
The threaded record does show a positive regression, from a predicted value of 19.6F in 1875 to a predicted value of 21.3F in 2024. The LOESS curve helps to highlight the fact that the vast majority of recent winters have seen mean minima well above the values predicted by a linear regression, suggesting the linear regression is not fully capturing the trend and there has been an acceleration in the increase in winter minima since around 2000. In fact, the trend is greatly affected by changes in site location and instrument exposure, suggesting mean winter minima have warmed faster than shown here. This will be addressed in a follow-up post. Detroit [ThreadEx] Detroit City Airport [KDET] Detroit Metropolitan Wayne Airport [KDTW]
-
Phoenix Experiences its Hottest June on Record
TheClimateChanger replied to donsutherland1's topic in Climate Change
Here's Hagerstown, Maryland for somewhere outside of the core urban area. Not much difference. 9 of top 11 since 2010.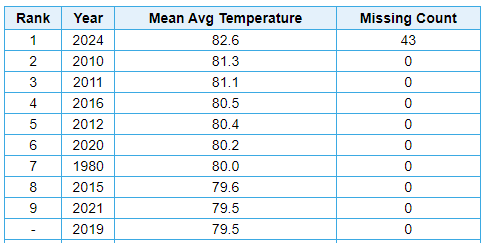

-
Phoenix Experiences its Hottest June on Record
TheClimateChanger replied to donsutherland1's topic in Climate Change
I think this "future" is reality in a lot more places than we'd like to admit. Here's Washington, D.C. - 2024 obviously not done yet, but will almost certainly be in top 5, with decent chance for #1. 9 of top 10 since 2010, only 1 prior to 2000.
-
Phoenix Experiences its Hottest June on Record
TheClimateChanger replied to donsutherland1's topic in Climate Change
The "future" is here in some locations. Future summers could regularly be hotter than the hottest on record | NCAR & UCAR News -
Occasional Thoughts on Climate Change
TheClimateChanger replied to donsutherland1's topic in Climate Change
I suspect the urban heat island was a lot worse in the 1930s. I have seen a lot of photos from that era, and there were like zero trees anywhere. Pittsburgh, no trees. Even the Blue Ridge Parkway was mostly devoid of trees. Basically clear cut everywhere. I think we have billions more trees today than 100 years ago. This probably played a factor in some of the daytime heat. -
Occasional Thoughts on Climate Change
TheClimateChanger replied to donsutherland1's topic in Climate Change
Count me as a denier. Here is the county-by-county minimum temperature ranks for July 1936. What do we see from this map? First, we see it was actually very cold. Second, there's a VERY odd pattern to the map. The rankings are almost inversely proportional to population density. The coldest locations are some of the least densely populated in the Commonwealth. The warmest are the most densely populated counties. If UHI was affecting the trends, we would expect to see the most populated counties look colder on this map, but in fact the opposite is true. USHCN applies some sort some of urban heat island correction, but it looks to me like the correction is in the wrong direction and the UHI was more significant in 1936. -
Pittsburgh, Pa Summer 2024 Thread.
TheClimateChanger replied to meatwad's topic in Upstate New York/Pennsylvania
-
July 2024 General Discussion
TheClimateChanger replied to Chicago Storm's topic in Lakes/Ohio Valley
Season to date [through July 16], temperature and precipitation percentiles: Mean Temperature Total Precipitation -
Matches the longest streak of 100+ at both sites. Should it reach 101F, that would be the first time at both locations with 4 consecutive days of temperatures at or above 101.
-
Imagine spending all this taxpayer money to install an ASOS in Central Park solely for the purpose of "continuity" and placing it in the location least representative of New York City that you can find, so that there is no reliable continuity in the records. Had to be deliberate.
-
Wow! Look at this photo I found on Wikimedia dated May 24, 2024. This is absolutely absurd. Who was the decisionmaker that identified this as an appropriate location to install the ASOS? It doesn't comply with any siting standards. Most backyard thermometers are more reliably sited than this.
-
Pittsburgh, Pa Summer 2024 Thread.
TheClimateChanger replied to meatwad's topic in Upstate New York/Pennsylvania
If we don't get any tomorrow, looks like awhile before any more chances. -
Pittsburgh, Pa Summer 2024 Thread.
TheClimateChanger replied to meatwad's topic in Upstate New York/Pennsylvania
Through the first half of the summer, it has been 2F warmer than 1995. In 1995, the second half of summer [July 16 - August 30] averaged 77.7F. To match 1995's final summer temperature (75.1F), it would need to average about 75.7F for the remainder of summer. -
Pittsburgh, Pa Summer 2024 Thread.
TheClimateChanger replied to meatwad's topic in Upstate New York/Pennsylvania
Morgantown topped out at 94F, ending its streak of 95+ days at 3. That was the longest streak since the 5-day streak ending on August 3, 1995. There were two other occurrences of consecutive 95+ days since then, both of which occurred in 2012 - June 28 & 29, 2012 and July 6 & 7, 2012. Clarksburg, West Virginia reached 98F yesterday and 96F today. The 98F reading was the highest since August 21, 1983, when it also reached 98F. It is the first time in the threaded record with consecutive days of 96F or better since June 26 & 27, 1969. -
Elkins, West Virginia reached at least 96F today [elevation: ~2000 feet]. The last time it was hotter was July 16, 1988, when the temperature climbed to 99F. The only other hotter days in the threaded record are September 3, 1953 (97F), August 6, 1918 (99F), August 7, 1918 (98F), and August 11, 1911 (97F).