TheClimateChanger
-
Posts
4,598 -
Joined
-
Last visited
Content Type
Profiles
Blogs
Forums
American Weather
Media Demo
Store
Gallery
Everything posted by TheClimateChanger
-
Looks like ideal viewing conditions for most of the Midwest. Could be one for the ages.
-
Little if any rain for much of the region over the next week. Good thing we are at the tail end of the growing season. Helene's rains in the Ohio Valley also brought stream flows up substantially. It looked like the lower Mississippi was on a collision course with a third straight record low flow October, but the recent rains have raised river levels along the Ohio and Mississippi significantly.
-
Pittsburgh, PA Fall 2024 Thread
TheClimateChanger replied to TheClimateChanger's topic in Upstate New York/Pennsylvania
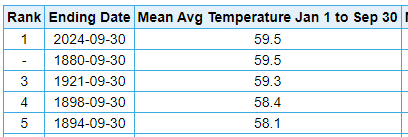
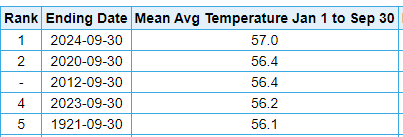
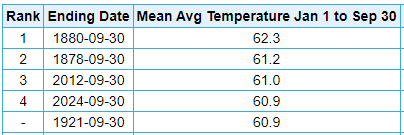
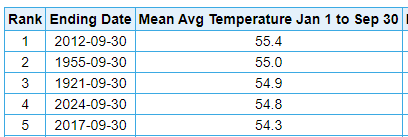
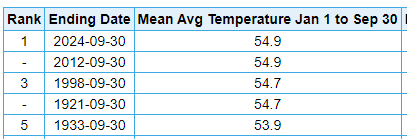
We have officially taken sole possession of 1st place from 1880. As I had noted, 1880 drops off fast with a rather chilly last quarter. 2024 remains 0.2F above the current record holder (1921), which had a fairly ho-hum [only slightly above average] final quarter.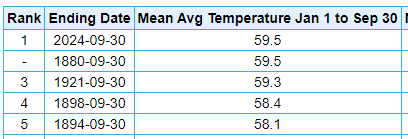

-
Looks like it's making its way east.
-
For those curious about the impact of AGW. I know there's been some back & forth on this. I don't think it's too much of a stretch to see an anthropogenic impact in this record-breaking water vapor transport.
-
Occasional Thoughts on Climate Change
TheClimateChanger replied to donsutherland1's topic in Climate Change
Makes you wonder how much more heat the oceans can hold off the coast of California before they start to lose and we see tropical cyclones and horrific flooding. I think the conventional wisdom is that can't happen, but I can't help but look at these numbers and think something else is going on here and there must be more oceanic heating occurring than they are admitting to.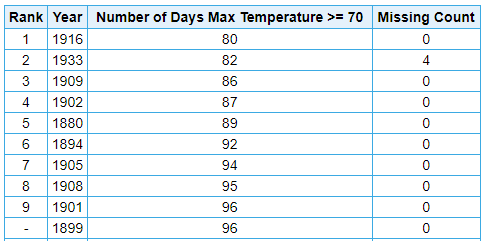
-
Occasional Thoughts on Climate Change
TheClimateChanger replied to donsutherland1's topic in Climate Change
Not just Phoenix, but the entire western United States. I don't know if there's one place that "won" more from climate change than San Diego, California. Used to be a miserably cold place with fewer days at or above 70F than Fairbanks, Alaska receives these days. Now almost the entire year sees comfortable temperatures.
-
Really makes you wonder if the conventional wisdom that we'll see a post-El Nino drop or mean reversion is simply wrong. I've been warning of this for decades now. We think of climate change as this linear process, but the geological record are replete with examples of dramatic climate changes occurring over very short timeframes. Also, there's those "frigid" 1990s and early 2000s again. As someone old enough to remember how this was supposedly a "warm cyclical" period, simply surreal. The 1990s now look colder than the 1880s did in 1990.
-
September 2024 General Discussion
TheClimateChanger replied to Geoboy645's topic in Lakes/Ohio Valley
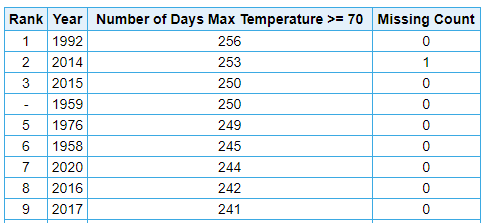
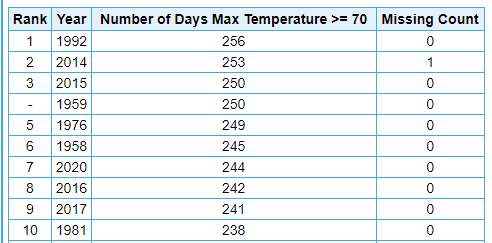
I was going to call Detroit the new San Diego, but man, doing the same analysis at San Diego is just shocking. Like literally unreal. It went from not being too uncommon to see fewer than 100 days of 70+: To now increasingly pushing 250 such days: Wild stuff. And people think there's no variability in San Diego. Look 70+ days can range from 80 to 256. At Detroit, the historic range is 104 to 159 [for the time being]. Also, the San Diego Airport is right on the water, so it's not a case of moving coastal readings to an inland location, which might be a plausible explanation for such a stark change in the behavior of 70+ days. What I think is going on is a lot of days that were previously in the mid to upper 60s are now low to mid 70s.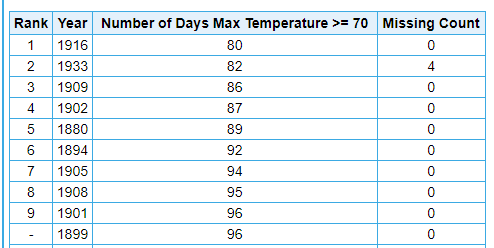
-
September 2024 General Discussion
TheClimateChanger replied to Geoboy645's topic in Lakes/Ohio Valley
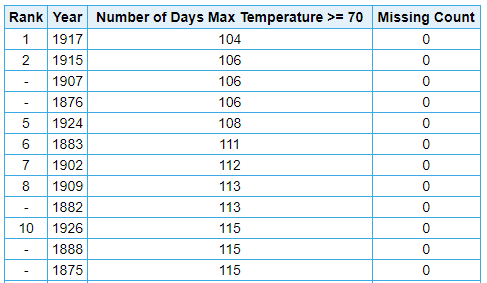
We can see in the late 19th century, turn of the 20th century, it was not uncommon at all to see fewer than 115 such days in an entire calendar year at Detroit. If current trends persist, we will likely see years with 180-200 days of 70+ highs later this century. Really showcasing how as @A-L-E-K likes to say, this is the best climo.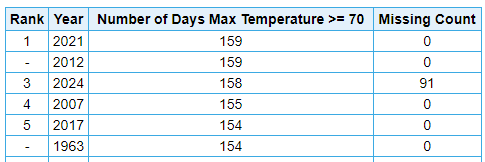
-
September 2024 General Discussion
TheClimateChanger replied to Geoboy645's topic in Lakes/Ohio Valley
Looks like some places may record their most 70+ days on record this year. With 91 days remaining in the year, Detroit is just one day behind the annual record of 159, set in 2021 & 2012.
-
September 2024 General Discussion
TheClimateChanger replied to Geoboy645's topic in Lakes/Ohio Valley
How does that rank among all months? Wonder if some locations had their driest month ever. I think Cedar Rapids had no measurable precipitation, so that clearly would at least tie driest month ever. -
Aircraft land and take off against the wind for fuel savings, so an easterly flow would have an aircraft landing and take off pattern opposite that of the typical westerly regime. For landing, it helps with braking. For takeoff, less speed is required for lift if the air is moving opposite the aircraft.
-
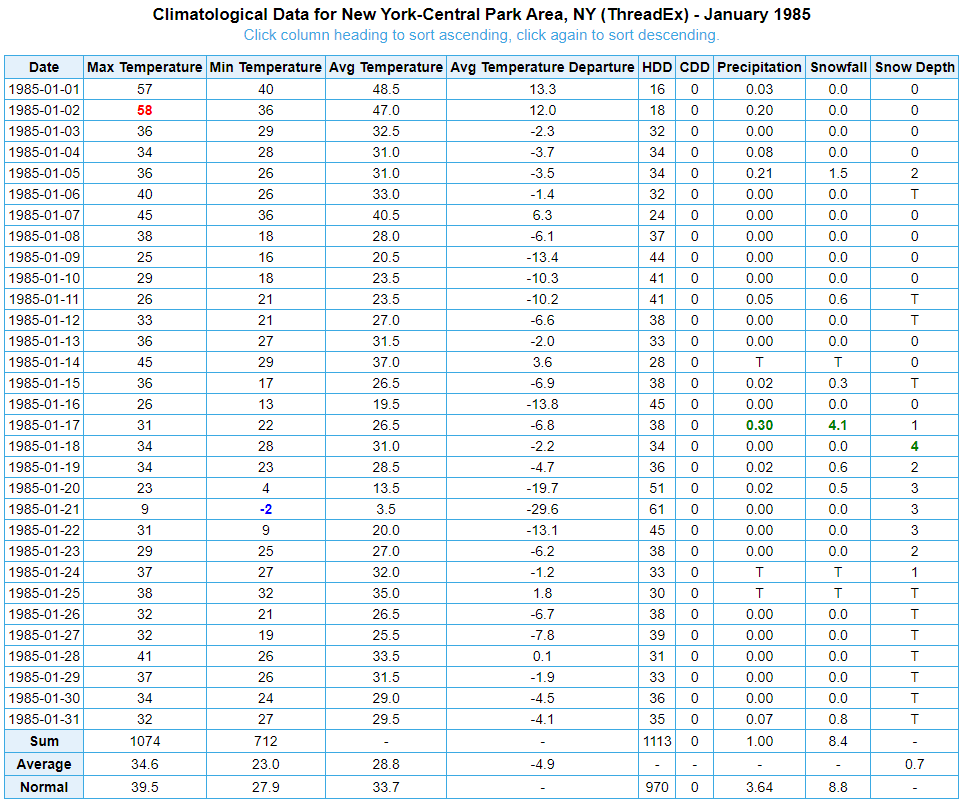
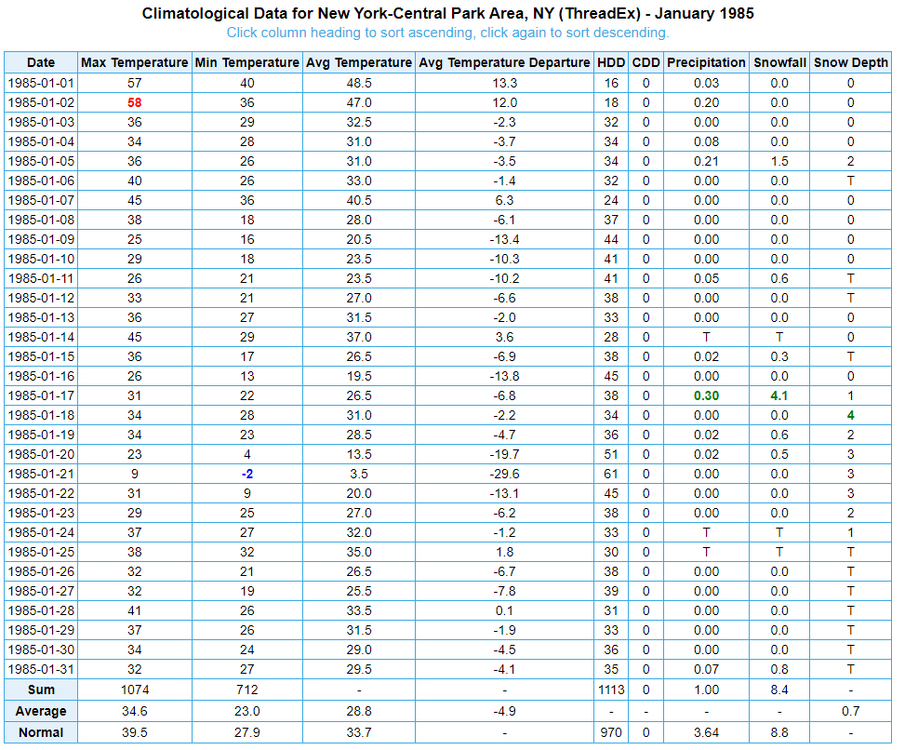
Beautiful month... a bit dry though. I would say snowfall was actually probably somewhat above normal - maybe 10 to 12 inches if measured today. They didn't inflate their snow totals like we do today either. If 4 inches fell, 4 inches was on the ground. If 1.5 inches fell, 1.5 inches was on the ground [and rounded up to 2"].
-
Looks like a rather dry stretch incoming for most.
-
Occasional Thoughts on Climate Change
TheClimateChanger replied to donsutherland1's topic in Climate Change
-
Occasional Thoughts on Climate Change
TheClimateChanger replied to donsutherland1's topic in Climate Change
Does NCEI's Climate at a Glance load for anyone? I always have trouble accessing it. -
Central PA Autumn 2024
TheClimateChanger replied to Itstrainingtime's topic in Upstate New York/Pennsylvania
To be clear, 2024 alone is incredible. But the two-year punch of 2023 & 2024 is unlike anything in recorded history - and some locations have data going back more than 150 years. Just unreal.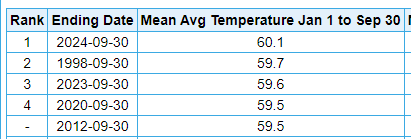
-
Central PA Autumn 2024
TheClimateChanger replied to Itstrainingtime's topic in Upstate New York/Pennsylvania
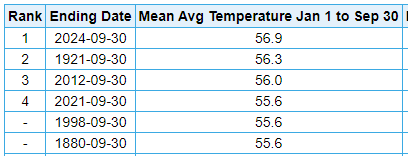
Truly historic warmth in the Commonwealth. Hard to imagine anything warmer than this in western and central Pennsylvania. That 55.6F at Jefferson County Airport [1800' elev] is warmer than 11 years in Philadelphia, despite the latter being near sea level in the far southeast corner of the State and a notorious urban heat island. Harrisburg Pittsburgh *Data before 7/1935 was taken from a substantially lower elevation in the city. Erie Williamsport Scranton/Wilkes-Barre DuBois Bradford
-
Pittsburgh, PA Fall 2024 Thread
TheClimateChanger replied to TheClimateChanger's topic in Upstate New York/Pennsylvania
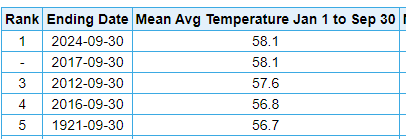
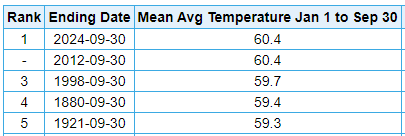
Update through the end of September. Currently tied for first place.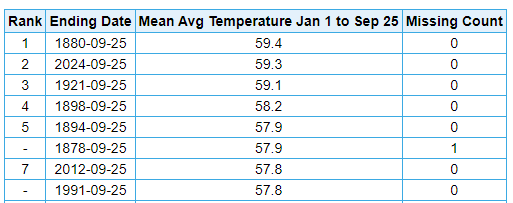
-
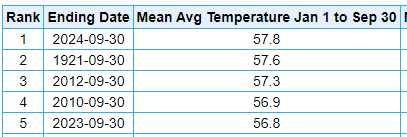
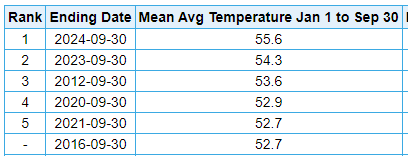
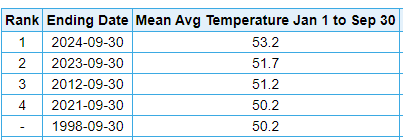
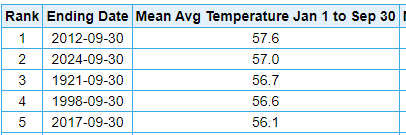
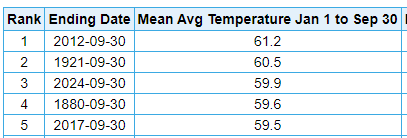
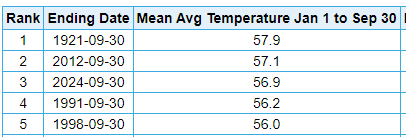
Heading into the last quarter of the year. 2024 shaping up to be a very historic year on the weather front in the GL/OV. Cleveland, Ohio Columbus, Ohio Cincinnati, Ohio *Records from 1878, 1880 downtown at low elevation. 1921 from Abbe Observatory. Detroit, Michigan Indianapolis, IN South Bend, IN Lansing, MI Saginaw, MI
-
Central PA Autumn 2024
TheClimateChanger replied to Itstrainingtime's topic in Upstate New York/Pennsylvania
-
Pittsburgh, PA Fall 2024 Thread
TheClimateChanger replied to TheClimateChanger's topic in Upstate New York/Pennsylvania
What happened to @TimB? Did he get banned? -
September 2024 General Discussion
TheClimateChanger replied to Geoboy645's topic in Lakes/Ohio Valley
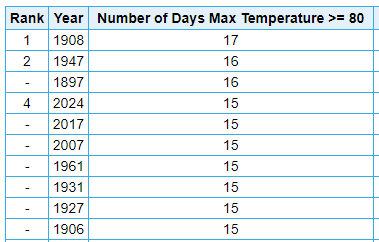
At the airport. It looks like there was one instance of 17 days in the threaded record - 1908. Sounds like a reasonable figure - Detroit had 15, and Chicago 16 days that month. Still a very solid number for September. For context, 42 Augusts and 18 Julys have had 16 or fewer 80+ days at Grand Rapids.