

TheClimateChanger
-
Posts
2,462 -
Joined
-
Last visited
Content Type
Profiles
Blogs
Forums
American Weather
Media Demo
Store
Gallery
Everything posted by TheClimateChanger
-
Upstate/Eastern New York-Springtime?
TheClimateChanger replied to BuffaloWeather's topic in Upstate New York/Pennsylvania
Just to illustrate. Here is the U.S. annual mean temperature trend: The early years are fairly well mixed, but there's definitely some bias below the trend line up until about 1920. However, recent years are almost exclusively above trend - in some cases, way above trend. Since 1998, only 4 years have been colder than the trend, with one additional year (2010) almost smack dab on the trend line. So it looks to me like the warming is accelerating at an alarming pace - not to sound too alarmist! Trend would probably also steepen if they included data from the 1870s and 1880s. While limited most of the available data suggests this period was significantly colder than the turn of the 20th century. -
Upstate/Eastern New York-Springtime?
TheClimateChanger replied to BuffaloWeather's topic in Upstate New York/Pennsylvania
Interesting... crazy to see my hometown has warmed over 3.5F since 1961, but not shocking. One thing I'll say is these are based on linear regressions, which are also used to estimate the trend. However - and maybe it's just me - but I've noticed these temperature trend linear regressions tend to have the majority of early years lying below them and the majority of the recent years lying above them. If the change were truly linear, you would expect a mix of years above and below throughout the period of examination. What this suggests to me is the trend is actually increasing - that is, as more and more years go by, we should expect to see the slope of the trend lines increase over time. Not a good sign. -
Occasional Thoughts on Climate Change
TheClimateChanger replied to donsutherland1's topic in Climate Change
There was like a very impressive 8-day heat wave in July 1936, but the rest of the month was a "summer of yesteryear" with comfortable temperatures and low humidity. It's like a weeklong heat wave that gets blown way out of proportion. I wonder why Bastardi never uses his population weighted metrics on that summer? It looks like the core of the heat was in places where nobody lives. -
Occasional Thoughts on Climate Change
TheClimateChanger replied to donsutherland1's topic in Climate Change
Was 1936 really the hottest summer in U.S. history? Looking at the data, I'm not sure it was... it looks mostly to be an artifact of the algorithm. Hagerstown, Maryland was 3.8 degrees below modern norms in July 1936, yet Washington County, Maryland shows up as warmer than normal for that month due to extreme smoothing likely as a result of bad figures elsewhere. One county south at Martinsburg, West Virginia, it was supposedly 2.8 degrees above modern norms. This is obviously ridiculous... there are days that month where the Martinsburg co-op are 10+ degrees warmer than the Hagerstown site? Morgantown came in cooler than normal with a mean temperature of 72.8F, yet somehow Monongalia County is shown as above normal with a mean of 72.7F. How could the county - mostly rural, with high mountain ridges in the east - have a mean only 0.1F lower than the observations from the city, which undoubtedly would have been the warmest spot in the county? So much bad data from that era, yet it gets repeated ad nauseum. The low temperatures at many spots were truly at summer of yesteryear levels in July 1936 with many nights in the 40s and 50s. No need for A/C with that radiational cooling. Look at Brookville, PA (not even high elevation - 1100') - the monthly mean low temperature was below 50F that month. 4th coldest minimum temperatures at Morgantown, WV in the station thread. 6th coldest in the Wheeling, West Virginia station thread. Allegany and Cattaraugus Counties in New York have minimum temperatures 2nd and 3rd lowest in the entire data set. More importantly, it's supposedly a tiny fraction warmer than last summer, but those numbers don't include the Great Lake water temperatures, which cover a large expanse of the U.S. If you include those lake surface temperatures, I think several recent years would easily surpass it. Just look at the lake surface temperatures at Buffalo from that year... Frozen over until May 16th, only year later was 1971. Hasn't been freezing water temperatures in the month of May since 1996. https://www.weather.gov/buf/LakeErieMay. Water temperatures stayed well below seasonal averages all through June: https://www.weather.gov/buf/LakeErieJune Water temperatures opened July much cooler than normal, briefly spiked to near record levels with the major heat episode, then cooled back down. The 70 degree reading on July 31, 1936 hasn't been matched since the chilly summer of 2009. It's only been cooler on that date on three years (1956, 1962 and the volcanic summer of 1992): https://www.weather.gov/buf/LakeErieJuly -
I just remember growing up and years like 1988 & 1995 were considered the gold standard for summertime heat with media driven to a frenzy about it being a once-in-a-lifetime deadly heat wave. It's crazy to me to see so many recent summers post similar, or warmer, mean temperatures than those years.
-
Only Toledo, earlier this year. But none of those cities reach 100+ with any degree of frequency. I think you're right about part of the cause - its simply more humid today than it was during some of the past heatwaves. But I do think some of it just comes down to more reliable equipment and better techniques for measuring the temperature. Even 1988... do a little research on the HO-83 that was in common use at the time at these first order climate sites... it was hot, no doubt, but there's a plethora of scientific studies showing a considerable warm bias related to that device on Tmax, especially on sunny days with light winds. It was so bad NOAA/NWS had to replace it in the mid 1990s. I think it's going to continue to be harder to see 100+ days with modern shielded, fan-aspirated equipment properly sited on the ground... in the 30s-50s, it was very common for city and airport records to be collected on building rooftops, which have since been shown to have a considerable warm bias. I think, to some extent, this effect was known at the time, but it was just deemed more convenient to house all of the equipment together and the anemometer needed to be located way above ground for reliability.
-
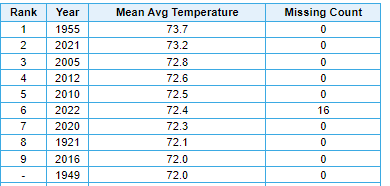
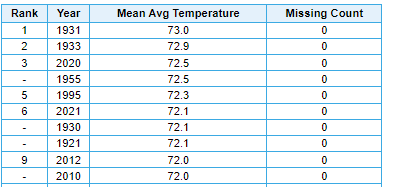
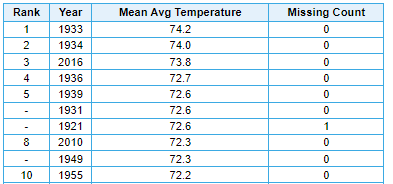
It seems like the Midwest has seen more than its fair share of heat in recent years, no? Not sure how much hotter y'all want it to get. Top ten hottest summer lists in Ohio and Michigan are dominated by recent summers. Lansing, Michigan: 2005, 2010, 2012, 2016, 2020, 2021, and 2022 (so far) in top ten. Saginaw, Michigan: 2010, 2012, 2020, and 2021 in top ten. Flint, Michigan: 2010 & 2016 in top ten. Detroit, Michigan: 2005, 2010, 2011, 2012, 2016, 2018, and 2021 in top ten. Alpena, Michigan: 2005, 2012, 2016, 2018, and 2021 in top ten. Traverse City, Michigan: 2005, 2012, 2016, 2018, 2020, and 2021 in top ten. Toledo, Ohio: 2002, 2005, 2010, 2020, 2021 and 2022 (so far) in top ten. Mansfield, Ohio: 2016, 2018, 2020 and 2021 in top ten. Cleveland, Ohio: 2005, 2010, 2012, 2016, and 2018 in top ten. Akron, Ohio: 2016, 2018, 2020, 2021, and 2022 (so far) in top ten.
-
Pittsburgh/Western PA Summer 2022 Discussion
TheClimateChanger replied to Ahoff's topic in Upstate New York/Pennsylvania
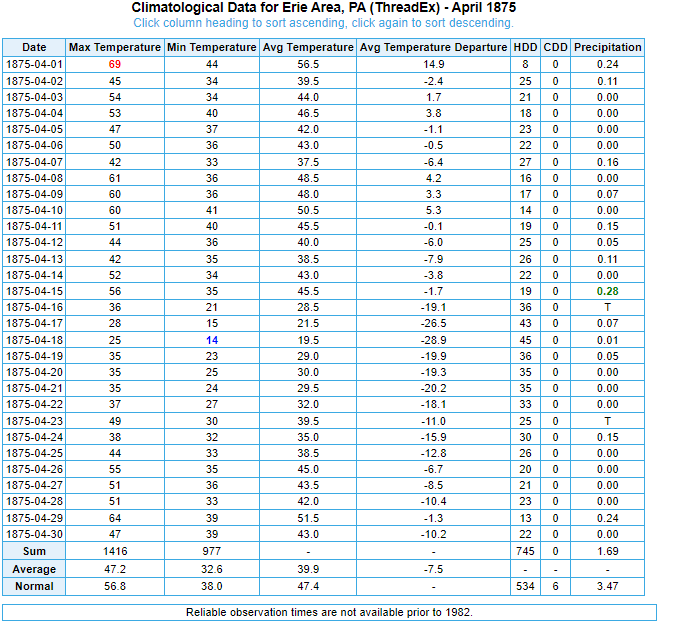
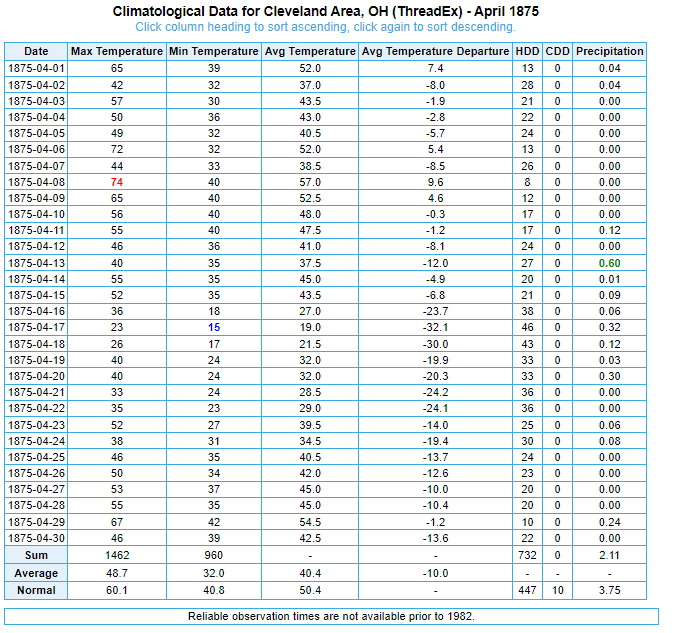
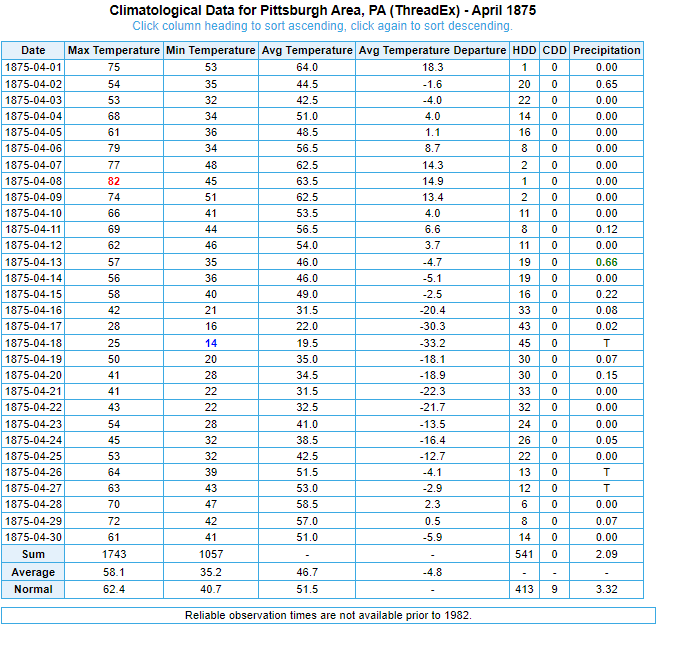
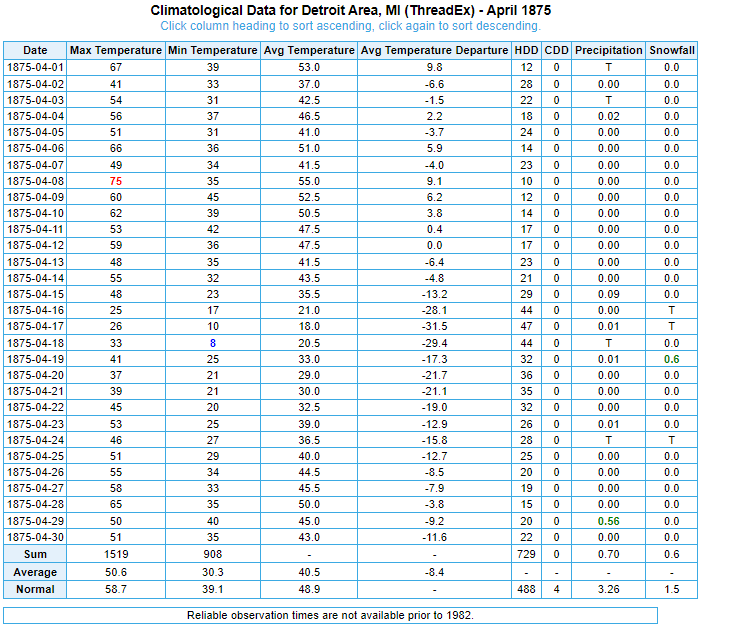
Well, April 1875 was like the 19th century opposite of "Morch" of 2012. But, yeah, it could have been worse.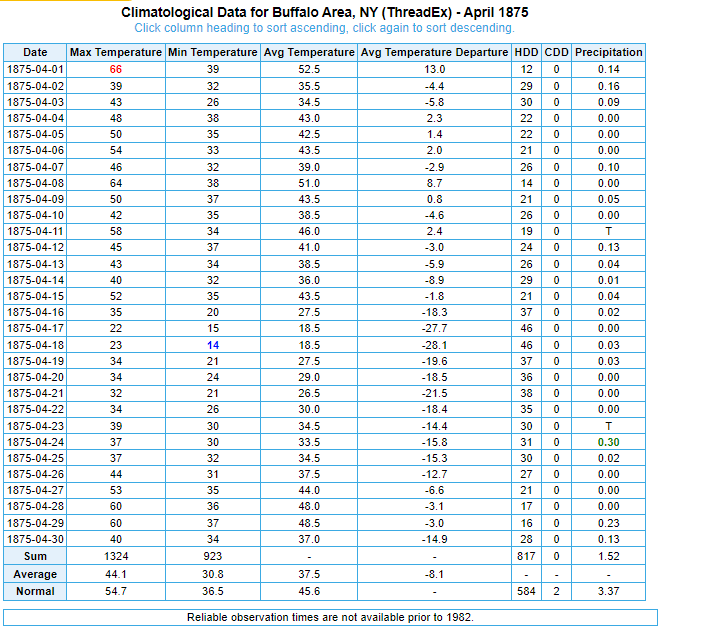
-
Pittsburgh/Western PA Summer 2022 Discussion
TheClimateChanger replied to Ahoff's topic in Upstate New York/Pennsylvania
Anyways, even reading three degrees too high, I'm glad they didn't remove the record high on the 4th. It's probably still more reliable than the rooftop records from various buildings downtown for the first 65 years of the station thread. Or the 1870s method of taking the temperature from a sheltered window. The Weather Bureau actually continued to take records downtown until at least 1978... from 1953-1978, it averaged about 2.6F higher than PIT airport. And from 1936-1951, it was about 1.9F warmer than AGC. From 1999-2021, AGC averaged 0.6F warmer than PIT, suggesting the difference was pretty robust from the two periods. Although I suspect some of the 1800s records are probably 3-4F too warm compared to modern readings. https://www.weather.gov/pbz/stationhistory -
Pittsburgh/Western PA Summer 2022 Discussion
TheClimateChanger replied to Ahoff's topic in Upstate New York/Pennsylvania
Not sure, but it would appear the sensor or fan malfunctioned or failed in the last handful of days of August and was corrected around September 11. I looked at the hourly observations on the 9th and PIT had humidity levels generally between 87%-90%. You'd expect with such heavy rain humidity would be closer to 97-100%. I'm not really sure how it happens, but I noticed the humidity will often appear lower when a station is reporting too high, which is somewhat weird because the humidity is supposed to be calculated separately and the dewpoint determined from the temperature and humidity. So you would think it would just result in the dewpoint also registering too high. Perhaps a fan issue, where the air parcel was being heated by the heating elements in the ASOS without proper ventilation which would leave the dewpoint unaffected, and thus result in the humidity registering too low? -
Pittsburgh/Western PA Summer 2022 Discussion
TheClimateChanger replied to Ahoff's topic in Upstate New York/Pennsylvania
Not really much difference between the two sites. Since 1999, July has averaged 0.24" drier at AGC and 0.4F warmer on the mean. Maxima have averaged just 0.1F warmer, and minima 0.7F warmer. With that said, the difference between the two sites this July is within the variance of prior years. Although there have been only 3 years in which AGC was more than 1.0F warmer in the month of July, and all three of them AGC was substantially drier than PIT (1999, 2000 & 2005 average: 2.79" drier). This suggests at least a portion of the difference of the difference was due to drier soil moisture conditions. In the table below, red means AGC was warmer and blue means PIT was warmer. Note that the mean difference looks like it should be 0.5F, but that's due to rounding (the values to two decimal places are 73.85F and 73.43F). What's interesting is how much of a difference that 0.42F difference would make to the record warmest Julys. NWS PBZ has a list of 12 Julys in which the mean was at or above 77.0F - all but one was from the old downtown site. The lone exception is July 2020, at 77.3F (or 8th place on the list). But if AGC were still the official source of records, July 2020 would move up to 4th place (78.2F) and 1999, 2011, and 2012 would all place in the top ten.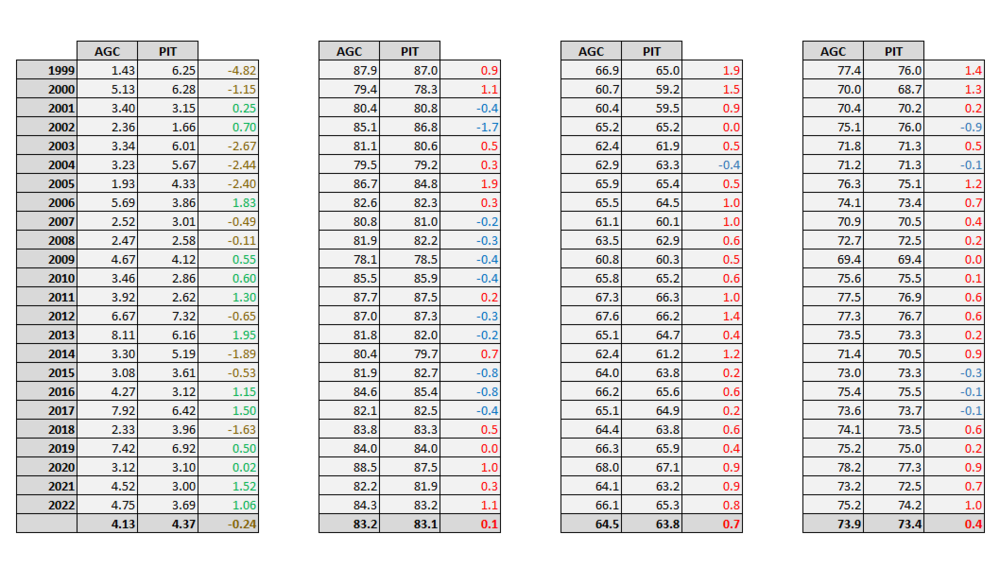
-
Pittsburgh/Western PA Summer 2022 Discussion
TheClimateChanger replied to Ahoff's topic in Upstate New York/Pennsylvania
Maybe I have too much time on my hands, but I went through every first-order climate site in PIT's CWA and all surrounding offices (CLE, ILN, BUF, RLX, CTP, and LWX) and only a few locations have received 4 or fewer 90+ days. Most lower elevations sites have 2-4x that amount, with up to 5-7x that amount in the Coastal Plain and a couple of other particularly low elevation sites. Except for MFD and HLG, there's BUF next to Lake Erie and several high elevation sites with DUJ at 1800' and EKN, BFD, BKW and JST all above 2000'. Even AGC (which was the official site from 7/1/1935-9/16/1952) is at 9 days, which honestly seems more in line with most observations. PIT 4 DUJ 4 MFD 4 BUF 4 HLG 3 EKN 3 BFD 2 BKW 1 JST 0 -
Upstate/Eastern New York-Springtime?
TheClimateChanger replied to BuffaloWeather's topic in Upstate New York/Pennsylvania
Not sure how you put up with that. Syracuse has 4 more 90+ days this year alone than Pittsburgh International has recorded in the last two summers combined. -
Yes, not nearly as much movement as the wintertime. With that said, they keep redefining what is normal. Based on 1961-1990 normals, June was 67.8, July 71.9, and August 70.3. Now its 69.9 (+2.1F), 73.9 (+2.0F), and 72.3 (+2.0F). So it would have been considered more than 4F above normal as recently as 2000.
-
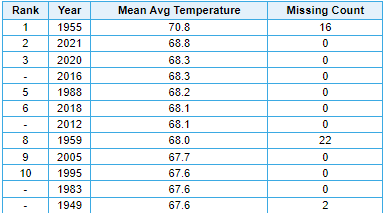
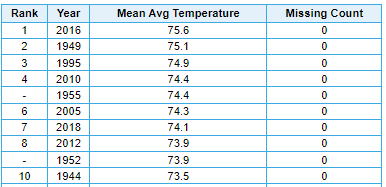
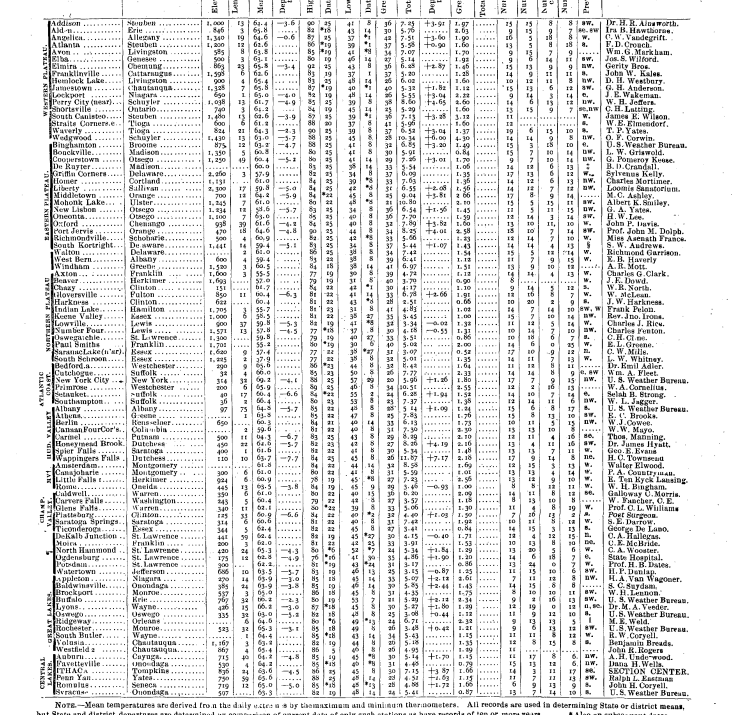
What an incredible summer of yesteryear in New York State. I see people say these temperatures are unattainable due to urban heat island, but when you look at the actual data, you see that it was unimaginably cold upstate as well with numerous locations in the 30s - even several freezing temperatures.
-
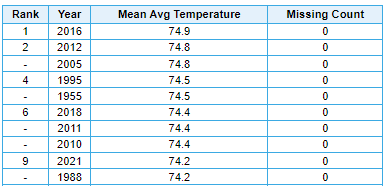
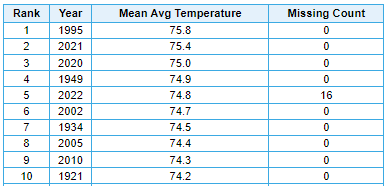
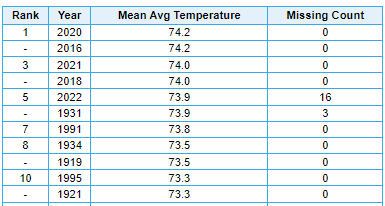
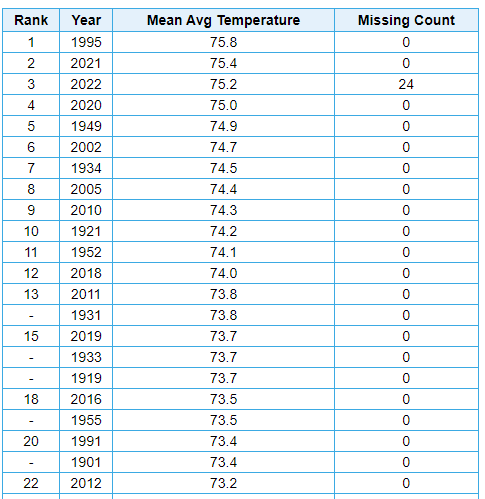
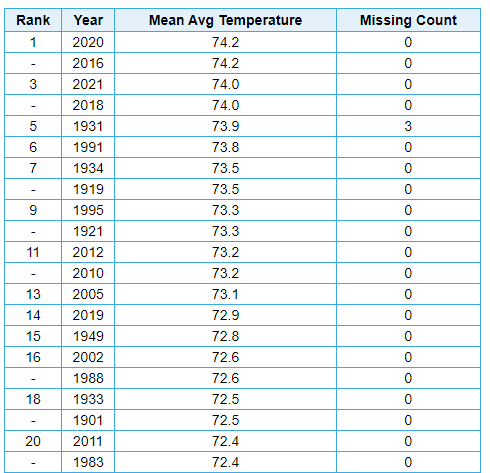
Very similar story in Toledo. If the summer ended today, it would rank as third warmest in between 2021 and 2020. I question the 1995 readings as the temperatures in the era (late 1980s - mid 1990s) were inflated by the HO83 hygrothermometer, which is known to have a substantial warm bias. Still very impressive... looking at top 22 of 150 years, we find 2002, 2005, 2010, 2011, 2012, 2016, 2018, 2019, 2020, 2021, and 2022. Just incredible never-ending heat, making the Dust Bowl era look mild. What really makes these readings impressive is Toledo Express airport is in a rather rural setting, situated in the middle of a green belt including the Oak Openings Preserve and Maumee State Forest, with nothing but cornfields and soybeans and scattered towns for hundreds of miles to the west.
-
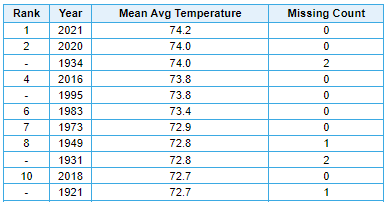
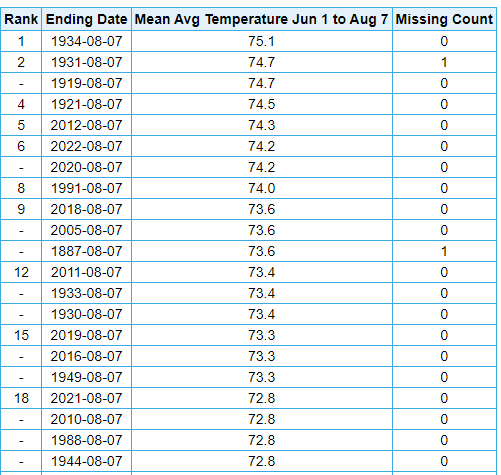
In what has become a familiar refrain, another scorching summer in northern Ohio. Akron is currently tied for 6th place with 2020 for the warmest June 1 - August 7 periods on record. While the top four on this list are all quite old, those years all cooled in late August. So all of the current record hottest summers are exclusively very recent (see table below). If the summer ended today, it would tie for hottest on record with 2020 and 2016. 2018 and 2021 are tied for third hottest on record at two-tenths of a degree below 2020 and 2016. It appears 2022 should follow suit, and end up somewhere in the mix with these recent years. What's especially interesting and mindboggling is the station thread includes records from the University of Akron, and then present-day Akron Fulton International Airport for a while, before moving to the Akron-Canton Regional Airport in Green Township. If records were still taken at KAKR, a lot of these recent readings would be another 0.5-1F warmer.
-
Dishonorable mention to the other Italian-American weather guru named Joe, for this atrocious forecast at the Heartland Institute's ICCC in July 2014:
-
E PA/NJ/DE Summer 2022 OBS Thread
TheClimateChanger replied to Maxwell03's topic in Philadelphia Region
East Nantmeal sounds like a magical place. You even have one fewer 90+ day than Bradford at 2100’ near the New York state line. And if there’s a heat island in McKean County, there must be a heat island everyone. 40,000 people and 1,000 square miles. -
Heck, we get 1995-esque temperatures today, and people comment about how it's a mild summer of yesteryear.
-
Well, I'm sure the current system isn't perfect. It's probably the best system we have. When was the ASOS installed at PHL? Those readings from 1993-1995 are probably hyper-inflated from the HO-83 sensors, which are known to have read 1-3C too high during the daytime on sunny days with light winds - which are common during the summertime. https://climateaudit.org/2007/08/22/the-ho-83-hygrothermometer/ I wonder how warm summers like 1987, 1988, 1991, 1993, 1994, and 1995 from that era would be if measured today? Maybe the volcanic summer of 1992 would be even a bit cooler. I remember hearing about how 1995 was a deadly, once in a lifetime heatwave - yet now it barely even stands out as hot, as it seems almost every summer is nearly as warm or warmer these days.
-
Good point. I just took a look at PHL and PNE, and they are always about the same for daytime highs in the summer with PHL may be averaging a couple tenths of a degree warmer. Looks like it's spot on, at least for daytime maxima - unless PNE sensor also somehow broke this summer as well. I don't know about the low temperatures, although I wouldn't think it's a sensor issue if daytime maxima are unaffected. With that said, could be change in ground cover around the station, or construction? Not saying that's the case, just a possibility. Either way clearly not two degrees off. Funny how there's always so much discussion about sensors all of a sudden reading too high, but never the inverse. Even when Albany was reporting a solid 3F low for well over a year...
-
Pittsburgh/Western PA Summer 2022 Discussion
TheClimateChanger replied to Ahoff's topic in Upstate New York/Pennsylvania
It means the long-range GFS is actually going to be correct for a change. -
Actually, fourth warmest at Freehold if you toss 1983 (missing the entire months of June and July - that average is based on just the first three days of August), and 1987 (missing the entire month of June - the coolest summer month - and therefore inflated).
-
Pittsburgh/Western PA Summer 2022 Discussion
TheClimateChanger replied to Ahoff's topic in Upstate New York/Pennsylvania
Farmer’s Almanac forecast just dropped. We’re on the edge of significant shivers, slushy, icy and snowy, and unreasonably cold and snowy.


