TheClimateChanger
-
Posts
2,462 -
Joined
-
Last visited
Content Type
Profiles
Blogs
Forums
American Weather
Media Demo
Store
Gallery
Everything posted by TheClimateChanger
-
Fall 2022 Pittsburgh/Western PA Discussion
TheClimateChanger replied to Ahoff's topic in Upstate New York/Pennsylvania
Yes, pretty crazy to see entire runs of the GFS extending into the middle of December with not a flake of snow. I mean, obviously, this wouldn't be unprecedented by any stretch of the imagination. But, normally, the GFS would at least be manufacturing fake snow storms by this point in time. -
Fall 2022 Pittsburgh/Western PA Discussion
TheClimateChanger replied to Ahoff's topic in Upstate New York/Pennsylvania
That storm next weekend on the 12Z GFS looks intriguing. -
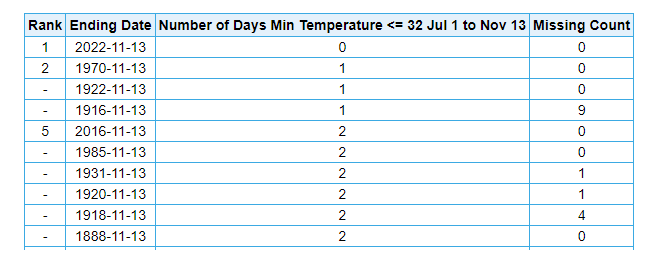
Made it down to 31F at Akron/Canton yesterday (11/15), which is the latest freeze on record. The prior record was November 13, set in 1916, although there's some missing data from that year on days when it may have dropped to 32F or below - including no data on October 12, when lows on the surrounding days were 35 and 37 and there was a comment indicating a heavy frost; no data on October 26, when lows on the surrounding days were 36 and 33; and no data on November 12, when lows on the surrounding days were 34 and 28. Observations in 1916 were taken at the University of Akron. The second latest on record (with no missing data) is November 12, 2016. Still no freeze at CLE; however, that's not quite as rare there. One of eight years with no freeze as of 11/16, although 6 of those were 1932 or earlier when observations were taken on rooftops downtown. Not exactly ideal for radiational cooling. The only other year without a freeze by this point at Cleveland Hopkins International Airport was 2016.
-
First official freeze at Detroit yesterday. 2nd latest on record. Latest is November 15, 1946. Looks like Akron/Canton, Ohio and Wheeling, West Virginia are both experiencing their latest freezes on record. Previous records were November 12, 2016 & November 4, 1900, respectively. Wheeling will probably drop to 32 or below by midnight, and Akron/Canton by tomorrow.
-
Latest first freeze on record at Akron/Canton (see below). At Cleveland, it's one of only 12 years where there has not yet been a freeze. Although only three of those were at Hopkins International Airport (1946, 2016, 2022). Unless there's a midnight low in the cards, it looks like this will stretch at least another day - 2 of the 12 had their first freeze on the 14th, so it should be top ten at CLE. No. of days at or below 32 (through 11-13):
-
Fall 2022 Pittsburgh/Western PA Discussion
TheClimateChanger replied to Ahoff's topic in Upstate New York/Pennsylvania
-
Fall 2022 Pittsburgh/Western PA Discussion
TheClimateChanger replied to Ahoff's topic in Upstate New York/Pennsylvania
It's a shame that the remnants of Nicole couldn't time up better with the cold air pressing in. Could have gotten a classic La Nina snow storm a la November 1950. I wonder if we'll see any big storms this winter with the La Nina conditions in the Pacific. It was 80 degrees on November 1, 1950 - big warm spell that year end of October into the beginning of November. -
Fall 2022 Pittsburgh/Western PA Discussion
TheClimateChanger replied to Ahoff's topic in Upstate New York/Pennsylvania
Looks like it made it down to freezing this morning. I was going to say not to count the chickens before they hatch. Very easy to get a “surprise” freeze this time of the year with the long nights if it’s a bit clearer or calmer than expected. We had heavy frost here each of the last two mornings. -
Fall 2022 Pittsburgh/Western PA Discussion
TheClimateChanger replied to Ahoff's topic in Upstate New York/Pennsylvania
Ten years ago today was the last time NWS Pittsburgh issued a blizzard warning. Same for Charleston, WV; Blacksburg, VA; and Morristown, TN offices. Oddly enough, it looks like less than 2 months later, a swath of blizzard warnings occurred from Arkansas to northern Ohio, which was the last time any of those areas have seen the issuance of blizzard warnings. -
Occasional Thoughts on Climate Change
TheClimateChanger replied to donsutherland1's topic in Climate Change
Well, 1972, 1982 and 1998 were all strong to extreme Ninos, so there was a lot of heat to dissipate. I don't think this triple dip La Nina was preceded by a strong El Nino which is curious. -
Maybe oak trees, but this is false. Look at the Halloween 1993 snowstorm in Cincinnati (and that's far south), and there are very few leaves on the trees. Clearly not bare, but most of the leaves had fallen. If there had been trees still in leaf with that widespread 6"+ storm, there would have been power outages all over the place. Which did not happen because there weren't many leaves left. We certainly didn't have leaves in northern Ohio, except on some oaks, after Halloween like in recent years.
-
Fall 2022 Pittsburgh/Western PA Discussion
TheClimateChanger replied to Ahoff's topic in Upstate New York/Pennsylvania
Not to be overly pedantic but official records did not move to PIT until September 15, 1952, at which time the airport was called The Greater Pittsburgh Airport. I realize some sources incorrectly show data back to 1949 as belonging to PIT, but this is incorrect. The airport didn't even open until 1952. You can see the actual records in the NCEI records vault (see September 1952 below). So 1949-50, 1950-51 and 1951-52, which all appear in the table above, were actually observed at AGC not PIT.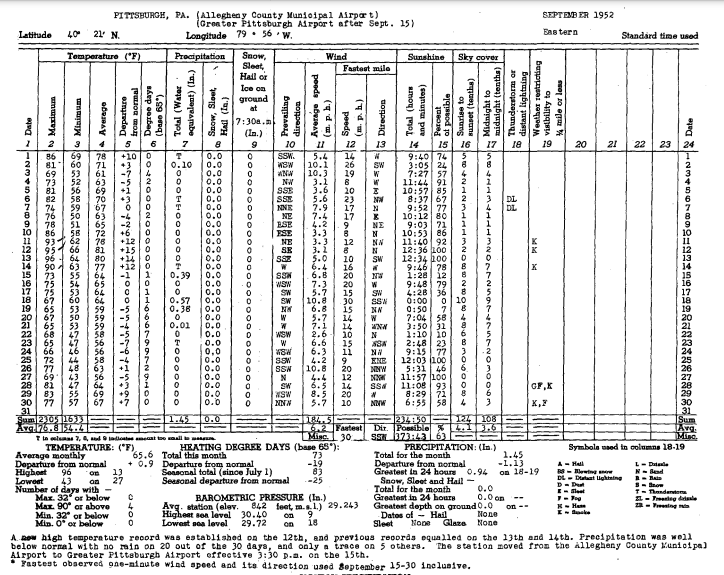
-
Occasional Thoughts on Climate Change
TheClimateChanger replied to donsutherland1's topic in Climate Change
Not good news with all of the drought. Looks like these multi-year Ninas may be becoming more frequent due to climate change. https://www.washington.edu/news/2022/10/03/study-suggests-la-nina-winters-could-keep-on-coming/ -
It looks 2011-2012 might be a decent analog as well, which was a multi-year ENSO?
-
Do you guys think 1988-1989 is a good analog for the upcoming winter? I noticed Joe Bastardi indicated that this was the coldest start to October since 1988, although I know he can sometimes take liberties with data. Regardless, I thought that was interesting since I also recently read that the Mississippi River at Memphis recently went below the prior record low set in 1988. So both years had widespread drought across the CONUS, a chilly October, and a similar ENSO state at this point - although 1988-1989 went on to become a strong La Nina whereas I believe most forecasts for this winter are weak to moderate La Nina.
-
Fall 2022 Pittsburgh/Western PA Discussion
TheClimateChanger replied to Ahoff's topic in Upstate New York/Pennsylvania
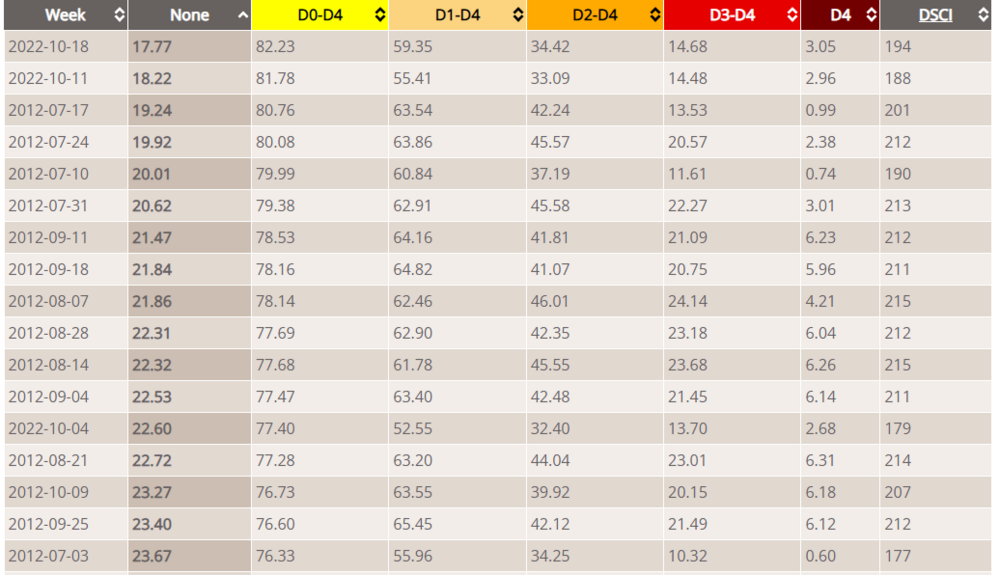
Only 17.77% of the country not in some drought designation level, which is the lowest amount since they've been producing the drought monitors (which go all the way back to 1/4/2000).
-
Yesterday's drought monitor (valid 10/18) shows the least amount of the U.S. not in some drought designation (D0-D4) since they've been producing the drought monitor (back to 1/4/2000). Only 17.77% of the U.S. was not in one of the drought categories. The previous record was 18.22% the prior week (10/11/2022). Third place is 7/17/2012, when only 19.24% was not designated in a drought category.
-
Fall 2022 Pittsburgh/Western PA Discussion
TheClimateChanger replied to Ahoff's topic in Upstate New York/Pennsylvania
Well, officially. But almost everybody had way more than that across the region. -
Fall 2022 Pittsburgh/Western PA Discussion
TheClimateChanger replied to Ahoff's topic in Upstate New York/Pennsylvania
Where is this storm track in January? Only ever happens in the fall when it’s still too warm for snow - like Superstorm Sandy, although that one happened later in the month and gave the mountains a nice pasting. -
Central PA Summer 2022
TheClimateChanger replied to Voyager's topic in Upstate New York/Pennsylvania
Two days above 90F was the 5th most on record, and it was the first June ever to reach or exceed 90F. -
Central PA Summer 2022
TheClimateChanger replied to Voyager's topic in Upstate New York/Pennsylvania
Well - it's all relative. Bradford is about as non-urban and highly elevated as you get, and is was the 2nd hottest summer (of 64 years) there. Of course, it's like 10 degrees cooler than Harrisburg - but it's still warming every bit as fast, if not faster.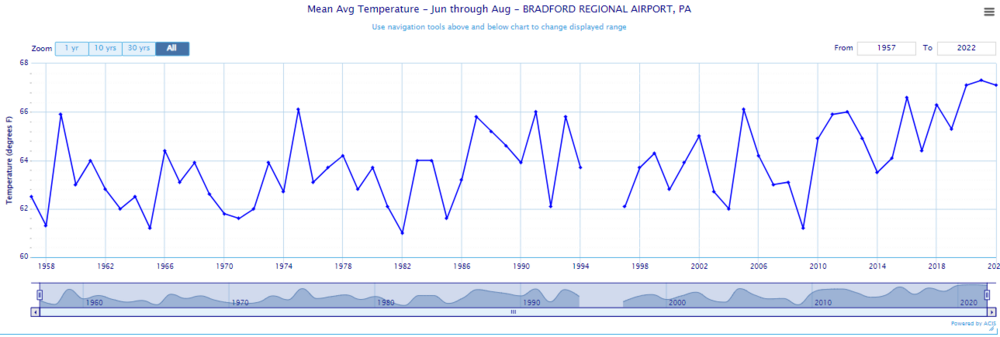
-
Central PA Summer 2022
TheClimateChanger replied to Voyager's topic in Upstate New York/Pennsylvania
Pretty balanced overall. Highs were 3.4F above normal, and lows were 3.7F above normal. 14 days were at or above 90F, 8.5 more than normal. And 10 more than have been recorded at Pittsburgh International this entire year. 000CXUS51 KCTP 010634CLMMDTCLIMATE REPORT NATIONAL WEATHER SERVICE STATE COLLEGE PA234 AM EDT THU SEP 01 2022......................................THE HARRISBURG PA CLIMATE SUMMARY FOR THE MONTH OF AUGUST 2022...CLIMATE NORMAL PERIOD 1991 TO 2020CLIMATE RECORD PERIOD 1888 TO 2022WEATHER OBSERVED NORMAL DEPART LAST YEAR'S VALUE DATE(S) VALUE FROM VALUE DATE(S) NORMAL ................................................................TEMPERATURE (F)RECORD HIGH 104 08/07/1918 08/06/1918 LOW 45 08/31/1976 HIGHEST 95 08/09 96 08/12 08/04 LOWEST 59 08/13 60 08/03 08/05 AVG. MAXIMUM 88.1 84.7 3.4 86.8 AVG. MINIMUM 69.5 65.8 3.7 69.9 MEAN 78.8 75.2 3.6 78.3 DAYS MAX >= 90 14 5.5 8.5 12 DAYS MAX <= 32 0 0.0 0.0 0 DAYS MIN <= 32 0 0.0 0.0 0 DAYS MIN <= 0 0 0.0 0.0 0 PRECIPITATION (INCHES)RECORD MAXIMUM 10.67 1933 MINIMUM 0.53 1995 TOTALS 1.14 3.77 -2.63 5.88 DAILY AVG. 0.04 0.12 -0.08 0.19 DAYS >= .01 8 10.0 -2.0 14 DAYS >= .10 3 6.2 -3.2 9 DAYS >= .50 1 2.5 -1.5 4 DAYS >= 1.00 0 1.0 -1.0 2 GREATEST 24 HR. TOTAL 0.54 07/31 TO 08/01 1.85 08/17 TO 08/18SNOWFALL (INCHES)RECORDS TOTAL 0.0 MM TOTALS 0.0 0.0 0.0 0.0 SINCE 7/1 0.0 0.0 0.0 MM SNOWDEPTH AVG. 0 0 DAYS >= 1.0 0 0.0 0.0 0 GREATEST SNOW DEPTH 0 0 MM 24 HR TOTAL MM MM DEGREE DAYSHEATING TOTAL 0 1 -1 0 SINCE 7/1 0 0 0 MM COOLING TOTAL 435 319 116 421 SINCE 1/1 1206 1021 185 MM ................................................................WIND (MPH)AVERAGE WIND SPEED 6.1 HIGHEST WIND SPEED/DIRECTION 39/300 DATE 08/04 HIGHEST GUST SPEED/DIRECTION 50/300 DATE 08/04 SKY COVERPOSSIBLE SUNSHINE (PERCENT) MM AVERAGE SKY COVER 0.50 NUMBER OF DAYS FAIR 8 NUMBER OF DAYS PC 18 NUMBER OF DAYS CLOUDY 5 AVERAGE RH (PERCENT) 61 WEATHER CONDITIONS. NUMBER OF DAYS WITH THUNDERSTORM 10 MIXED PRECIP 0 HEAVY RAIN 3 RAIN 3 LIGHT RAIN 12 FREEZING RAIN 0 LT FREEZING RAIN 0 HAIL 0 HEAVY SNOW 0 SNOW 0 LIGHT SNOW 0 SLEET 0 FOG 2 FOG W/VIS <= 1/4 MILE 0 HAZE 4 - INDICATES NEGATIVE NUMBERS.R INDICATES RECORD WAS SET OR TIED.MM INDICATES DATA IS MISSING.T INDICATES TRACE AMOUNT.$$ -
Central PA Summer 2022
TheClimateChanger replied to Voyager's topic in Upstate New York/Pennsylvania
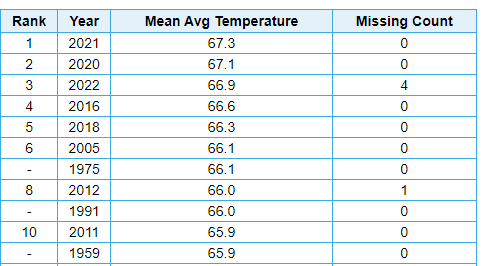
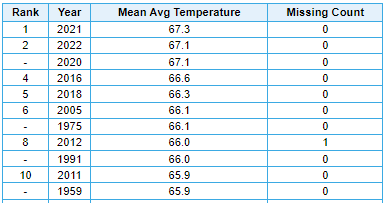
Another scorching summer for central parts of the Keystone state. With one day left, Harrisburg is tied for 5th hottest summer (out of 135 years), Williamsport is in 9th place (out of 128 years), Altoona is in 12th place (out of 75 years), and Bradford is tied for 2nd place (out of 64 years). In all cases (except for Bradford, where this summer is tied with 2020 for second place), it is cooler than each of the last two summers. Below are the numbers and placement. In brackets, I indicated what the ranking would have been prior to 2016. There have been several hot summers just in the past 7 years - with 2016, 2018, 2020, and 2021 showing up in the top ten at many sites, and 2019 also appearing at Harrisburg. This also marks the 5th consecutive summer with at least one of the following 4 sites observing a top ten warmest summer. Harrisburg, PA (T-5th place) [Prior to 2016: T-2nd place] Williamsport, PA (9th place) [Prior to 2016: 7th place] Bradford, PA (T-2nd place) [Prior to 2016: 1st place] Altoona, PA (T-12th place) [Prior to 2016: T-8th place]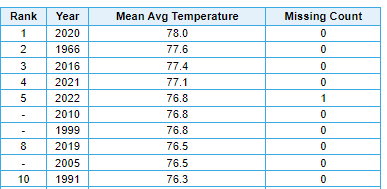
-
Pittsburgh/Western PA Summer 2022 Discussion
TheClimateChanger replied to Ahoff's topic in Upstate New York/Pennsylvania
We've really lucked out on the 90+ front locally. Most of the region has seen way more 90+ days (as in double digits). Pittsburgh has only had 4 days, but Morgantown has had 15, Youngstown 10, Canton/Akron, OH 16, Cleveland 13. Even Erie has had 5, and DuBois (1800') 4. And I should note the 4 days is the official numbers from PIT Airport. YMMV, as AGC has had 9 90+ days. And I'm sure if there were still weather observations taken in the city, it would easily be in the double digits. -
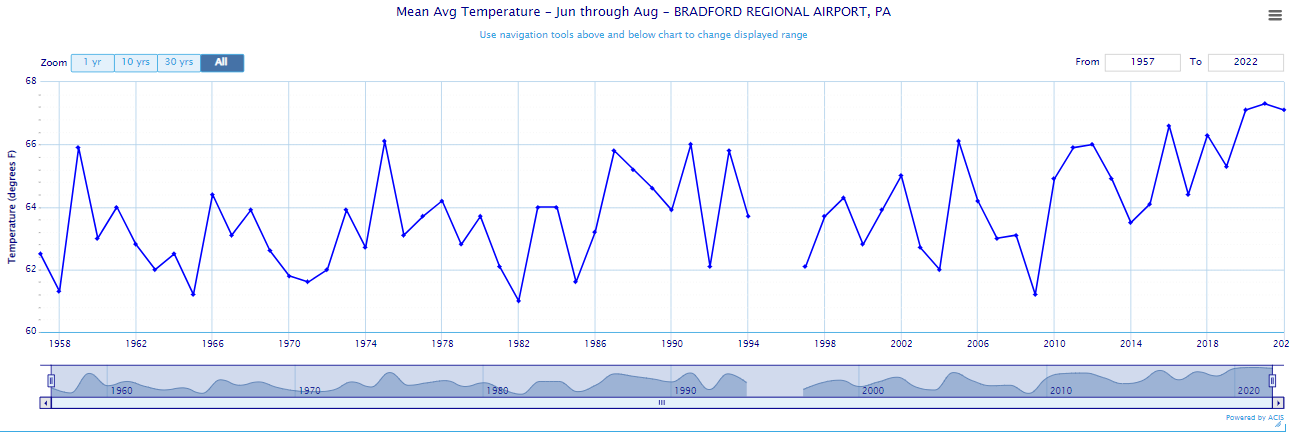
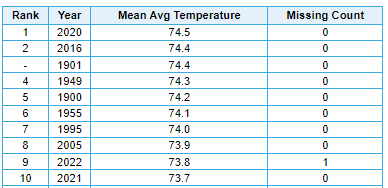
Do you think this is a start of a new trend? I didn't realize global warming would cause lapse rates to decrease until Joe Bastardi posted on July 16th of this year that the lapse rates aren't changing. But I think lapse rates are decreasing because that would explain why rural, extremely low population density locations, in the mountains show as much, or more warming, than big urban areas at lower elevations (like Bradford, Pennsylvania - shown below, with the ten warmest summers since 1957). That would be the opposite of what would be predicted by the theory of the urban heat island effect. So if lapse rates are, in fact, decreasing, will that lead to greater atmospheric stability in the summertime and less convective rainfall? I think what may happen is the rain will become less frequent, but when it does rain, it will fall heavier from the increase in atmospheric water vapor. Which I think is consistent with what the models show, by and large. If this is true, then hopefully state and local governments will prepare for more frequent droughts, and even possible fire weather conditions, in the warm season, even while total precipitation is steady or increasing.