TheClimateChanger
-
Posts
4,598 -
Joined
-
Last visited
Content Type
Profiles
Blogs
Forums
American Weather
Media Demo
Store
Gallery
Everything posted by TheClimateChanger
-
Wow, mighty impressive. Must be one of the latest 80F days on record in South Bend, I'd reckon.
-
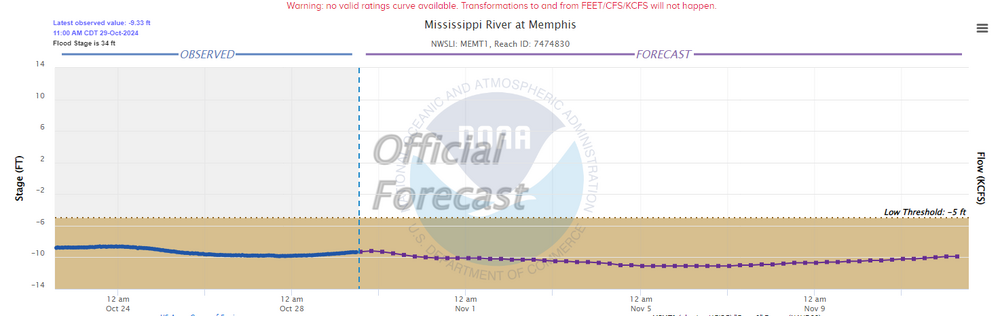
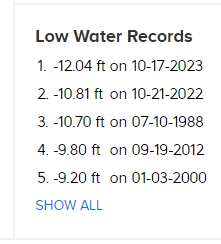
Looks like the lower Mississippi might approach the record low levels set last October in the upcoming days. Army Corps going to be out there doing some dredging work, I'm sure.
-
Occasional Thoughts on Climate Change
TheClimateChanger replied to donsutherland1's topic in Climate Change
"We do a lot of firsts. Let me tell you folks, we do a lot of firsts" - Donald J. Trump -
-
Central PA Autumn 2024
TheClimateChanger replied to Itstrainingtime's topic in Upstate New York/Pennsylvania
Guardian summer came to an unceremonious end thanks to the Yankees. -
Central PA Autumn 2024
TheClimateChanger replied to Itstrainingtime's topic in Upstate New York/Pennsylvania
Are we still allowed to use that phrase? -
Pittsburgh, PA Fall 2024 Thread
TheClimateChanger replied to TheClimateChanger's topic in Upstate New York/Pennsylvania
KDKA going with 28 inches of snow this year. -
Wow. Wheeling, West Virginia had its driest summer and driest fall to date back to back.
-
Maybe at the top of the stone castle! But zero chance with a properly sited station 5 feet AGL. I wonder how many record lows New York was cheated out of in that era due to improper siting?


-
Interesting. Went to take a look at this alleged streak in 1924, and one thing that caught my eye: High of 66, low of 45, with a general heavy frost throughout the Park. Wtf? I feel like you need to chop 10F off these old records to make them comparable to modern day readings. What a joke!
-
Central PA Autumn 2024
TheClimateChanger replied to Itstrainingtime's topic in Upstate New York/Pennsylvania
I know somebody said it felt warmer this month than the numbers bear out. Not sure if it's the same in Harrisburg, but I saw this graphic from NWS Pittsburgh. You can see highs have averaged a whopping 6F above normal, but lows have been less than 1.5F above normal, making the mean temperature lower than it might seem. -
E PA/NJ/DE Fall 2024 Obs/Discussion
TheClimateChanger replied to Rtd208's topic in Philadelphia Region
DEP says things are in good shape statewide.- 1,105 replies
-
- 2
-

-
- tropics
- heavy rainfall
- (and 5 more)
-
Pittsburgh, PA Fall 2024 Thread
TheClimateChanger replied to TheClimateChanger's topic in Upstate New York/Pennsylvania
Although I don’t think anyone would mind a repeat of 1950-51, but I doubt that’s in the offing this year. -
Pittsburgh, PA Fall 2024 Thread
TheClimateChanger replied to TheClimateChanger's topic in Upstate New York/Pennsylvania
Could be the first freeze officially at PIT tonight. The forecast has lows right around freezing in Allegheny County. Looks like they’ve discontinued frost and freeze advisories for the season. If it doesn’t reach freezing at the airport, this would be the first time since 1949-1951 (a three year period) when records were kept at AGG, where the first freeze occurred in November in consecutive years. -
Occasional Thoughts on Climate Change
TheClimateChanger replied to donsutherland1's topic in Climate Change
-
Central PA Autumn 2024
TheClimateChanger replied to Itstrainingtime's topic in Upstate New York/Pennsylvania
Yeah, I don't think they would stand much of a chance against THE Pennsylvania State University. But at least it would present a more interesting "story" than in years past. -
Central PA Autumn 2024
TheClimateChanger replied to Itstrainingtime's topic in Upstate New York/Pennsylvania
Would have been nice to have a matchup of undefeated Pitt and The Pennsylvania State University this season. -
Central PA Autumn 2024
TheClimateChanger replied to Itstrainingtime's topic in Upstate New York/Pennsylvania
Election Day continuing to look mostly benign. In fact, the GFS suggests that a fair amount of the Commonwealth may see no rain through Election Day, with generally light totals elsewhere. Some much needed rains showing up in the center of the country, however, with more than 2 inches in a swath from West Texas to Iowa. -
Central PA Autumn 2024
TheClimateChanger replied to Itstrainingtime's topic in Upstate New York/Pennsylvania
It's about time. These late sunrises are brutal. -
The 100F record high for 10/27, set in 2016 is the latest 100F+ on record at Phoenix, so that's certainly well within reach.
-
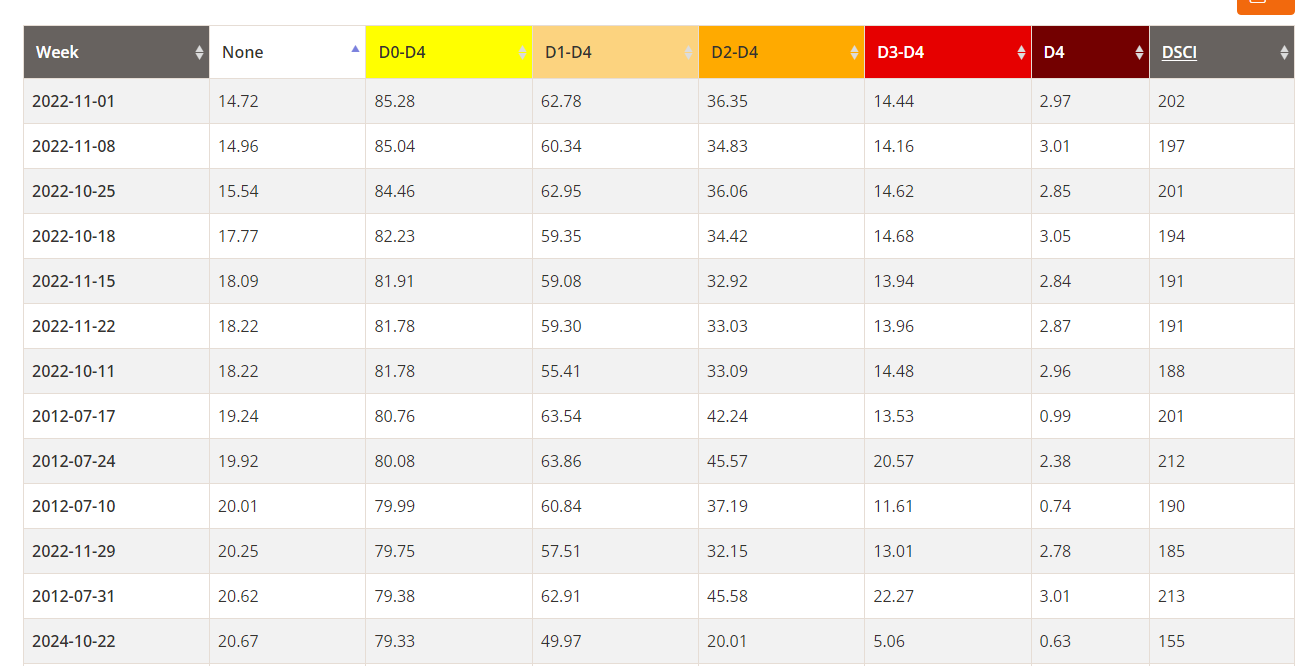
Also, with today's update, this week is the 13th highest percentage of D0-D4 for the CONUS since the Drought Monitor began in 2000. Although a lot less coverage of "severe" drought with the current stretch than the periods in 2022 & 2012, reflecting the more short-term nature of the deficits. While 79.33% of the CONUS is in D0-D4, nearly 30% of that area is just abnormally dry and not in one of the drought designations.

-
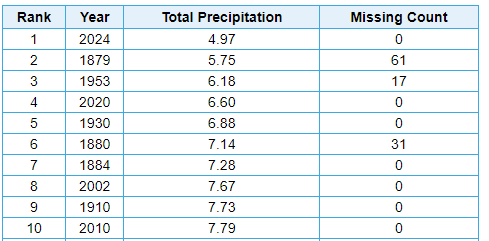
Was a hot and dry summer in the Mountaineer state. Helene brought some relief but mainly to southern areas. October has returned to a lack of rainfall. Driest and second hottest at Wheeling. Note: 1879 missing June & July, 1953 missing final 17 days of August, and 1880 missing one month of data.

-
Central PA Autumn 2024
TheClimateChanger replied to Itstrainingtime's topic in Upstate New York/Pennsylvania
Highs have been warmer, so maybe that's part of it. If the month ended today, only 8 years were warmer. And, of those 8, only 4 were more than 1F warmer. And 2 of those years (1947 & 1963) were decades ago. Also been sunnier than usual. Skycover is averaging 3/10 for the month. Cool nights have kept the overall departures down, in a reversal of most recent months. -
Central PA Autumn 2024
TheClimateChanger replied to Itstrainingtime's topic in Upstate New York/Pennsylvania
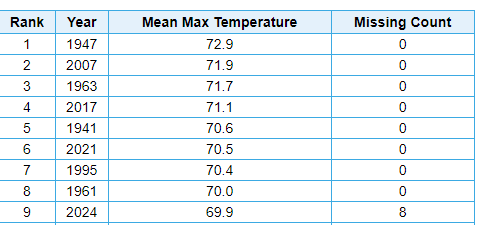
Per xMacis, at Harrisburg, the month-to-date would be 15th warmest on record at Harrisburg, although it bumps up to ninth warmest if you categorize by average maximum temperature. Should drop some before the end of the month with cooler weather until the last 2 or 3 days.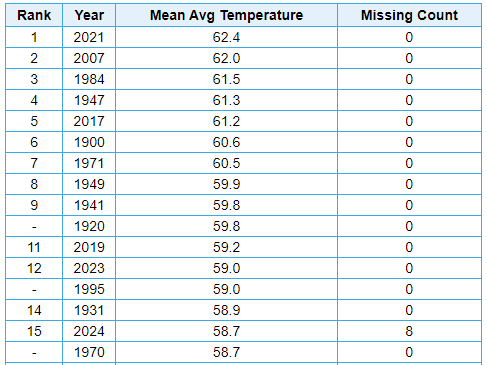
-
Central PA Autumn 2024
TheClimateChanger replied to Itstrainingtime's topic in Upstate New York/Pennsylvania
Here's what the 00z GFS has for Election Day afternoon. Looks like it should be a pleasant day for voting in much of the Commonwealth.