TheClimateChanger
-
Posts
4,598 -
Joined
-
Last visited
Content Type
Profiles
Blogs
Forums
American Weather
Media Demo
Store
Gallery
Everything posted by TheClimateChanger
-
Wow, weird how much hotter it was in Staunton than everywhere else in 1919!
-
Pittsburgh, PA Fall 2024 Thread
TheClimateChanger replied to TheClimateChanger's topic in Upstate New York/Pennsylvania
-
Central PA Autumn 2024
TheClimateChanger replied to Itstrainingtime's topic in Upstate New York/Pennsylvania
You can keep saying it but you're wrong. The 2:56 pm observation is a METAR report, not a raw 5-minute report [which are reported every five minutes beginning at the top of the hour]. The raw readings are based on the temperature rounded to the nearest degree Celsius, and then converted to Fahrenheit, which is why they can vary +/- 1F from what is reported. METAR observations, on the other hand, report the temperature to the nearest decimal degree Celsius. In this case, the actual [non-rounded] temperature is 27.8C, which converts to 82F. If you still want to persist in your folly, I will bet you $1,000,000 that the high for the day at MDT is at least 82F.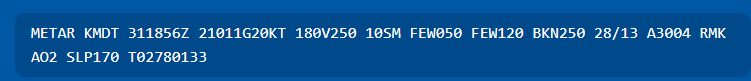
-
Central PA Autumn 2024
TheClimateChanger replied to Itstrainingtime's topic in Upstate New York/Pennsylvania
The 82F is from the 2:56 p.m. METAR report, which isn't rounded. -
Central PA Autumn 2024
TheClimateChanger replied to Itstrainingtime's topic in Upstate New York/Pennsylvania
It's at least hit 82F. That's the actual METAR temp, not a rounded, raw output from the ASOS. -
Fall/Winter '24 Banter and Complaints Go Here
TheClimateChanger replied to IWXwx's topic in Lakes/Ohio Valley
Well, then, you should stay in your own lane. I literally posted actual data proving my statement was not outlandish. In fact, if you review the table, the 12-month running average at Pittsburgh is not only warmer than the late 20th century 30-year mean at Tri-Cities Airport in Tennessee, it's only slightly cooler than the warmest year observed there in those 30 years. For context, the elevations of these sites are approximately: TRI - 1500' ASL PIT - 1200' ASL BNA - 600' ASL SDF - 500' ASL If you want to compare BNA and SDF, then you should use data from the city of Pittsburgh. Unfortunately, it hasn't been collected since 1979. I can tell you it averaged 2.6F warmer than the readings at PIT airport [with every overlapping year falling between 1.1 & 3.8F warmer]. I'll let you do that math there to figure out approximately what the temperatures have been like in the City. -
Yeah, ok. Sure, there was zero snow in Marquette in 1965, and very little in all of the 1960s [even though that was a very cold and snowy decade - as you know, more than most!]. As Joe Biden would say, c'mon man! Those early snow totals in Marquette [which lead to the extreme positive trend] aren't even remotely believable. And it's completely irrelevant. Your winter climate is much more similar to that of Toledo or even Columbus, than Marquette. Get real.
-
E PA/NJ/DE Fall 2024 Obs/Discussion
TheClimateChanger replied to Rtd208's topic in Philadelphia Region
Exercise caution out there tonight, folks. Especially in costumes.
-
E PA/NJ/DE Fall 2024 Obs/Discussion
TheClimateChanger replied to Rtd208's topic in Philadelphia Region
The leaves fall in Nantmeal and suddenly it's warmer than the tarmac at PHL. As JLP would say, ah-mazin'. -
Central PA Autumn 2024
TheClimateChanger replied to Itstrainingtime's topic in Upstate New York/Pennsylvania
Amazing. All we needed is the trees to drop their leaves and Nantmeal would suddenly be warmer than the Philadelphia heat island. It struggles to hit 80F in July in that jungle. -
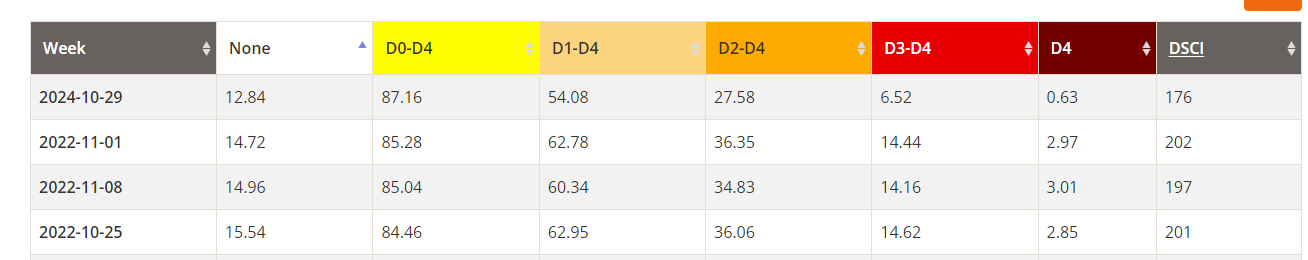
Interesting. I assumed that the fall patterns must have had some similarities, since we also had widespread drought that year. How did such disparate fall patterns each produce a widespread CONUS drought? In fact, if you look at the weekly drought monitor, this week had the least amount of area not in D0-D4 since the map began being published at the beginning of 2000 [25 years]. It narrowly beat out 2022's peak, almost to the exact same day of the year.

-
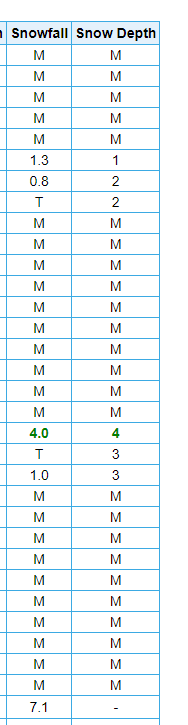
Yeah, it looks like the 3" figure cited above was only from December. Maybe they didn't have an observer the rest of the winter? It looks like snow days have been supplemented though in the official records. This is the January 2002 snowfall from xMacis:
-
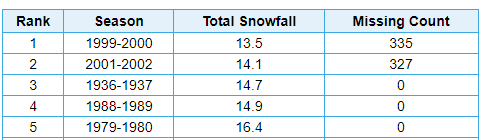
xMacis has 14.1 inches at BDL that winter. There's a lot of missing data, but it looks like it's been supplemented on days when snow fell in 1999-2000 and 2001-2002.
-
I have seen 1999-2000 bandied as a candidate, as well, by some professional meteorologists. The current pattern is somewhat reminiscent to that of 2022, as well. So I wonder if 2022-2023 is a possible analog?
-
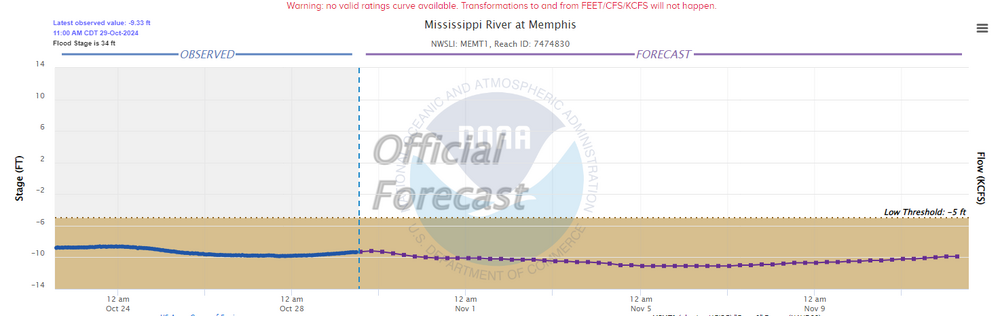
Looks like this will be the high-water mark, or low water mark, if you will, as substantial rainfall is ongoing and expected to continue across much of the center of the CONUS.

-
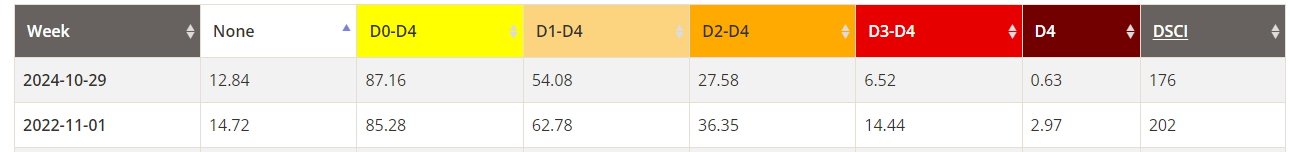
We did it! New record low for CONUS area without D0 or worse on the drought monitor. Just 12.84% were not in D0 or worse in today's update, eclipsing the 14.72% for the week ending November 1, 2022. The 2022 drought was somewhat worse in severity, however.
-
Central PA Autumn 2024
TheClimateChanger replied to Itstrainingtime's topic in Upstate New York/Pennsylvania
Looks like Altoona has tied a daily record, and Bradford set a new daily record, thus far. -
Central PA Autumn 2024
TheClimateChanger replied to Itstrainingtime's topic in Upstate New York/Pennsylvania
The Harrisburg cold island effect in full gear as well. Have to think the winds off the cold river this time of the year play a role.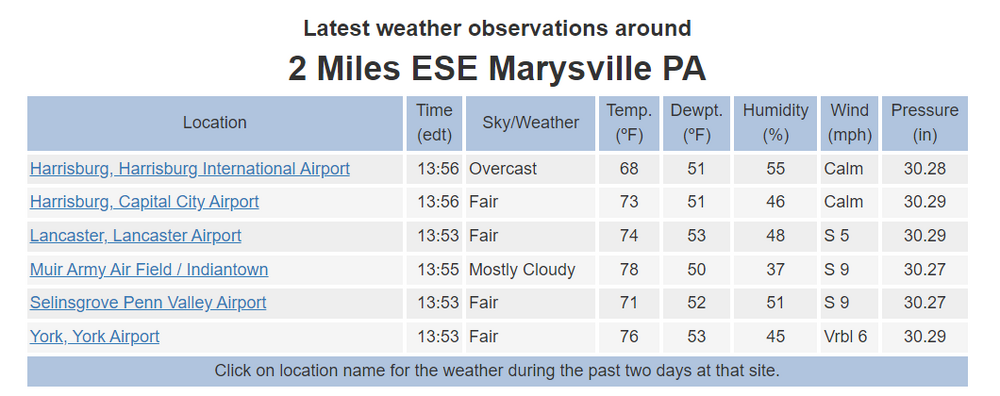
-
Occasional Thoughts on Climate Change
TheClimateChanger replied to donsutherland1's topic in Climate Change
Will it be a record hot AND dry October? -
Pittsburgh, PA Fall 2024 Thread
TheClimateChanger replied to TheClimateChanger's topic in Upstate New York/Pennsylvania
-
Pittsburgh, PA Fall 2024 Thread
TheClimateChanger replied to TheClimateChanger's topic in Upstate New York/Pennsylvania
-
Pittsburgh, PA Fall 2024 Thread
TheClimateChanger replied to TheClimateChanger's topic in Upstate New York/Pennsylvania
-
Occasional Thoughts on Climate Change
TheClimateChanger replied to donsutherland1's topic in Climate Change
Wow, if even Tony Heller is calling this the second or third warmest October nationally, imagine how warm it actually has been with the real figures. -
Yes, I remember it. But the late Joe Bartlo and the daily pest reports ruined it. Started out as a feud with “Jack” and then got crossposted to alt.kooks and other troll groups and really got out of hand. Those Usenet groups were around since at least the early 1990s.
-
Relief may be soon on the way for parts of the region.