TheClimateChanger
-
Posts
2,462 -
Joined
-
Last visited
Content Type
Profiles
Blogs
Forums
American Weather
Media Demo
Store
Gallery
Everything posted by TheClimateChanger
-
Smoky out there tonight.
-
Pittsburgh/Western PA Spring 2023 Discussion
TheClimateChanger replied to Ahoff's topic in Upstate New York/Pennsylvania
Smoky out there tonight. -
Some interesting METARs today with the smoke: Minneapolis-St. Paul Airport reporting overcast skies from smoke [FU] at 15,000 feet. KMSP 171353Z 14011KT 10SM OVC150 13/07 A3002 RMK AO2 SLP165 FU OVC150 T01280072 Des Moines, IA reporting overcast skies from smoke at 20,000 feet. KDSM 171354Z 07007KT 10SM FEW120 OVC200 17/11 A2996 RMK AO2 SLP143 FU OVC200 T01670111 The surface visibility at Grand Forks is down to 6 statute miles with smoke and haze. KGFK 171353Z 18015G22KT 6SM HZ FU FEW070 BKN250 18/08 A2983 RMK AO2 SLP102 T01830083
-
So, GPT confirms there is no historical evidence of smoke from North American wildfires reaching Europe, but there is evidence of smoke from wildfires in recent years doing so. GPT cites 2017 and 2018, but we can see this also occurred in 2020 and 2021. https://abcnews.go.com/US/smoke-west-coast-wildfires-travels-europe/story?id=73071098 https://phys.org/news/2021-06-californian-drifted-europe-heavy-clouding.html https://www.discovermagazine.com/environment/the-view-from-space-as-wildfire-smoke-smothers-large-swaths-of-north-america#:~:text=On July 17%2C 2021%2C smoke from North American,red in this map of the smoke distribution. GPT could find no historical record to suggest this ever occurred in pre-Columbian times, and I'm unaware of any evidence to the contrary. Recent fire and smoke behavior appears to me to be, quite literally, unprecedented. I just don't see how smoke could have ever reached Europe in the quantities observed in 2020 and 2021, because that would have essentially proved the existence of a vast continent to the west, but they had no knowledge of the existence of such a continent.
-
Some context from GPT: Question: What is the history of pre-Columbian wildfires in North America? Response: The history of pre-Columbian wildfires in North America is a topic of ongoing research and study. Prior to European contact and the arrival of Christopher Columbus in the Americas in 1492, indigenous peoples had inhabited the continent for thousands of years. These indigenous communities had a significant influence on the landscape, including the use of fire as a land management tool. Pre-Columbian wildfires, often referred to as anthropogenic or cultural fires, were intentionally set by indigenous peoples for various reasons, including hunting, agriculture, and resource management. These fires played a crucial role in shaping and maintaining ecosystems across North America. Indigenous peoples used fire to modify the landscape to their advantage. They employed controlled burns to clear underbrush, promote the growth of desired plant species, and maintain grasslands for grazing animals. These practices helped prevent larger, catastrophic wildfires by reducing the accumulation of dead vegetation and fuel loads. The effects of pre-Columbian wildfires can still be seen today. Many ecosystems in North America, such as the Great Plains and the Southeastern United States, evolved with fire as a natural part of their ecological processes. Certain plant species, including grasses and fire-tolerant trees, have adapted to and rely on periodic burning for their regeneration and overall health. However, with European colonization and the subsequent displacement and marginalization of indigenous peoples, these traditional land management practices were disrupted or suppressed. As a result, fire regimes in many areas changed, leading to altered ecosystems and increased risks of larger, more destructive wildfires. Today, there is a growing recognition of the importance of integrating indigenous knowledge and land management practices, including controlled burns, into modern conservation efforts. Collaborative initiatives are being developed to restore and maintain fire-adapted ecosystems, promoting ecological health while respecting the cultural heritage and land stewardship practices of indigenous communities. Question: How did the total annual acreage burned before European settlement compare to today? Response: Determining the precise extent of annual acreage burned before European settlement in North America is challenging due to limited historical records and varying ecological conditions. However, researchers have attempted to estimate the differences between pre-Columbian fire regimes and modern wildfire patterns. Several studies suggest that the total annual acreage burned in pre-Columbian times was likely higher compared to today. Indigenous peoples' intentional use of fire for land management purposes, such as clearing vegetation and promoting specific plant species, created a patchwork of burned areas across the landscape. These smaller, controlled burns helped prevent the buildup of excessive fuel loads and resulted in more frequent, low-intensity fires. One notable research paper published in the journal "Fire Ecology" in 2016 estimated that pre-Columbian indigenous burning in what is now the United States may have affected approximately 34.8 million hectares (86 million acres) annually. This estimate exceeds the average annual acreage burned in recent years in the United States, which has ranged from 4 to 10 million hectares (10 to 25 million acres), with significant variability due to factors like weather conditions and land use practices. It's important to note that regional variations existed in pre-Columbian fire regimes. For example, areas with predominantly grasslands or open forests, like the Great Plains and the Southeastern United States, likely experienced more frequent fires compared to densely forested regions. However, it is worth mentioning that comparing pre-Columbian fire regimes to modern wildfire patterns is complex due to changes in land use, fire suppression policies, climate, and other factors since European settlement. Modern land management practices, including fire suppression and landscape fragmentation, have disrupted traditional fire regimes, resulting in altered fuel loads and ecosystem dynamics. While the precise acreage comparisons are challenging, it is generally accepted that pre-Columbian fire regimes played a significant role in shaping North American landscapes, and efforts are underway to integrate indigenous knowledge and practices into contemporary land management strategies to mitigate the risks of larger and more destructive wildfires. Question: Is there any historical evidence for smoke from pre-Columbian wildfires reaching continental Europe? Response: There is no direct historical evidence to suggest that smoke from pre-Columbian wildfires in North America reached continental Europe. The distance between the continents, combined with the dispersion and dilution of smoke particles over such a vast expanse of ocean, makes it highly unlikely for the smoke to have traveled that far and been detectable in Europe. It's important to note that the technology and means of communication during pre-Columbian times were limited compared to today. Historical records from that era are scarce, and there is no documented evidence or accounts of smoke from North American wildfires reaching Europe during that time. Smoke particles from large-scale wildfires can indeed be carried over long distances by atmospheric currents, but the dispersion and dilution processes generally result in significantly reduced smoke concentrations as the distance increases. It is more common for smoke from large wildfires to impact nearby regions or potentially cross smaller bodies of water, but the chances of it reaching across the Atlantic Ocean to Europe are extremely remote. It is worth mentioning that there may have been other natural phenomena or events, such as volcanic eruptions or dust storms, that could have transported particles to Europe from North America, but these would be unrelated to pre-Columbian wildfires. In summary, there is no historical evidence to support the idea that smoke from pre-Columbian wildfires in North America reached continental Europe. Question: Is there evidence for smoke from wildfires in recent years reaching Europe? Response: Yes, there is evidence to suggest that smoke from wildfires in recent years has reached Europe. The transport of smoke particles over long distances is influenced by atmospheric conditions, wind patterns, and the size and intensity of the wildfires. While most of the smoke from wildfires tends to remain localized and affect nearby areas, under certain conditions, it can be carried over vast distances. In recent years, large-scale wildfires, such as those in North America, Siberia, and Australia, have produced significant amounts of smoke that have been transported across continents and even reached Europe. The smoke plumes can be detected through satellite imagery, air quality monitoring stations, and atmospheric modeling. For example, in 2017 and 2018, wildfires in North America, particularly in western Canada and the western United States, produced substantial smoke that traveled across the Atlantic Ocean and affected parts of Europe. Satellite images showed the presence of smoke aerosols over Europe, and air quality monitors detected elevated levels of particulate matter related to the wildfires. Similarly, during the devastating Australian bushfire season in late 2019 and early 2020, smoke plumes were observed to travel across the Pacific Ocean and reach South America and even parts of Africa. These instances demonstrate that, under certain conditions, smoke from large-scale wildfires can indeed be transported over long distances and impact regions far away from the source of the fires. However, it's important to note that the concentration and impact of the smoke diminishes as it travels, and it may become more diluted and less harmful compared to areas closer to the wildfires.
-
Exactly - prairie fires, i.e. grass and brush. I would be interested more in the total weight of biomass burning versus the number of acres. Maybe 10x the number of acres burned, but it couldn’t produce the quantity of smoke that these modern wildfires produce. Otherwise, there would almost certainly be a thick pall of smoke making it all the way across the Atlantic each summer. This would call it into question the significance of dry fogs and red sunsets that are used to detect ancient volcanic eruptions - they would have been an annual occurrence. Moreover, if smoke from the Americas had been present, the Europeans would have known a vast continent must exist to the west but they didn’t, which to me would strongly imply smoke from the Americas never reached Europe in significant quantities.
-
I'd welcome alternative explanations, but I've certainly never seen anything like this in the month of May in my 36 years on earth. July through September, maybe. But May? Look at this, the smoke layer is about to circumnavigate the globe like volcanic aersols. At the same time, there's a smoky front dropping south across the U.S. with some sort of smoke-filled cyclone brewing in western Canada amid massive flare-ups from seemingly dozens of point sources spread across 3 Canadian provinces.
-
Hazy all the way down here in Pennsylvania, as it has been off and on for past week or so. I almost wonder if this will cause a volcanic winter / year without a summer. What is causing all of this wildfire smoke? I've never seen such extensive wildfires in that region in early-mid May. Almost like they are being deliberately set to coincide with peak sun angle / longest days of the year to try and offset/hide the global warming with the looming strong El Nino.
-
Funny, I didn't even see your post before I shared that link. Sounds like Indiana was even colder than the UP in the 1830s and 1840s, if this is true: We also know by looking at Andrew’s data that the average temperature was 10 degrees colder from 1840 to 1873 where the average temperature was 40 degrees. The same period 100 years later 1940 to 1973 had an average temperature of 50 degrees. The other remarkable thing is that comparing Andrews saw much colder temperatures with highs in the 60s and 70s during the summer and in the 30s for lows in August.
-
I was doing some research, and came across this. Very interesting stuff. https://www.wane.com/news/fort-waynes-first-weatherman/
-
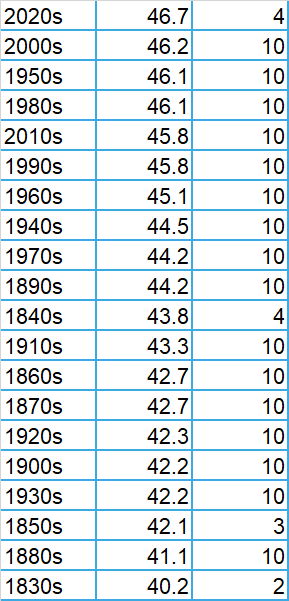
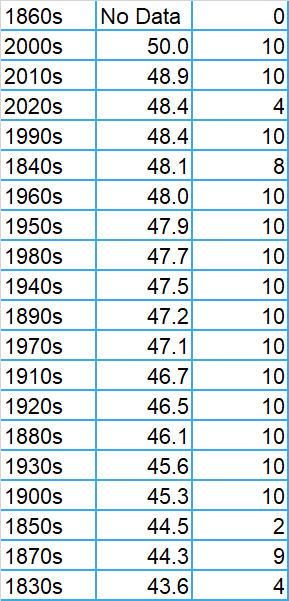
All decadal averages ranked from highest to lowest: Buffalo [Normal: 45.6F] Buffalo Crib Water Temperature Cleveland [Normal: 50.4F] Detroit [Normal: 48.9F]
-
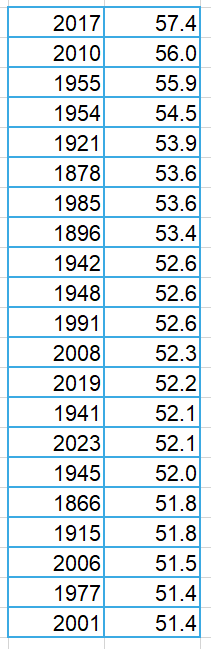
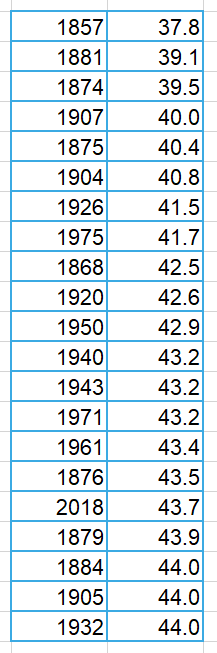
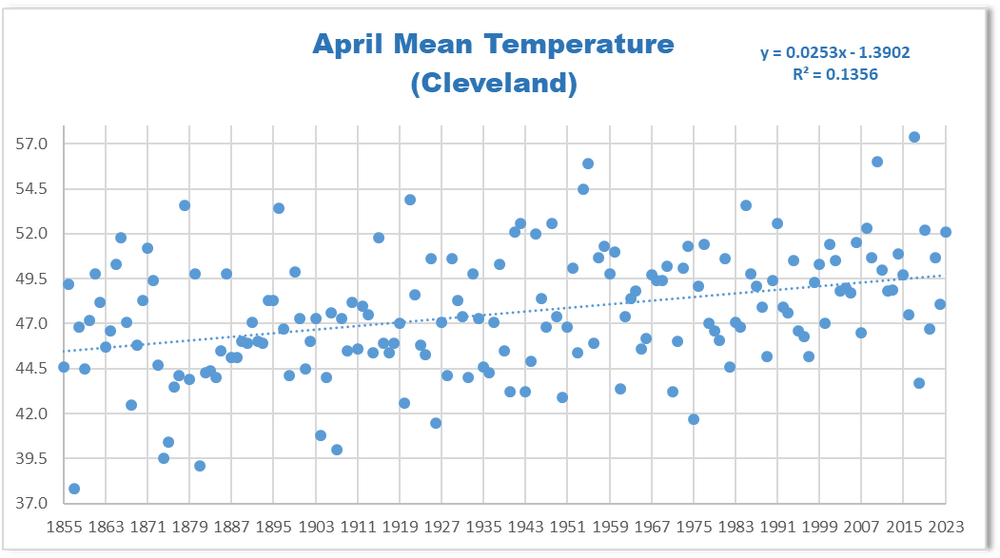
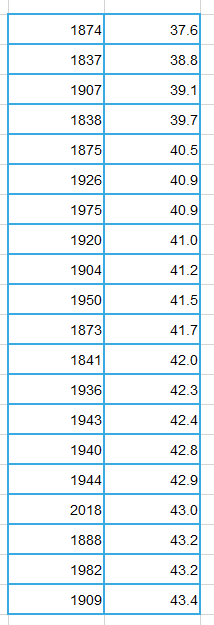
Interesting. Here is what I have for Cleveland, Buffalo and Detroit, with the expanded data sets I have been creating. Cleveland (1855-2023) 1855-1870: Hyde, Smithsonian Institution [7a, 2p, 9p mean] 1871-2023: official thread [downtown until 1940, then at CLE airport] Top Twenty Warmest Top Twenty Coldest Buffalo (1831-1832, 1841-1844, 1854, 1858-present) Early records at Buffalo Barracks - Signal Service (7 a, 2p, 9p mean, and later average of sunrise & 3 pm) 1858-1870: uncertain, presumably Smithsonian Institution - from early Monthly Weather Review, climatology of Buffalo 1871-1873: Weather Bureau, but unofficial [average of 7a, 2p, 9p mean] 1874-present: official threaded record [downtown until around 1940, then at airport] Top 20 Warmest Top 20 Coldest Lake Erie Water Temperature, at Buffalo water intake crib (1927-present) Detroit (1836-1846, 1849-1851, 1871-present) First few years at Fort Dearbornville, then at Detroit Barracks [7 a, 2 p, 9p average, until 1840s, then mean of sunrise and 3 pm] 1871-1873: Weather Bureau, but unofficial [average of 7a, 2p, 9p mean] 1874-present: official threaded record [downtown through 1933, at City Airport until 1966, then Metro Wayne airport] Top 20 Warmest Top 20 Coldest
-
Occasional Thoughts on Climate Change
TheClimateChanger replied to donsutherland1's topic in Climate Change
Climate scientists first laughed at a ‘bizarre’ campaign against the BoM – then came the harassment | Climate science | The Guardian -
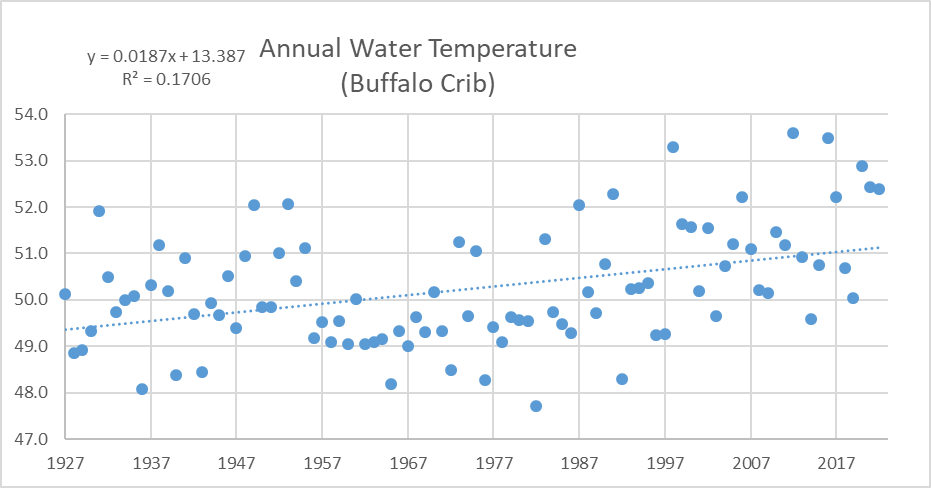
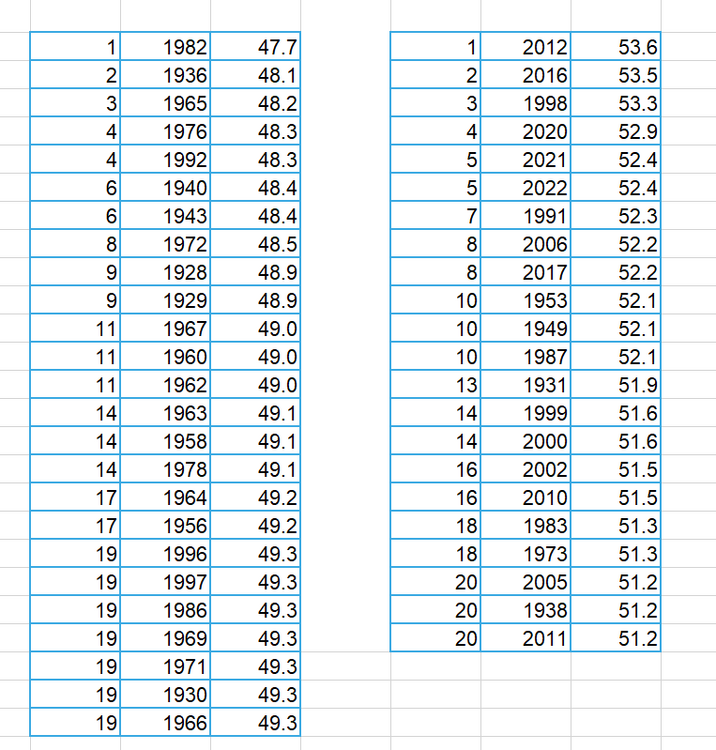
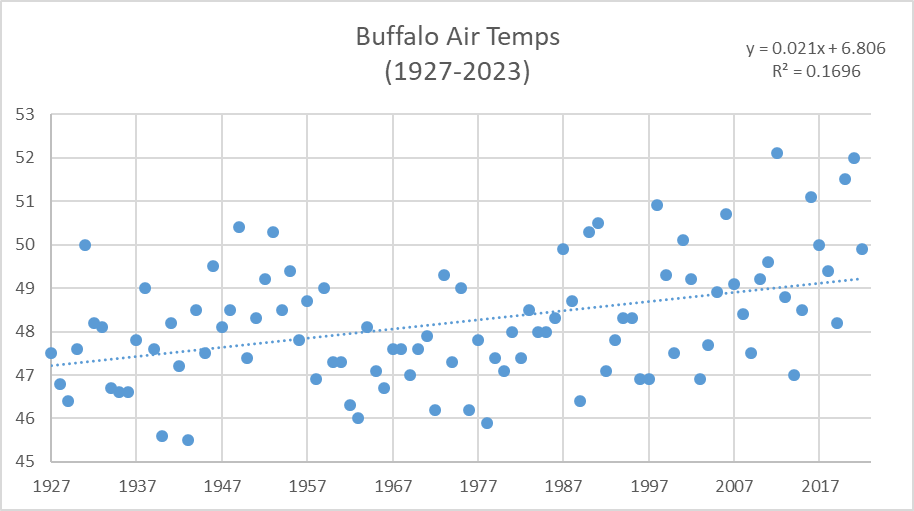
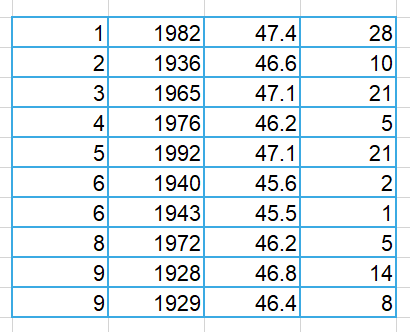
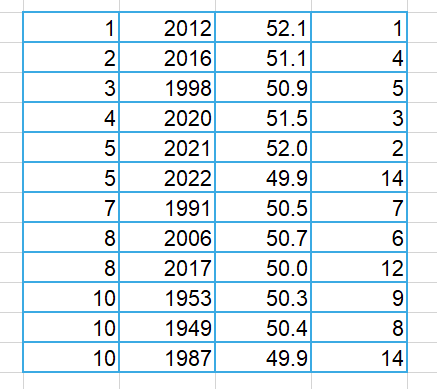
Just to highlight how robust these trends are, here is a comparison to observed surface air temperatures from 1927 to the present. One correction: the air temperature is rising slightly faster than the water temperature [2.1F per century for air, 1.9F per century for the lake temperature]. Top twenty coldest and top twenty warmest years (1927-2022): Looking at the top ten coldest Crib water temperature years, we can see there is a very strong correlation between air temperature and the nearby Lake Erie water temperature. The correlation is slightly less for the coldest years and I think that is because a cold spring and cold summer are more important for determining the water temperature ranking. For air temperature, the opposite is true - winters have more variability and can really build up large temperature deficits. Conversely, for the water temperature reading, it is not physically possible for it fall below 32F. So even the very coldest winters do not see the water temperatures drop below 32F. That's why years with cold summers [e.g., 1982 & 1992] are able to punch above their weight on the water temperature ranking. Even so, six of the ten coldest water temperature years are also among the top ten coldest air temperature years over the same time period. For the warm water years, the correlation is almost 1:1, because those years are mostly open water so these ice dynamics don't come into play. Among the warm water years, 9 of the top 10 [12 years, due to 3-way tie for 10th place] are also in the top ten for air surface temperature. The others are 12th, 14th, and 14th. Coldest Years [air temperature rank in fourth column) Warmest years [air temperature rank in fourth column]
-
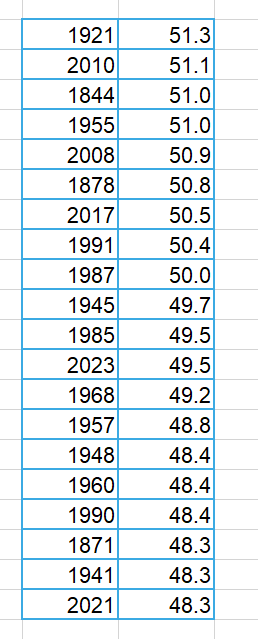
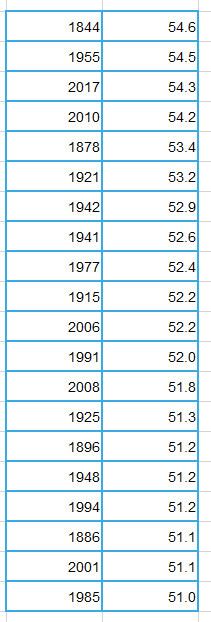
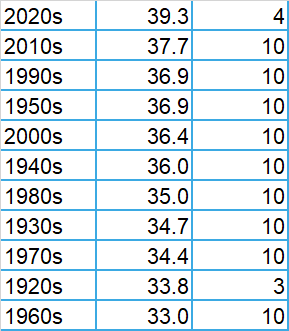
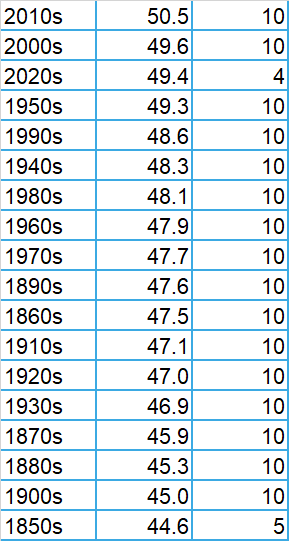
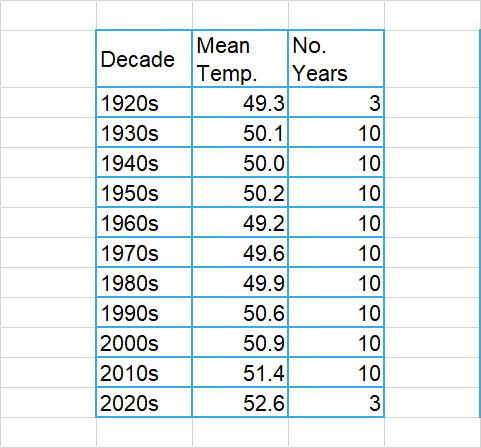
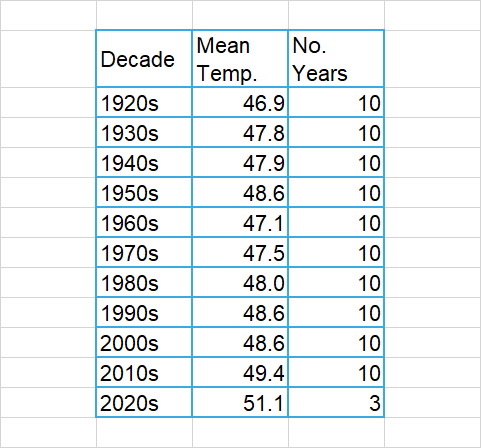
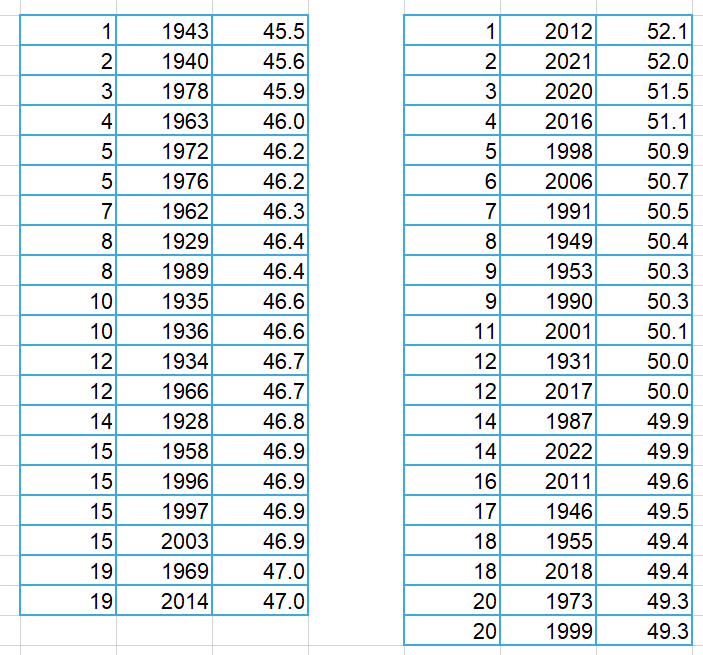
And I have finished my analysis of water temperature readings at the Buffalo water intake crib (30' depth) from 1927 to the present. The water temperature off Buffalo is warming at 1.87F/century, with an r-squared value of 0.1706. The twenty warmest and twenty coldest years (as measured by annual mean water temperature) are as follows: The decadal mean water temperatures: This pattern closely mimics the annual mean air temperature at Buffalo, although water temperatures tend to run about 1.5-2 degrees warmer than the corresponding air temperatures. This is likely because the water temperature cannot drop below 32F, so they tend to run warmer in the winter - especially during cold winters. For comparison, the decadal annual mean surface air temperatures at Buffalo are given below:
-
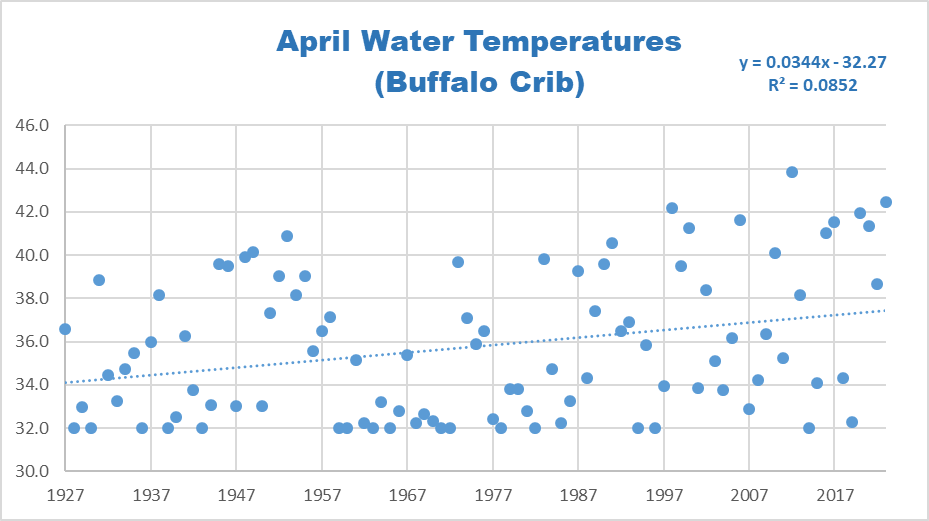
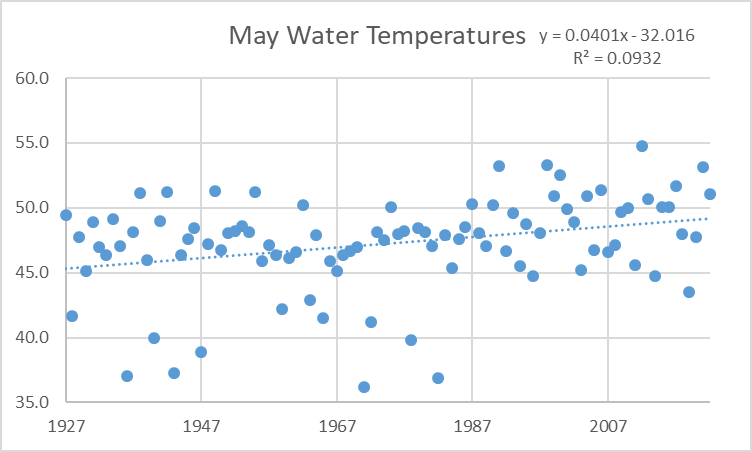
As part of the analysis for Buffalo, I am also examining water temperature data for the Buffalo water intake crib, which dates back to 1927. The lake water temperature at Buffalo is warming somewhat faster than the surface air temperature. The largest changes are in the spring, and associated with earlier loss of ice from the east end of Lake Erie. The mean water temperature in the month of May has warmed about 4 degrees over the last century, per a linear approximation. As you can tell by some of the outliers, there used to be periods where this part of the lake was covered in ice deep into May (such as 1936 & 1971), but that does not happen anymore. The water temperature analysis is not yet complete, but the May scatter plot with linear trend line is shown below.
-
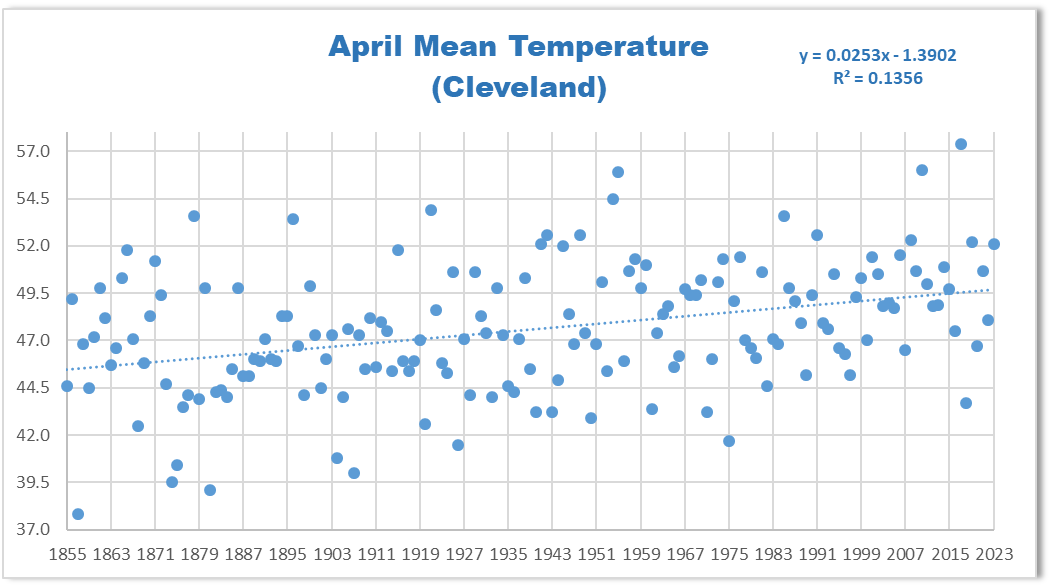
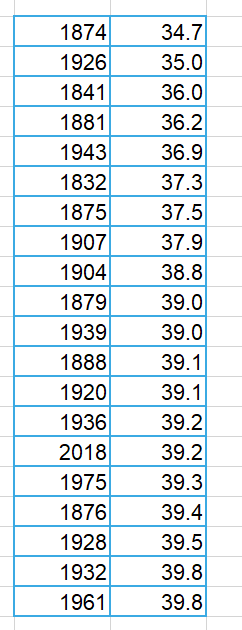
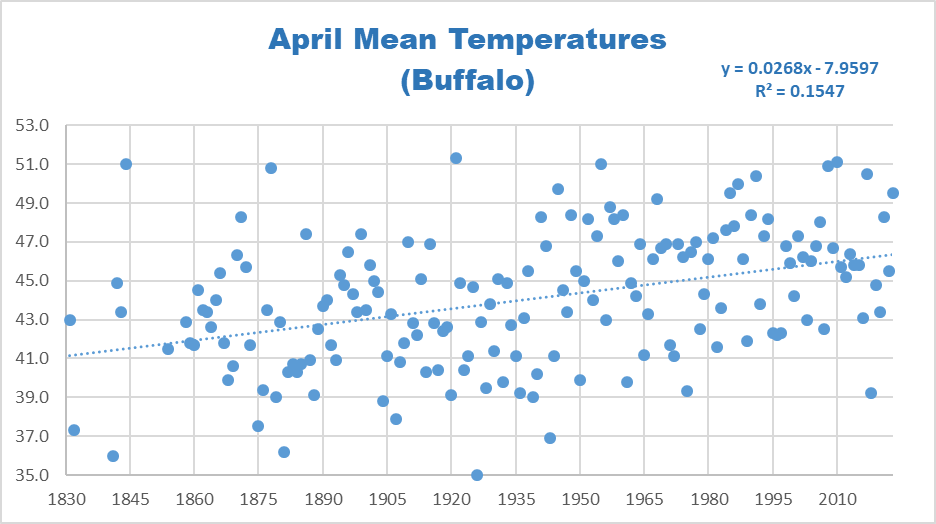
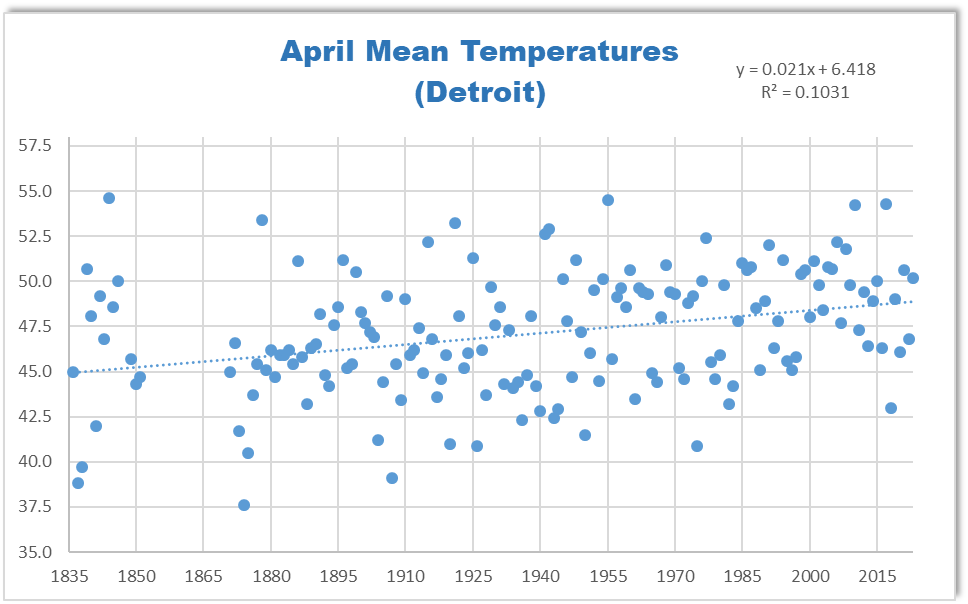
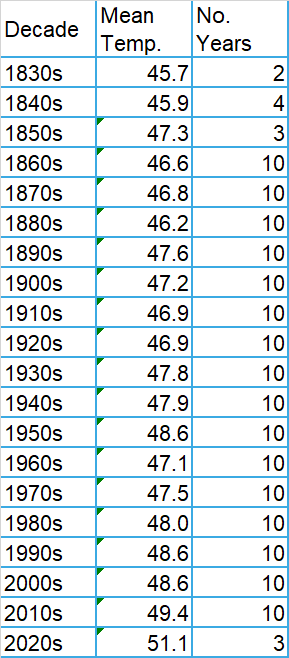
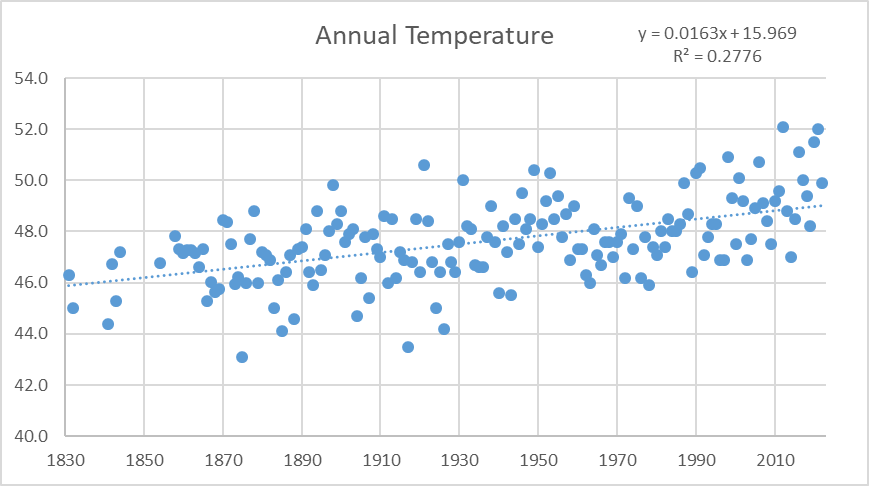
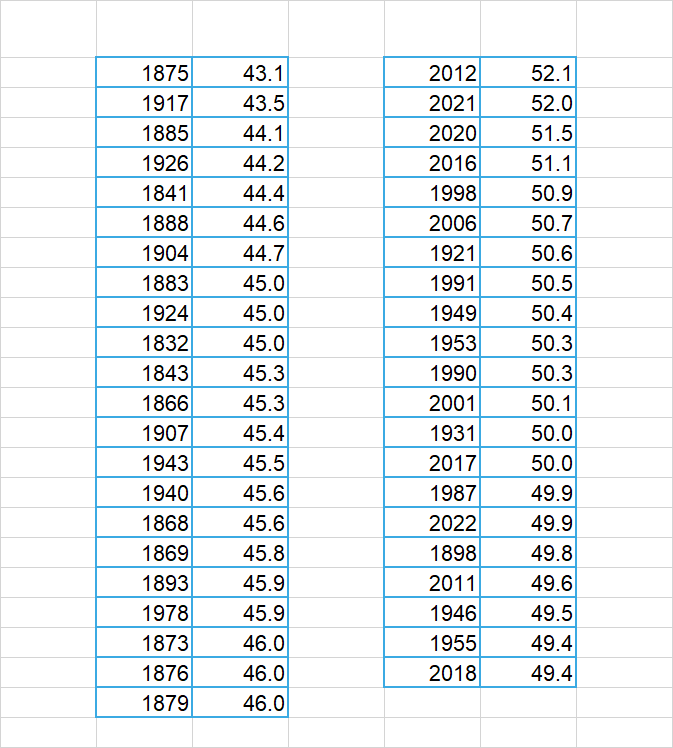
I've finished my analysis of Buffalo air surface temperatures, using all available data. The coldest decade was the 1830s with a mean temperature of 45.7F, albeit with only 2 years of data. The warmest decade is the 2020s with a mean temperature of 51.1F, albeit with only 3 years of data. The coldest decade with full data is the 1880s with a mean temperature of 46.2F. The warmest decade with full data is the 2010s with a mean temperature of 49.4F. A linear approximation for the warming in annual temperature is 1.6F per century over the period from 1830 to the present, with an r-squared value of 0.2776. There are significant seasonal variations in the rate of warming, ranging from no change in January to a rate of 3.0F per century in the month of May. Twenty coldest and twenty warmest years on record:
-
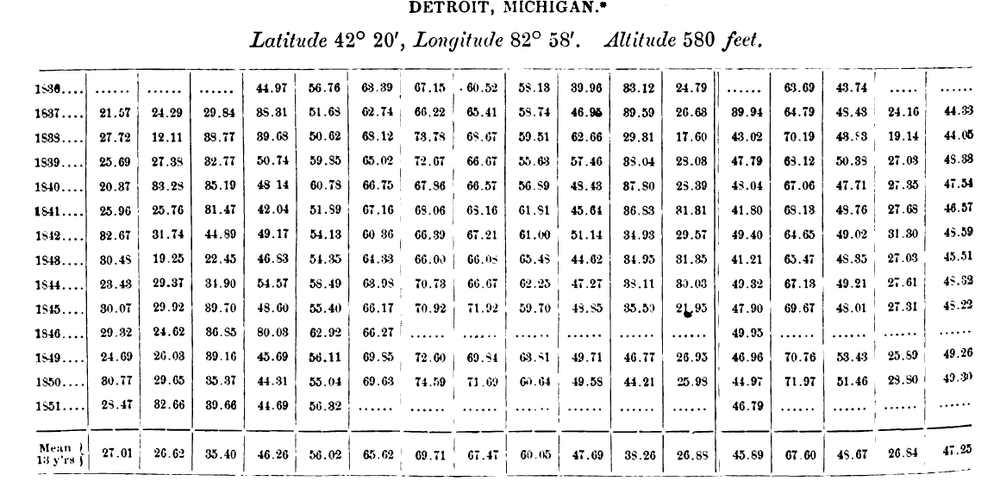
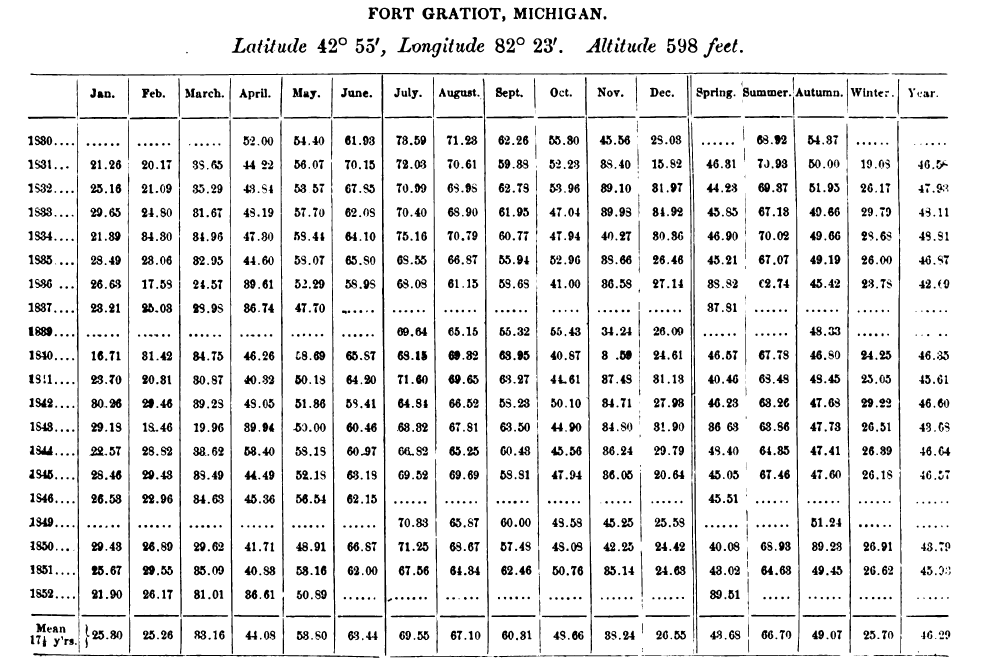
Fascinating stuff. Detroit used to have such a lovely summer climate. While the means aren't quite Yooper-esque, some of the individual months [especially warm-season months] were certainly Yooper-esque, like that 60.5F from August 1836. But it is certainly a northern Michigan climate, comparing very favorably to Traverse City's modern annual mean temperature of 46.9F [mid-19th Century Detroit being about 0.3-0.4F warmer, and Port Huron about 0.6F colder]. That 1836-1838 period was really something else. Just happened to correspond to the beginning of systemized weather records in Detroit too. Allegedly, this was assisted by the 1835 eruption of Cosiguina in Nicaragua, but curiously that eruption wasn't even as impressive as Pinatubo in 1991. Port Huron, Michigan:
-
Still a far cry from the winter of 1837, when the St. Clair River was still closed with ice on June 1, and ice was harvested until the Fourth of July. Thanks to the "Urban Heat Island Effect," conditions like these no longer occur.
-
Occasional Thoughts on Climate Change
TheClimateChanger replied to donsutherland1's topic in Climate Change
-
Occasional Thoughts on Climate Change
TheClimateChanger replied to donsutherland1's topic in Climate Change
It's fascinating to me how close that Smithsonian technique gets to approximating the true mean. I noticed in later years, they doubleweighted the 9 PM reading. So the formula became [7 + 2 + 9 + 9] / 4, where 7, 2 & 9 are the hours of the temperature reading, and that seems to eliminate most of the slight excess. I looked at Buffalo from 2016, and here's the comparison. True mean is 51.1F, average of 7 AM, 2 PM, 9 PM readings is 51.5F, average of 7 AM, 2 PM, and 9 PM with a doubleweighting of the 9 PM reading is 51.2F. Maximum Minimum Mean 7 AM EST 2 PM EST 9 PM EST AVERAGE SPEC. AVG 33.9 19.9 26.9 25 31 27 27.7 27.5 37.7 21.7 29.7 27 34 29 30.0 29.8 48.8 31.0 39.9 35 45 39 39.7 39.5 52.3 33.9 43.1 39 49 43 43.7 43.5 68.8 49.0 58.9 54 66 57 59.0 58.5 77.8 57.4 67.6 64 75 67 68.7 68.3 82.8 65.4 74.1 70 81 73 74.7 74.3 84.6 66.5 75.6 70 83 75 76.0 75.8 76.3 57.6 67.0 61 74 65 66.7 66.3 62.6 46.2 54.4 50 60 53 54.3 54.0 53.1 37.0 45.1 41 51 45 45.7 45.5 36.2 26.1 31.2 30 33 32 31.7 31.8 51.1 51.5 51.2 -
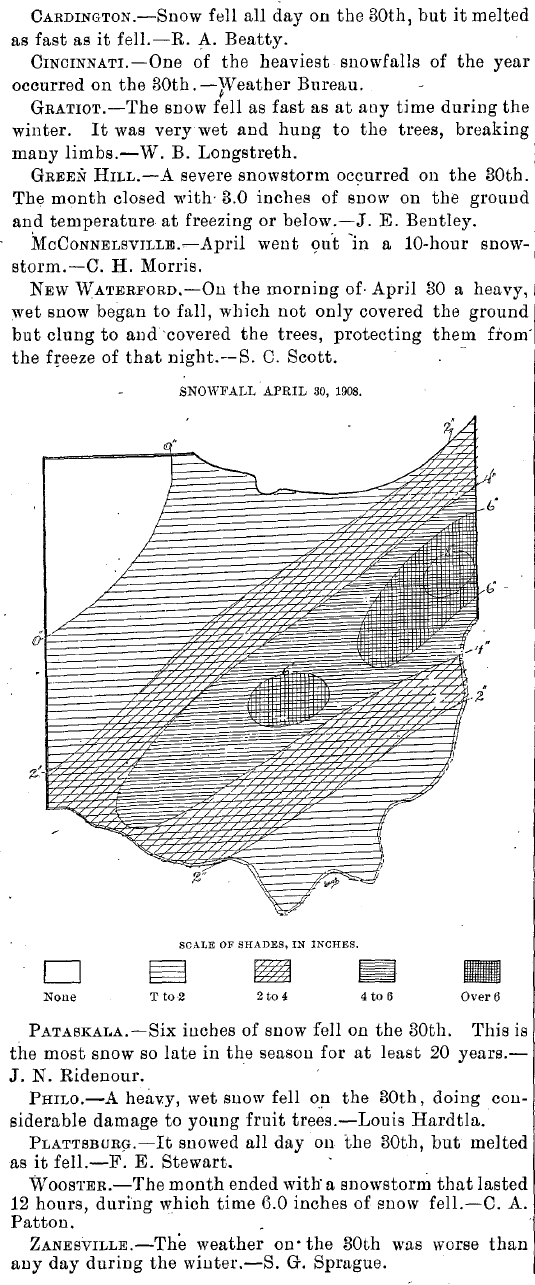
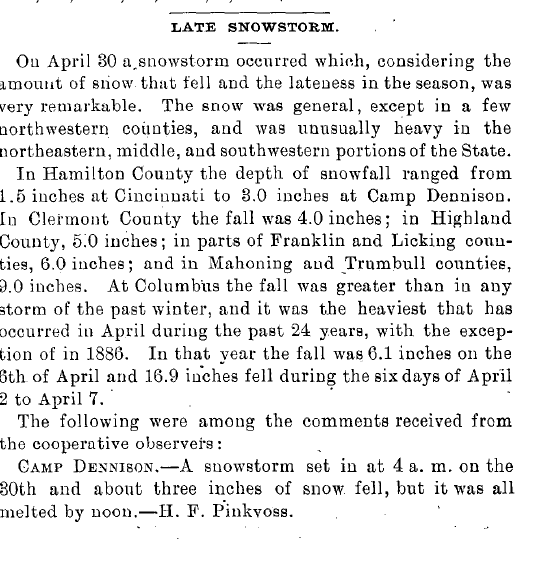
The 115th anniversary is approaching for a little known snowstorm that occurred on April 30, 1908. Most of the state saw accumulating snow, with about 6" near Columbus and 9" near Youngstown. From the April 1908 Ohio Monthly Weather Review:

-
Occasional Thoughts on Climate Change
TheClimateChanger replied to donsutherland1's topic in Climate Change
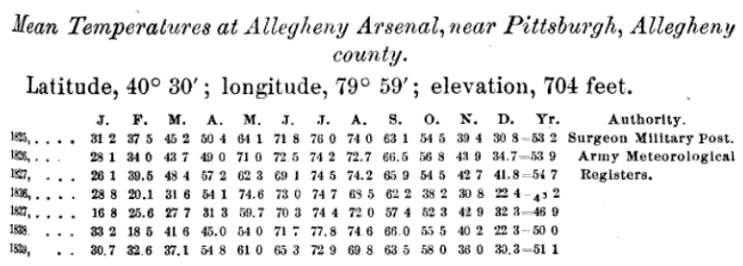
I just don't know how anyone can doubt climate change. Look at the period from October 1836 to April 1837 in the Allegheny Arsenal [Lawrenceville, Pittsburgh] records. And the means of 48.2F and 46.9F aren't far from the coldest in the modern record [48.0F, in 1976]. But these are from a site 500' lower in elevation than the PIT Airport. But look at what a cooler climate, plus a major volcanic eruption in Nicaragua, was capable of doing. I feel like people don't realize how cold it used to be, and how in the natural climate state, we would probably be just several big volcanic eruptions in rapid succession from a new glacial advance. October 1836: 38.2F [The coldest in the modern record is 45.9F, or 7.7F warmer than this reading!] November 1836: 30.8F [The coldest in the modern record is 33.1F, or 2.3F warmer than this reading!] December 1836: 22.4F [Would tie 1963 for 2nd coldest in the modern record] January 1837: 16.8F [Would be the 2nd coldest in the modern record] February 1837: 25.6F [Would tie 20th coldest in the modern record] March 1837: 27.7F [Would be 2nd coldest in the modern record -- current 2nd place at 31.0F] April 1837: 31.3F [The coldest in the modern record is 43.8F, or 12.5F warmer than this reading!] Can anyone alive today even imagine an April with a subfreezing mean temperature at the latitude of Pittsburgh today? Unfathomable.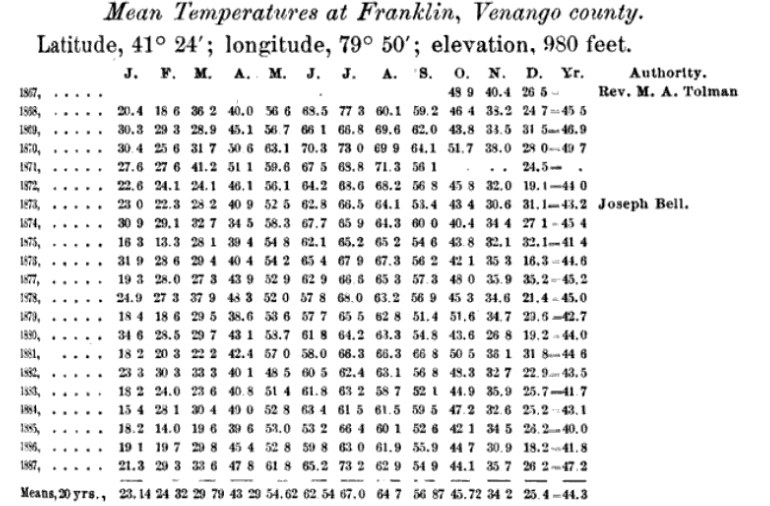
-
Pittsburgh/Western PA Spring 2023 Discussion
TheClimateChanger replied to Ahoff's topic in Upstate New York/Pennsylvania
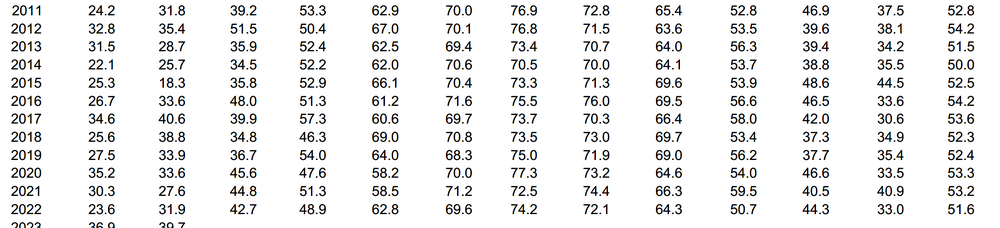
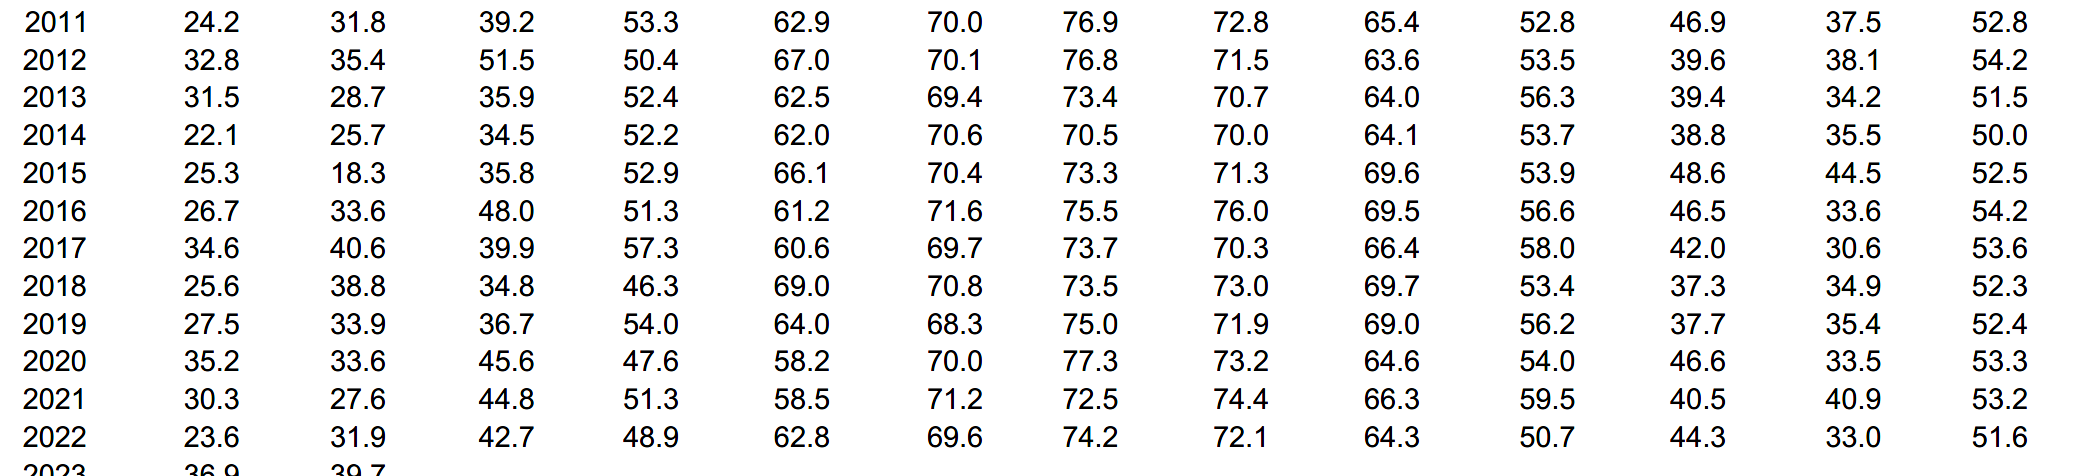
So, I was sharing some information about Pennsylvania climate from the 19th century. Thought I should share this information here too. These Allegheny Arsenal (Lawrenceville, Pittsburgh, PA) records are just absolutely lit. You can probably ignore the data from 1825-1827, which is oddly much warmer than the rest of the records. The period from October 1836 through April 1837 is absolutely insane. And these are from 704', adjacent to the Allegheny River (or about 500' below PIT airport). The overall means [around 51F] aren't too far from the 1991-2010 mean for PIT airport [51.8F], but again these are 500' lower in elevation and somewhat to the south within the boundaries of the present-day city of Pittsburgh [Lawrenceville was a separate borough at the time]. The elevation difference would account for about 1.5F of warming relative to the airport, even ignoring the change of latitude. The mean at PIT airport probably would have been about 49-49.5F at this time. But even this seemingly minor cooling would rewrite the record books - 48.2F in 1836, 46.9F in 1837, 49.1F in 1840, 48.9F in 1842, 47.8F in 1856 would all be among the five coldest in the modern records. For the record, these were calculated by three daily readings - 7 am, 2 pm, and 9 pm. Probably local solar time, as I believe this predates even standard time zones [and far predates daylight saving time]. I was curious how these would compare to modern means computed from max & min, and I looked at the data for 2011 using the hourly averages reported in each monthly LCD for 7 am, 2 pm, and 9 pm (standard time) and determined the difference is negligible [in that year, this method would have produced a warming bias of 0.3F for the yearly mean]. Obviously, you'd want to take a look at more data to confirm, but it looks like a small bias - and a positive one at that. So these readings are not being artificially cooled by the methodology. The biggest warm bias is in the early summer, because the 7 am standard [8 am EDT] / 7 am local solar time reading would be a couple hours after sunrise and miss the actual low. Anyways, the 1836-1837 is absolutely insane. This is what has been stolen from us snow lovers. People don't realize how cold it was, and how big of a difference just a couple degrees can really make. I mean we were probably perilously close to tipping into an ice age with these conditions. October 1836: 38.2F [The coldest in the modern record is 45.9F, or 7.7F warmer than this reading!] November 1836: 30.8F [The coldest in the modern record is 33.1F, or 2.3F warmer than this reading!] December 1836: 22.4F [Would tie 1963 for 2nd coldest in the modern record] January 1837: 16.8F [Would be the 2nd coldest in the modern record] February 1837: 25.6F [Would tie 20th coldest in the modern record] March 1837: 27.7F [Would be 2nd coldest in the modern record -- current 2nd place at 31.0F] April 1837: 31.3F [The coldest in the modern record is 43.8F, or 12.5F warmer than this reading!] The April 1837 reading probably appears impossible at first glance, but given the temperatures of the preceding six months, there must have been a massive snow cover in place at the end of March 1837 that gradually melted off throughout April offsetting the extreme sun angle. There's a lot of support for this extreme cold. Cosiguina erupted in 1835, dropping global temperatures by .75C. June 28, 1836 is the only time snow occurred in Sydney, AU when one inch fell. People have no idea how cold it used to be, or how cold the natural climate should be. We should be teetering on the edge of a new ice with a series of major volcanic eruptions. Next time someone complains about how cold it is in spring, just remember it used to be possible to have subfreezing temperatures in April at the latitude of Pittsburgh less than 200 years ago.
-
Occasional Thoughts on Climate Change
TheClimateChanger replied to donsutherland1's topic in Climate Change
Just for the record, for the year of 2011, the Smithsonian mean for PIT would have been 53.1F, or just 0.3F warmer than the true mean. Like I said, this was an incredible approximation in the absence of a max/min thermometer.