TheClimateChanger
-
Posts
2,462 -
Joined
-
Last visited
Content Type
Profiles
Blogs
Forums
American Weather
Media Demo
Store
Gallery
Everything posted by TheClimateChanger
-
Pittsburgh/Western PA Summer 2023
TheClimateChanger replied to Ahoff's topic in Upstate New York/Pennsylvania
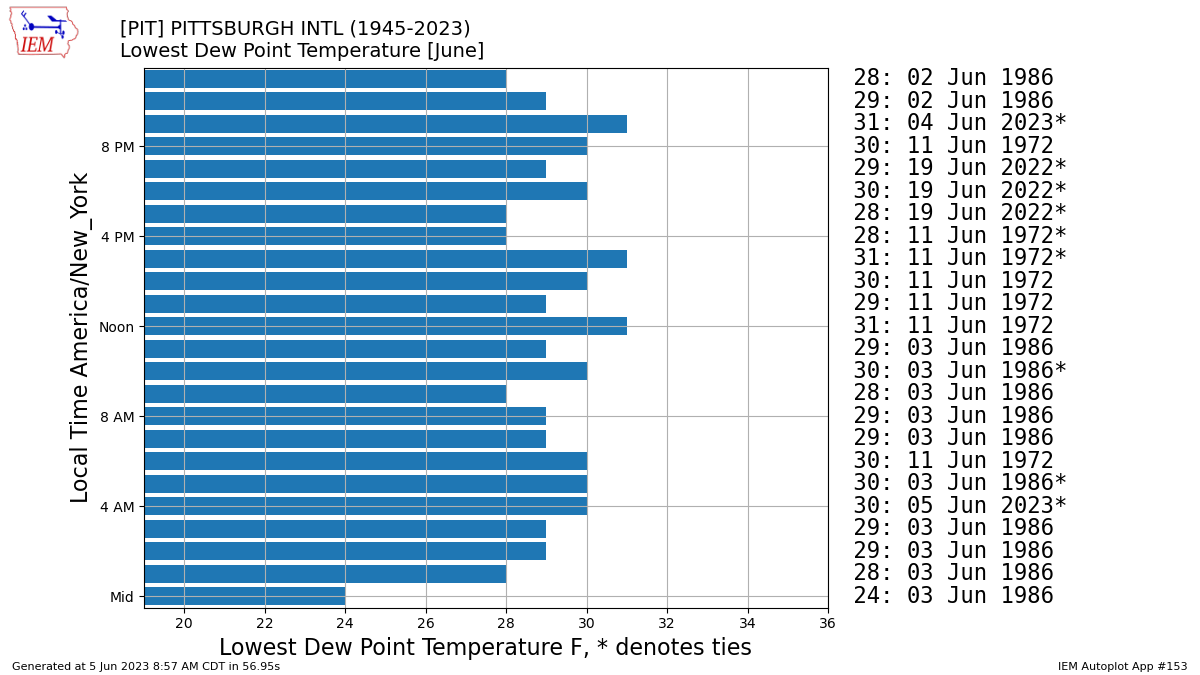
The dewpoints of 30F at 4 am and 31F at 10 PM appear to have tied the lowest values on record for those hours at Pittsburgh International. Models suggest plenty of dewpoints in the 30s, and possibly 20s later in the week, so we could approach the record lowest dewpoint of 24F set at midnight on June 3, 1986. With the exception of a few hourly records tied last year, all other record low dewpoints were set on June 2-3, 1986, and June 11, 1972. Like this year, both 1986 and 1972 featured developing El Ninos, and both went on to be rather significant events (peak ONI of 2.1 during the 1972-1973 El Nino, and a peak ONI of 1.7 during the 1986-1988 El Nino). This suggests there may be a link between El Nino events and dryness in early June around this region. 1972 did turn much wetter, with the remnants of Hurricane Agnes producing record flooding in Pennsylvania. That appears to be a bit of an outlier though, especially since El Ninos tend to reduce tropical activity in the Atlantic basin due to increased wind shear, so I certainly wouldn't bank on a repeat of that. While the low was 51 at PIT this morning, outlying areas were considerably colder. Some morning lows around the region include 39F at Zelienople, 40F at Youngstown, 41F at Franklin, 41F at Butler, 42F at New Castle, 43F at Latrobe, 44F at Washington, and 45F at Indiana and DuBois.
-
Occasional Thoughts on Climate Change
TheClimateChanger replied to donsutherland1's topic in Climate Change
Looks like June will be another record breaker: -
Pittsburgh/Western PA Spring 2023 Discussion
TheClimateChanger replied to Ahoff's topic in Upstate New York/Pennsylvania
Death band right over head tomorrow afternoon. Where was this setup in the winter?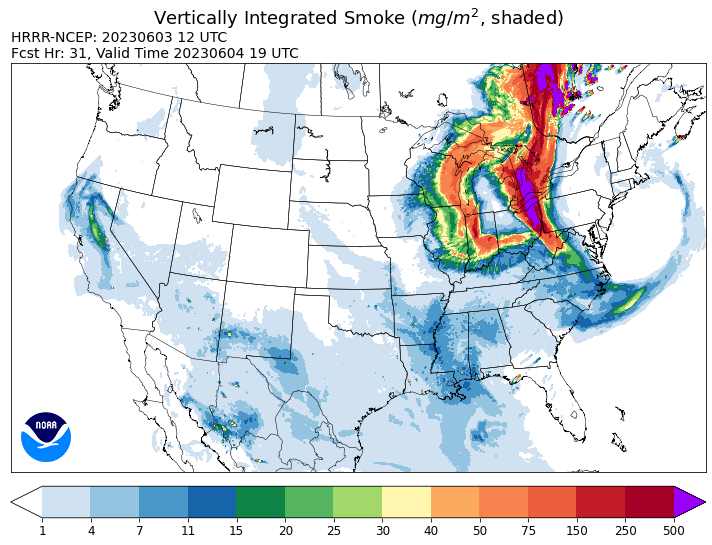
-
Central PA Spring 2023
TheClimateChanger replied to Itstrainingtime's topic in Upstate New York/Pennsylvania
Look at the state of the air in eastern Ontario. This may rival Black Sunday and the Great Smoke Pall of September 1950. -
Does anyone know what’s causing all of the wildfires in Canada? The last few days have been particularly striking across Quebec and eastern Ontario, with dozens of large fires seemingly flaring up out of the blue. I don’t think there was any indication of such intense wildfire activity this summer. Most of Canada was not in drought, but the boreal forests seem to be spontaneously combusting?
-
Occasional Thoughts on Climate Change
TheClimateChanger replied to donsutherland1's topic in Climate Change
-
Looks like an intense plume of smoke on tap for Ohio tomorrow evening, with total atmospheric columnar concentrations of smoke exceeding 500 mg per square meter. Will get dark very early tomorrow.
-
Pittsburgh/Western PA Spring 2023 Discussion
TheClimateChanger replied to Ahoff's topic in Upstate New York/Pennsylvania
Looks like a very thick pall of smoke will be pushing into our area tomorrow evening. I don’t think I’ve ever seen such a thick pall of smoke in this area. It’s low too - mostly around 6,000 feet AGL, so it’s not going to be 20k feet plus like the May events. -
Pittsburgh/Western PA Spring 2023 Discussion
TheClimateChanger replied to Ahoff's topic in Upstate New York/Pennsylvania
Euro wants to tank our dewpoint down into the 20s on Monday, and then keep it the 30s all week. At 18z Monday, the 12z run of the Euro had a 24 degree dewpoint, while the 18z GFS shows 32 degrees at the same time. This is like summer of yesteryear stuff right here. -
Central PA Spring 2023
TheClimateChanger replied to Itstrainingtime's topic in Upstate New York/Pennsylvania
I hope these dewpoint forecasts from the Euro pan out. It's looking like this may be our summer of yesteryear. -
The RAP-Smoke has a similar look tomorrow afternoon. In general, it looks like a very smoky regime setting up later this weekend and into next week for the Great Lakes.
-
Looks like a thick plume of smoke at the surface is going to advect into northern Michigan tomorrow from uncontrolled wildfires in Ontario and Quebec, but I can't find any mention of it in the forecast. If this is correct, expect a lot of haze, a smoky scent, and poor air quality.
-
Pittsburgh/Western PA Spring 2023 Discussion
TheClimateChanger replied to Ahoff's topic in Upstate New York/Pennsylvania
Looks like we may get into a smokier regime next week as northwest flow filters in filthy air from fires all across Canada. -
Pittsburgh/Western PA Spring 2023 Discussion
TheClimateChanger replied to Ahoff's topic in Upstate New York/Pennsylvania
Looks like the DUJ stopped reporting at 10:53 AM, with a temperature of 84F. So maybe the daily record and earliest 90F reading are safe there after all. -
Pittsburgh/Western PA Spring 2023 Discussion
TheClimateChanger replied to Ahoff's topic in Upstate New York/Pennsylvania
10 am update: 73 at PIT, but 79 at YNG, 80 at DUJ and 79 at BFD. The latter sites are 1800' and 2100' respectively. -
Pittsburgh/Western PA Spring 2023 Discussion
TheClimateChanger replied to Ahoff's topic in Upstate New York/Pennsylvania
What I don't understand is this new pattern where places further north are hotter than Pittsburgh? These places used to be much colder than Pittsburgh year round, and that no longer appears to be the case in the summertime. DuBois reached 88F yesterday, breaking the record of 86F set in 1969. It looks like a near certainty to reach 90F+ today. The earliest 90F reading in DuBois was on June 8, 1968. Similarly, Bradford reached 86F yesterday, tying the record set just last year. Probably won't hit 90F but could come close. The earliest 90F reading at Bradford occurred just last year on June 16th. There were two 90+ readings at BFD last year (including an incredible 93F on June 22, which is one of the hotter readings ever to occur at the site). Prior to last year, it had never reached 90F+ at BFD before the month of July (dating back to 1957). -
Central PA Spring 2023
TheClimateChanger replied to Itstrainingtime's topic in Upstate New York/Pennsylvania
If either site reaches 90F, it will be the earliest 90F+ reading on record. The earliest 90F+ reading at DuBois was on June 8, 1968. The earliest 90F+ reading at Bradford occurred on June 16, 2022. In fact, Bradford has only recorded 2 90+ readings prior to the month of July since records began in 1957 - June 16, 2022 & June 22, 2022 (the latter date, an incredible 93F). -
Central PA Spring 2023
TheClimateChanger replied to Itstrainingtime's topic in Upstate New York/Pennsylvania
Shorter periods of record, but Bradford tied a record high of 86F yesterday (set one year ago) and DuBois set a new record high of 88F, breaking the record of 86F set in 1969. Records at Bradford date to 1957, and at DuBois date to 1963. Both sites should obliterate records today. -
Pittsburgh/Western PA Spring 2023 Discussion
TheClimateChanger replied to Ahoff's topic in Upstate New York/Pennsylvania
Not off to a good start. Only 68 at Pittsburgh as of 9 am, but Youngstown is 75, DuBois is 74, and even Bradford is 72. Looks like the northern parts of the CWA should easily crest 90, but not sure about PIT & south. -
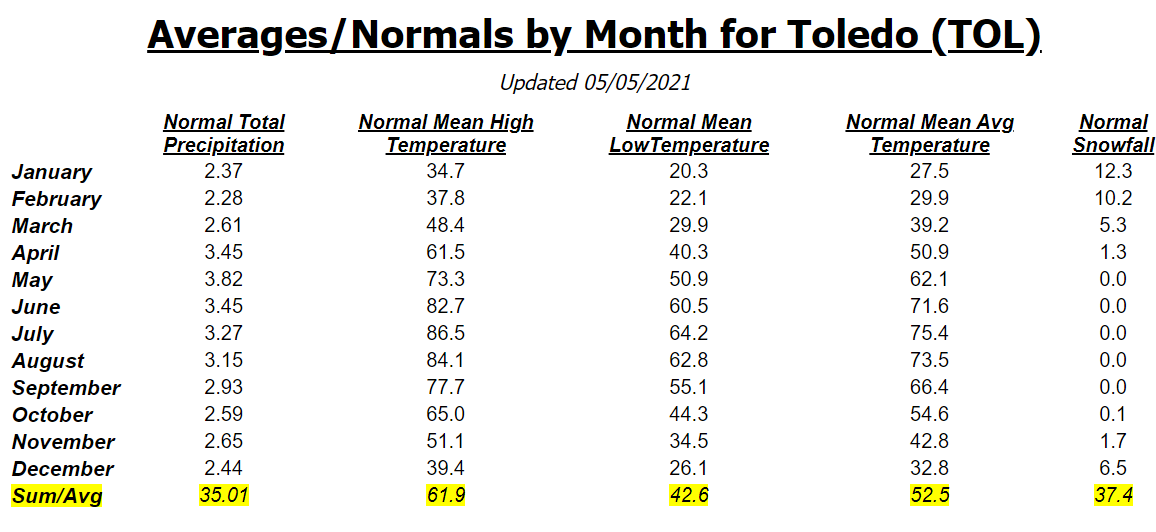
With the current means at TOL, only three years from the base period would have been warmer than average (1998, 2012, and 2020). The other 27 years were less than the current normal. Yet so far, since they've been in effect, two consecutive years have come in even higher than these inflated numbers. And, again, sorry to highjack the discussion, but as you noted it was a new thought that popped up as you were looking into the summer of 1988. With that said, you are the first person I've seen question these numbers and express confusion... I noticed this a while back, and it had me scratching my head. Like I said, it has to be some sort of "trend" factor - maybe calling it a global warming factor is loaded terminology. But it would only make sense to use a trend correction if you were pretty confident whatever trend you are factoring in is going to continue. If there was instead a cyclical pattern, and it cycled into a cooling trend, then this would produce normals way above the current temperatures.
-
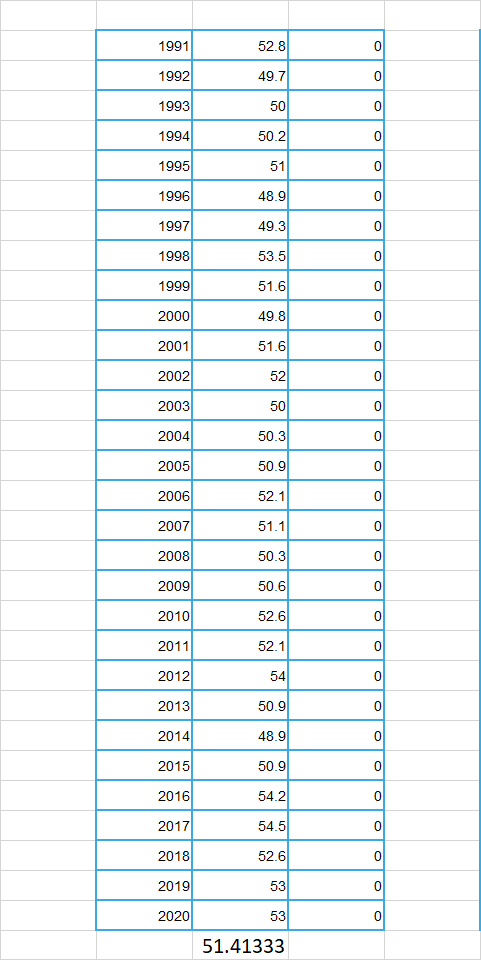
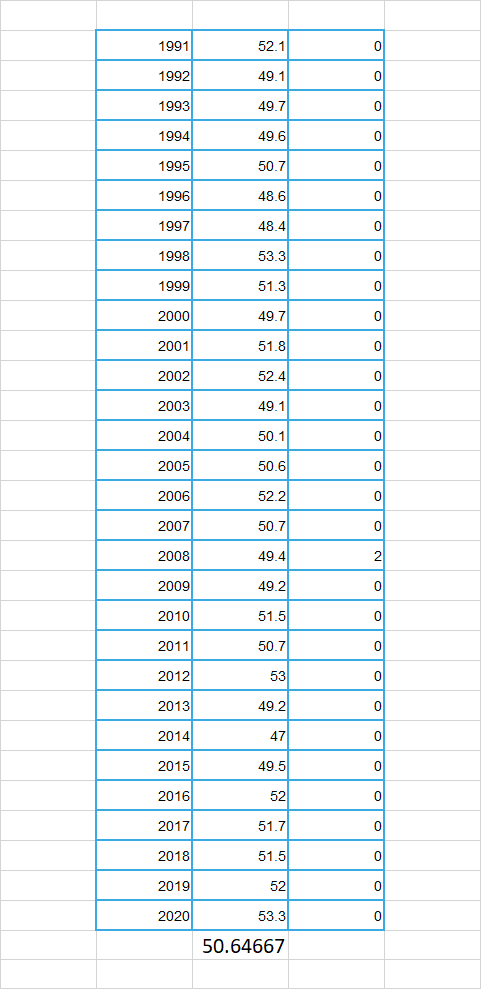
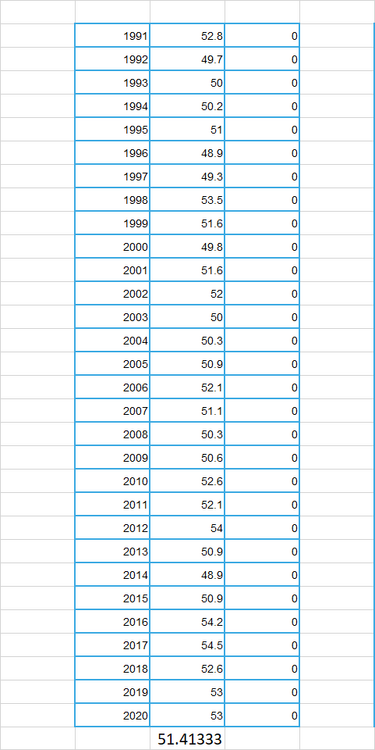
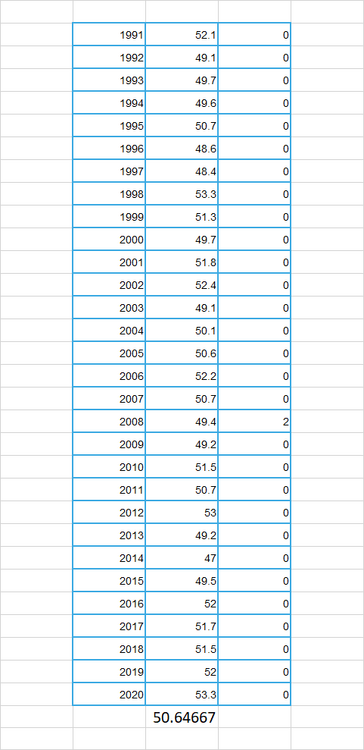
Just to prove I'm not making this up. Here are the annual mean temperatures at CLE from 1991-2020, with the calculated mean (51.4F) at the bottom. And here is the 1991-2020 "normal" mean for CLE (52.4F): Here are the annual mean temperatures at TOL from 1991-2020, with the calculated mean (50.6F) at the bottom. And here is the 1991-2020 "normal" mean for TOL (52.5F):


-
The warming factor has been successful so far. At Toledo, the mean for 2021 was 54.0F and for 2022 was 52.7F. These are 1.5F and 0.2F above the current normal; however, they would have been a whopping 3.4F and 2.1F above the 1991-2020 averages. At Cleveland, the mean for 2021 was 53.3F and for 2022 was 52.2F. These are 0.9F above and 0.2F below the current normal; however, they would have been 1.9F and 0.8F above the 1991-2020 averages. What's interesting is CLE averaged 0.8F warmer than TOL from 1991-2020, yet the normal mean at TOL was set 0.1F warmer than CLE. This has also turned out to be correct, as TOL has averaged 0.7F and 0.5F warmer than CLE in the first two years of this decade. Apparently, TOL is warming more rapidly than CLE.
-
Not to highjack your thread, but you can see this effect in the current normals for Cleveland and Toledo. At Cleveland, the 1991-2020 average (arithmetic mean) annual mean temperature is 51.4F, yet the normal is 52.4F - a full degree higher. At Toledo, the 1991-2020 average (arithmetic mean) annual mean temperature is 50.6F, yet the normal is 52.5F - nearly two degrees higher! You would think with normals that are 1-2 degrees warmer than the mean temperature for the base period, you would see a heavy slant towards below normal temperatures. And that would certainly be the case in a static climate. However, in reality, whatever the NWS has done was good, as most months are still coming in above even the heavily inflated normals. I suspect this is some sort of "beta testing" of a new method of calculating normals that factors in the rapid global warming trend. In recent decades, the use of arithmetic means has led to a substantial bias towards warmer than normal temperatures since the climate is warming and not static. Therefore, the use of a past base period results in temperatures and conditions that are necessarily from a cooler climate and not representative of the current conditions at the site. This warming factor in the TOL and CLE means seems to have been introduced to take account of the trends at each station. I have not noticed this effect anywhere outside of the NWS CLE area. The first-order sites in surrounding locations still seem to have normal temperatures that are approximately equal to the arithmetic mean of the base period. This is what led me to believe this is some sort of beta test. This just highlights the importance of language - often times, people refer to the normal temperatures as the "1991-2020 averages" which has never been strictly true since the figures are normalized. But with the most recent normals, this is completely wrong.
-
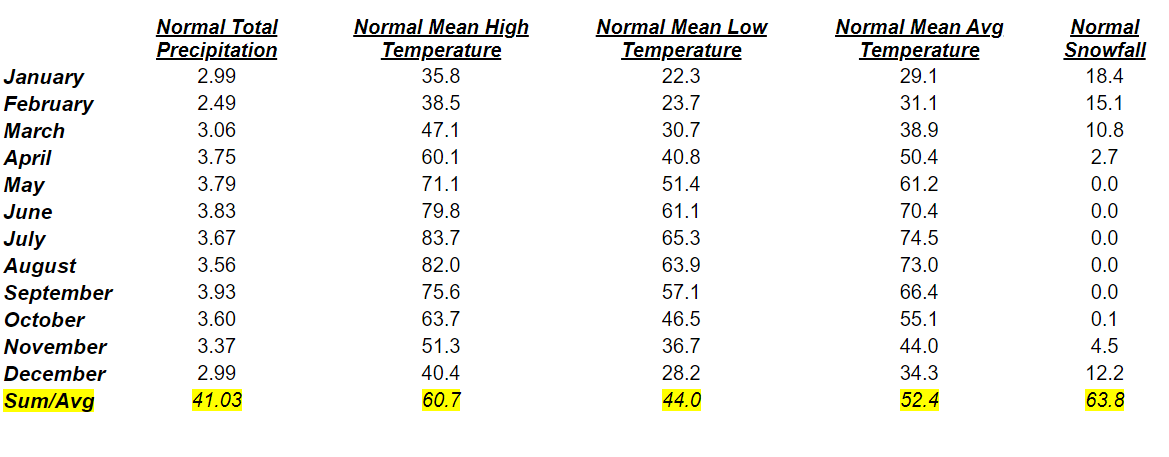
Yes, the 1991-2020 average for Toledo is 73.8F. But the NWS must be beta-testing some sort of new method for calculating the normals in the NWS CLE area because a lot of the normals are substantially higher than the arithmetic mean. I don't know if they included some sort of global warming factor or something? There was no explanation for the changes. Anyways, despite the 1991-2020 average being 73.8F, the current normal for Toledo in July is 75.4F.
-
Central PA Spring 2023
TheClimateChanger replied to Itstrainingtime's topic in Upstate New York/Pennsylvania
Capital City Airport achieved the rare feat of a low in the 40s & high in the 90s on the same day.