TheClimateChanger
-
Posts
2,457 -
Joined
-
Last visited
Content Type
Profiles
Blogs
Forums
American Weather
Media Demo
Store
Gallery
Everything posted by TheClimateChanger
-
Pittsburgh, Pa Summer 2024 Thread.
TheClimateChanger replied to meatwad's topic in Upstate New York/Pennsylvania
I think I may be the only one still keeping track, but yesterday was indeed the 18th 90+ reading of the year. First to top off at exactly 90F. Has reached 89F so far today, which typically would probably guarantee a 90F or better high temperature, but clouds are quickly on the increase with showers and thunderstorms to the north. Clearly, I was wrong when I indicated last week might be the last chance for awhile. But, at this point, the only day with any chance of 90F for the foreseeable future [after today] is Thursday. At this point, mid to upper 80s looks like the better bet. Debby's remnants move north into Pennsylvania on Friday, cooling things off, and helping to pull down a cooler and drier airmass in its wake. -
Pittsburgh, Pa Summer 2024 Thread.
TheClimateChanger replied to meatwad's topic in Upstate New York/Pennsylvania
Interesting. Hopefully, the NAM is off its rocker. Could definitely do without over 4" of rain in 12 hours from the remnants of Debby. -
Central Pa. Summer 2024
TheClimateChanger replied to mahantango#1's topic in Upstate New York/Pennsylvania
Clearfield Lawrence AP (1516' elev.) Dubois Jefferson AP (elev. 1804') That's 1.6F difference over less than 300 feet. So my estimate is based on actual data. I guess I need to go to flight school to learn how the actual data is wrong.
-
Central Pa. Summer 2024
TheClimateChanger replied to mahantango#1's topic in Upstate New York/Pennsylvania
So yeah, I said what I said and I believe it to be accurate. -
Central Pa. Summer 2024
TheClimateChanger replied to mahantango#1's topic in Upstate New York/Pennsylvania
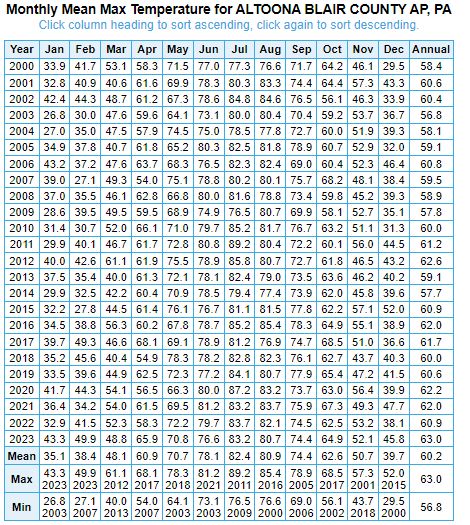
Pick any two sites that are nearby are you'll see the actual difference is greater than 4F per 1000 feet. Here's 3.4F difference on 800' elevation gain. You say you need 1,000 feet of gain for this change. Actually, you claimed even less in a humid climate like Pennsylvania. Cambria County Airport (2274') Altoona Airport (1467')
-
Central Pa. Summer 2024
TheClimateChanger replied to mahantango#1's topic in Upstate New York/Pennsylvania
Near surface lapse rate is greater than open air lapse rate, due to downsloping effects. Only one is relevant to this discussion. -
Pittsburgh, Pa Summer 2024 Thread.
TheClimateChanger replied to meatwad's topic in Upstate New York/Pennsylvania
Going to be a close one today, either 89 or 90F so far. With the clouds rolling in, might be done for the day. I did see the current temperature was 31.7C (89.1F), which is also what the 6-hourly high was at 1:51 pm. Needs to reach [or have reached] 32.0C (89.6F) to go in the books as 90F. -
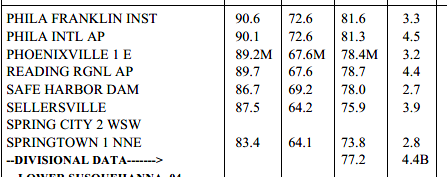
NCEI reports August 2022 was 3.3F warmer than August 1975 in the Southeastern Piedmont region of Pennsylvania. Is this reasonable? One way of looking at this would be to compare stations for which data is available in both periods - unfortunately, I see only two such stations - Philadelphia International Airport and Phoenixville. Looking at these two, PHL was 4.7F warmer in August 2022 relative to August 1975. Phoenixville was 4.4F warmer, albeit with some missing data in 2022. Additionally, the Franklin Institute site (2022) is very near to the 23rd & Market site (1975) in Philadelphia. It was 4.3F warmer in 2022 versus 1975 at those two sites. Overall, if anything, the NCEI figures look cooler than the comparative data might suggest. This looks like more hullabaloo over nothing.
-
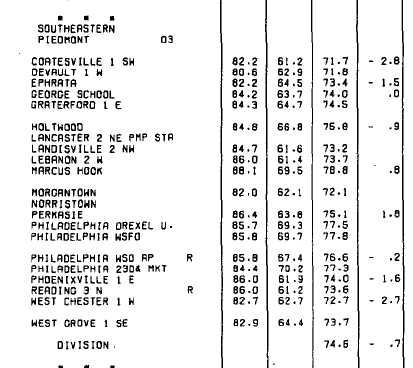
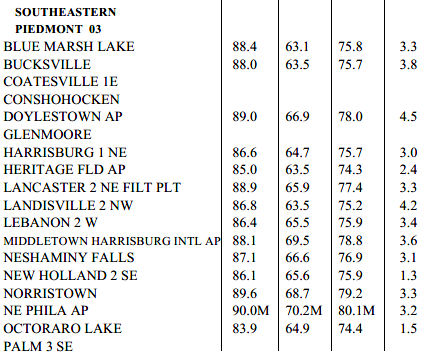
This is actually surprisingly easy to debunk. Chester County is part of what is known as the Southeastern Piedmont climatological region of Pennsylvania. In August 1975, the mean of 19 stations was 74.6F. In August 2022, the mean of 21 stations was 77.2F. If you pull up the current divisional data from NCEI, you'll see August 1975 is 73.0F. Looks pretty damning - that's a drop of 1.6F over what was reported. But then turn to August 2022, the value is 76.3F, or 0.9F cooler than reported. It's important to note that the values reported in the publication are simply the arithmetic mean of the station data, while the means shown on NCEI are areal averages factoring in topography/elevation etc. As long as processed in the same manner, the suite of stations can change and still produce a comparable value. In any event, there is no systematic warming of recent data like these guys frequently show - the opposite, in fact. You're welcome to do this with any time period, any month, any region since they started using the current climatological divisions and the result. That's why it's important, as @ChescoWx always says, to look at the raw data!
-
Central Pa. Summer 2024
TheClimateChanger replied to mahantango#1's topic in Upstate New York/Pennsylvania
Not too surprised the "ROU" is cooler than Harrisburg International Airport. One is at ~300' on the Susquehanna River, and the other is 750-800 feet, with some residential areas on the neighboring hills at 1,000 to 1,200 feet. Not sure how much of that is attributable to an urban heat island effect. That level of elevation gain is sufficient for daytime maxima to be around 3F cooler in town, and upwards of 5F cooler in the hills, relative to the airport. -
Summer 2024 Medium/Long Range Discussion
TheClimateChanger replied to Chicago Storm's topic in Lakes/Ohio Valley
Some of this data is wrong for the record-breaking winter of 1935-1936. While many of the lowest hourly dewpoints on record at Des Moines did occur during that winter (including the all-time low of -40F on January 29, 1936 & February 14, 1936), it was not lower than -60F with those huge daily swings shown. -
Summer 2024 Medium/Long Range Discussion
TheClimateChanger replied to Chicago Storm's topic in Lakes/Ohio Valley
Also has daily minimum and maximum dewpoints, which can be downloaded as a .csv file. -
Summer 2024 Medium/Long Range Discussion
TheClimateChanger replied to Chicago Storm's topic in Lakes/Ohio Valley
IEM [Iowa Environmental Mesonet] is the easiest for monthly data, but it generally goes back no further than the 1930s or 1940s [or the earliest date on which a newer station opened]. -
Central Pa. Summer 2024
TheClimateChanger replied to mahantango#1's topic in Upstate New York/Pennsylvania
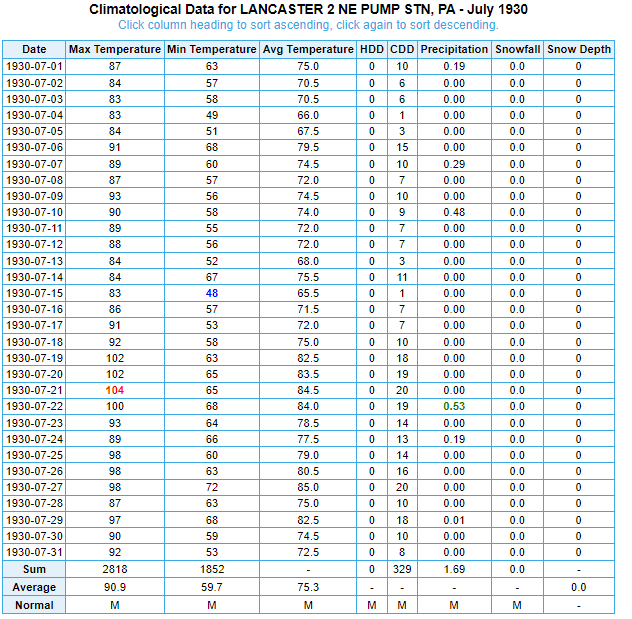
Here is 1930. Let's just say I'm a little skeptical of this temperature distribution. But man, 50s for a mean low in July isn't too shabby. You wouldn't need air conditioning at night, because you can just open the window and use a fan. In that regard, I guess I disagree with most of you. I do not believe only high temperatures matter in judging summer warmth. In fact, I would argue low temperatures and humidity are the two most important factors when it comes to cooling demand. As a child, we didn't have air conditioning and it really wasn't needed. That's not the case anymore.

-
Central Pa. Summer 2024
TheClimateChanger replied to mahantango#1's topic in Upstate New York/Pennsylvania
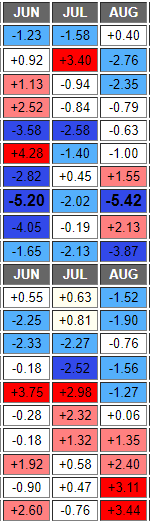
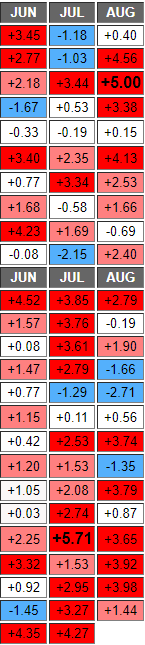
Hmmm? Doesn't strike me as super hot compared to recent decades. There were some warm years in the mid to late 1930s, but nothing like recent years. 1920-1939 2000-2024 And if you're really curious. The historic data [pre-1968] comes from the cooperative weather observation at the Lancaster City WWTP, not at Millersville University at all. It obviously wouldn't benefit from the pristine siting and monitoring of MU's meterology department, and isn't directly comparable. Moreover, the WWTP site is about 250' versus 380' at MU. And the extreme thermometers were reset at 5 pm daily in the historic observations, versus midnight to midnight at MU. Factoring these in, the change in elevation would tend to make Lancaster about 0.4-0.5F warmer than Millersville [average drop is about 4F / 1,000 feet]. The TOBs bias adds about 1F to the reported mean temperature - that is, resetting the thermometer at 5 pm versus midnight adds about 1F to the temperature as a result of the 5 pm temperature being warmer than the actual high the following day [but attributed as the high for that day] and the loss of midnight low temperatures, which happen fairly frequently in the summertime. Despite these warming advantages, all recent years at Millersville are warmer than the historic observations at Lancaster.
-
Occasional Thoughts on Climate Change
TheClimateChanger replied to donsutherland1's topic in Climate Change
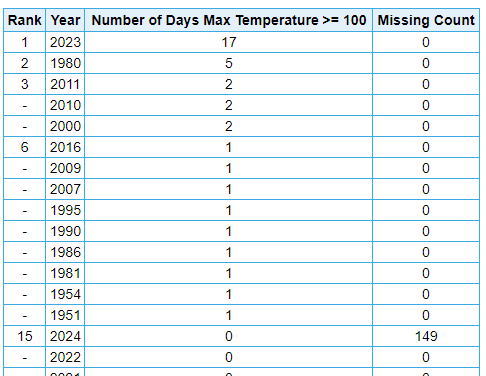
Looks like some very hot weather in New Orleans in the wake of Tropical Storm Debby. Current forecast would suggest 3 straight days of around 100F heat. I would suggest the all-time record could be at jeopardy, but that appears unlike due to last summer reaching 105F. Still only 14 years since 1946 have reached 100 or better at New Orleans. And this is quite shocking. I didn't see much in the news about this. But last summer looks like it was totally insane there. From 1946 to 2022, there were a total of 20 days at or above 100F. Last summer alone had 17!
-
Gulf Stream to Shut Down this Century
TheClimateChanger replied to 40/70 Benchmark's topic in Climate Change
I can assure you there will NEVER be sea ice off the south coast of England so long as humankind reigns. -
Gulf Stream to Shut Down this Century
TheClimateChanger replied to 40/70 Benchmark's topic in Climate Change
The CNN article implies sea ice to the southern coast of England. That's a load of rubbish. -
Gulf Stream to Shut Down this Century
TheClimateChanger replied to 40/70 Benchmark's topic in Climate Change
There is no magical thermostat on earth. It will continue warming regardless of what the AMOC does, probably even speed up. Parts of Europe might see a modest cooling. No ice age. No little ice age. That's a bunch of nonsense. Sorry to rain on everyone's fantasies. The Gulf Stream Myth (columbia.edu) The Source of Europe's Mild Climate | American Scientist -
Central Pa. Summer 2024
TheClimateChanger replied to mahantango#1's topic in Upstate New York/Pennsylvania
Burn scar? Was that supposed to be in there? -
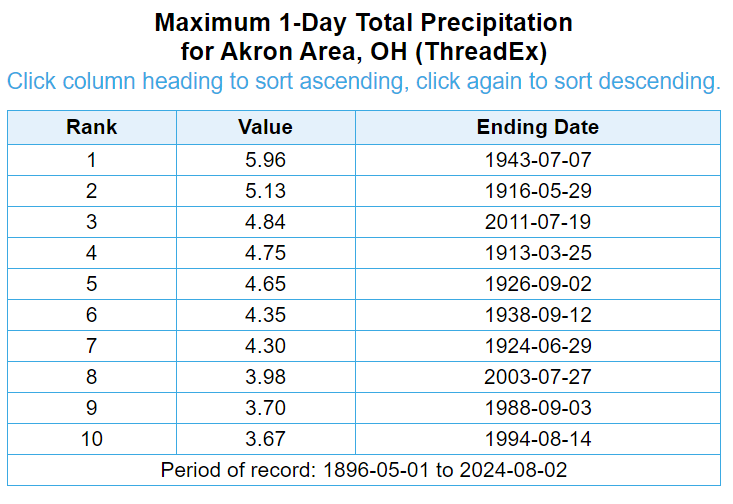
The 4.19" of rain since midnight (eastern standard time) currently ranks this as the 8th wettest day on record in the Akron area since 1896. Radar shows more heavy showers and thunderstorms slowly pushing into the area, so additional rainfall is likely.
-
Pittsburgh, Pa Summer 2024 Thread.
TheClimateChanger replied to meatwad's topic in Upstate New York/Pennsylvania
So far, the rain today has stayed just to my north, other than maybe a few sprinkles. Been hearing thunder for about an hour. Not far outside of our area, Akron-Canton Airport had 4.07" of rain in 1 hour and 25 minutes, between 10:20 and 11:50 am. So these storms are very capable of torrential downpours and flash flooding. -
In 1 hour & 25 minutes [10:25 - 11:50 am], 4.07" of rain was observed at Akron-Canton Regional Airport in Ohio. Storm total up to 4.18" as of 12:30 pm.

-
Have we gotten an all-time record eighth day at BWI yet?
-
Central Pa. Summer 2024
TheClimateChanger replied to mahantango#1's topic in Upstate New York/Pennsylvania
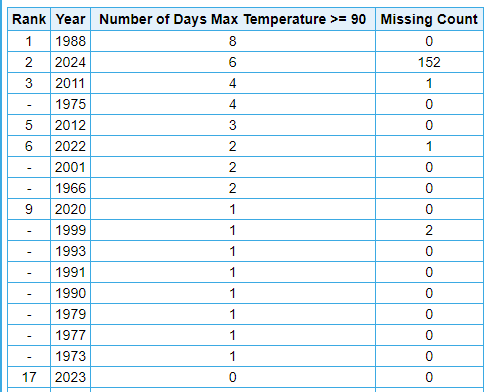
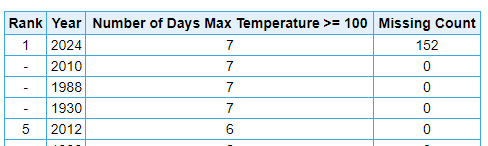
Yesterday's 90F reading at Bradford Regional Airport was the sixth so far this year, leaving 2024 just 2 shy of the calendar year record set in 1988. Still 152 days to tack on some more. 3 of the last 5 years have reached 90F at least once, which might not sound too impressive. But historically, the vast majority of years have not had any days at or above 90F.