TheClimateChanger
-
Posts
3,056 -
Joined
-
Last visited
Content Type
Profiles
Blogs
Forums
American Weather
Media Demo
Store
Gallery
Everything posted by TheClimateChanger
-
Pittsburgh/Western PA Winter 2024-2025 Thread
TheClimateChanger replied to Rd9108's topic in Upstate New York/Pennsylvania
Severe Thunderstorm Warning WVC077-093-161830- /O.NEW.KPBZ.SV.W.0001.250216T1800Z-250216T1830Z/ BULLETIN - IMMEDIATE BROADCAST REQUESTED Severe Thunderstorm Warning National Weather Service Pittsburgh PA 100 PM EST Sun Feb 16 2025 The National Weather Service in Pittsburgh has issued a * Severe Thunderstorm Warning for... Southeastern Preston County in northeastern West Virginia... North Central Tucker County in northeastern West Virginia... * Until 130 PM EST. * At 100 PM EST, a severe thunderstorm was located over Rowlesburg, moving northeast at 50 mph. HAZARD...70 mph wind gusts. SOURCE...Radar indicated. A 74 mph wind gust was reported at Elkins, WV IMPACT...Expect considerable tree damage. Damage is likely to mobile homes, roofs, and outbuildings. * Locations impacted include... Kingwood, Terra Alta, Rowlesburg, Albright, Tunnelton, Aurora, Cathedral State Park, Elgon and Cranesville. PRECAUTIONARY/PREPAREDNESS ACTIONS... Anyone outdoors should move to shelter inside a well-built structure and stay away from windows. This storm is capable of producing widespread damaging winds. && LAT...LON 3927 7969 3944 7980 3960 7950 3940 7948 3935 7948 3934 7949 3929 7949 3922 7965 TIME...MOT...LOC 1759Z 239DEG 44KT 3932 7967 THUNDERSTORM DAMAGE THREAT...CONSIDERABLE HAIL THREAT...RADAR INDICATED MAX HAIL SIZE...0.00 IN WIND THREAT...RADAR INDICATED MAX WIND GUST...70 MPH $$ McMullen -
Pittsburgh/Western PA Winter 2024-2025 Thread
TheClimateChanger replied to Rd9108's topic in Upstate New York/Pennsylvania
Isn’t that the map for the snow this morning? -
Pittsburgh/Western PA Winter 2024-2025 Thread
TheClimateChanger replied to Rd9108's topic in Upstate New York/Pennsylvania
FWIW, the 12z run of the GFS has a look very consistent with this outlook. -
Pittsburgh/Western PA Winter 2024-2025 Thread
TheClimateChanger replied to Rd9108's topic in Upstate New York/Pennsylvania
That would be brutal. Let's hope CPC is right about this period. It looks like their outlook from yesterday assumed any major storm would scoot off the Mid-Atlantic coast. -
Occasional Thoughts on Climate Change
TheClimateChanger replied to donsutherland1's topic in Climate Change
Yes, the cold was most impressive relative to the mean in the southern U.S. West Virginia was the coldest state, recording the 12th coldest January on record, probably driven, in part, by unusually persistent snow coverage. The State of New York was actually 0.6F above the 20th century mean and ranked as 60th warmest January, per NCEI. -
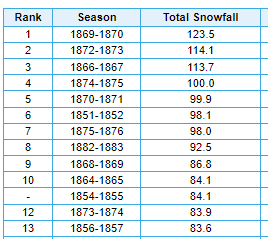
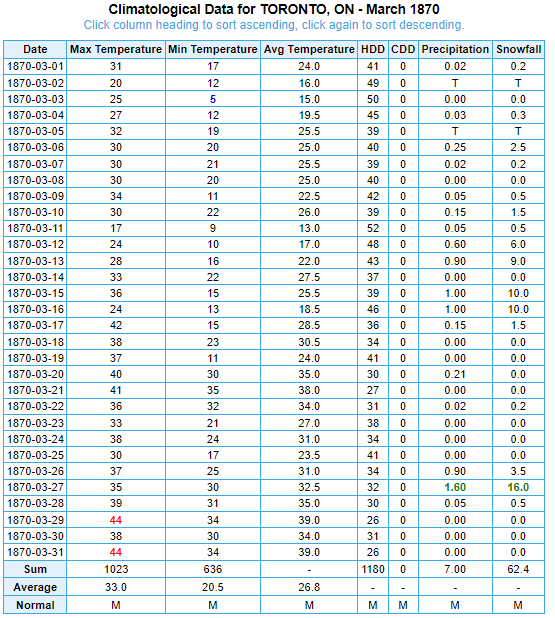
I was doing some more research on Toronto seasonal snowfall. Look at these historic winter snow totals from the 19th century. Those are some "old-fashioned" winters! March 1870 must have been insane - wow! 62.4 inches of snow, with a 26.8F mean temperature. 21.5" of snow from the 15th to 17th, and 20" from the 26th to 28th.
-
Pittsburgh/Western PA Winter 2024-2025 Thread
TheClimateChanger replied to Rd9108's topic in Upstate New York/Pennsylvania
I am hoping this is overdone off to our northwest. Is it really plausible that Detroit could pick up 14 inches of snow in the next 5 days? I don't buy it. This first storm looks like a 2 to 4-inch deal up there, and the weekend event looks like it will bring P-type issues again. I don't see why the Kuchera would be so much more than 10:1. This looks like a 10:1 type setup for most areas given the marginal atmospheric profile. -
Impressive, and coming in a very strong El Nino winter, similar to the January 2016 snow storm.
-
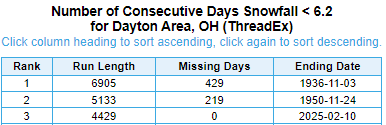
Meanwhile, it has been 4,429 days since the last calendar day snowfall of 6.2" or more at Dayton. At this point, I'm unsure whether Dayton will see a daily snowfall that high ever again. I initially believed this to be a record; however, I noticed xMacis culminates streaks at days with missing data. Allowing for missing days, two potentially longer stretches arise. Of course, one would have to examine those streaks to see whether the missing data is impacted the longevity. The last time Dayton saw a snowfall that high was Boxing Day of 2012. That's a long time!

-
Certainly a brutal start to February for Dayton. Since 1894, I could find only 5 years without at least some snowflakes flying in the first 10 days of the month.
-
Pittsburgh/Western PA Winter 2024-2025 Thread
TheClimateChanger replied to Rd9108's topic in Upstate New York/Pennsylvania
I am always highly skeptical of the totals when they show that sharp linear cutoff along the south edge. I know Joe Bastardi has a saying "you have to be close enough to smell the sleet (or rain?)" but I don't think that's ever been true in our part of the world. Usually the mixed precipitation continues further north cutting down on totals, and there is usually an area where it's snowing but the ratios are pathetic in this type of a setup. It's a subtype of snow that's extremely moisture laden and not very puffy or air-filled and ineffective at accumulating where ratios could be as low as 6:1. Those super sharp cutoffs are usually reserved for the northern edge of the precipitation, like the January 2016 snowstorm. Or, of course, to a smaller extent, with occasional lake effect snow bands which tend to favor some of the northern and northwestern communities. So I'm not super impressed with this depiction, even if it is showing some heavy snow in the northern parts of the metro. I don't think going from inch or two in southern Allegheny, to 8-12 inches in northern Allegheny is a plausible outcome for this setup. More like an inch or two around Pittsburgh, to perhaps several inches up near I-80. -
Occasional Thoughts on Climate Change
TheClimateChanger replied to donsutherland1's topic in Climate Change
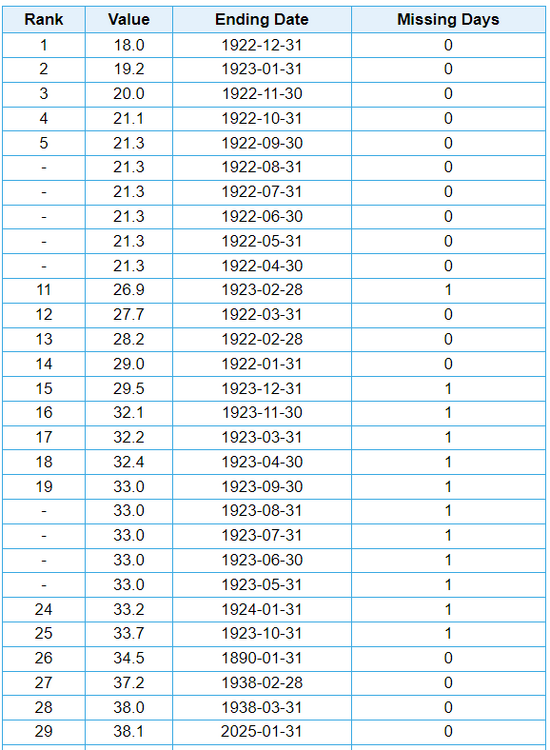
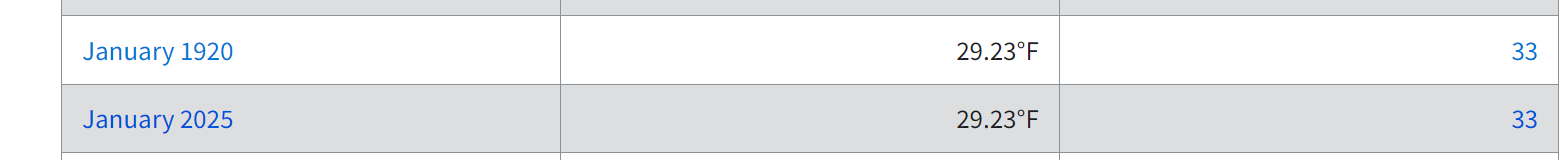
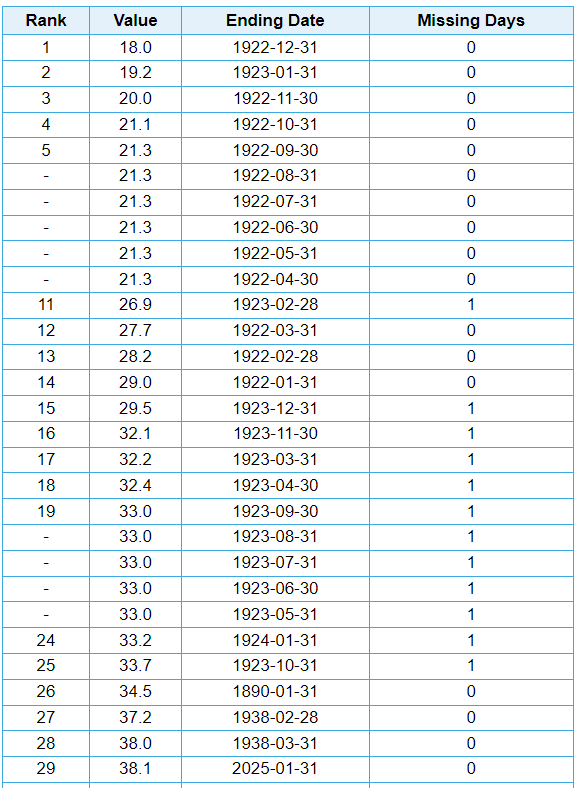
Coldest January in the U.S. since 1988, barely beating out 1994. I guess climate change is over (just kidding!). What they won't tell you is from 1895 to 1988, inclusive, a period of 94 years, fully 33 of them saw Januarys that are as cold or colder than this one! So that's more than 1 out of every 3 years, meaning this was largely a typical 20th century January. Something that happens more than 1 out of every 3 years is pretty much as normal as it gets. Proof: Tied with 1920 for 33rd coldest, meaning 33 years saw Januarys as cold or colder than this one until 1988. Yet it's been nearly 40 years since we've had a January as cold or colder than this one for the CONUS. Weird - it's almost like something has changed.
-
Pittsburgh/Western PA Winter 2024-2025 Thread
TheClimateChanger replied to Rd9108's topic in Upstate New York/Pennsylvania
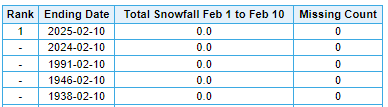
It would be nice to get back on the board again. After a fairly snowy start to January, there has only been 0.1" dating back to the 25th. And the last 30 days (1/12-2/10) have only measured a total of 6.3 inches. That's pretty crappy in what climatologically is the snowiest period in Pittsburgh. -
Pittsburgh/Western PA Winter 2024-2025 Thread
TheClimateChanger replied to Rd9108's topic in Upstate New York/Pennsylvania
The NAM shows a couple inches tomorrow for the metro area (particularly south), is that possible? -
Pittsburgh/Western PA Winter 2024-2025 Thread
TheClimateChanger replied to Rd9108's topic in Upstate New York/Pennsylvania
-
Pittsburgh/Western PA Winter 2024-2025 Thread
TheClimateChanger replied to Rd9108's topic in Upstate New York/Pennsylvania
New special weather statement for parts of the Pittsburgh metro. My current temperature is 31.1F, so this is interesting. Lot of movement on that storm cell as well - 80 mph, wow! Special Weather Statement National Weather Service Pittsburgh PA 357 PM EST Sat Feb 8 2025 OHZ040-049-050-PAZ020-021-029-WVZ001-002-082145- Jefferson OH-Harrison OH-Carroll OH-Beaver PA-Allegheny PA- Washington PA-Brooke WV-Hancock WV- 357 PM EST Sat Feb 8 2025 ...A STRONG THUNDERSTORM WILL IMPACT NORTHEASTERN HARRISON...NORTHERN JEFFERSON...SOUTHEASTERN CARROLL...SOUTHERN BEAVER...NORTHWESTERN WASHINGTON...CENTRAL ALLEGHENY...BROOKE AND HANCOCK COUNTIES THROUGH 445 PM EST... At 357 PM EST, Doppler radar was tracking a strong thunderstorm 10 miles southeast of Carrollton, moving east at 80 mph. HAZARD...Pea size hail. SOURCE...Radar indicated. IMPACT...Minor hail damage to vegetation is possible. Locations impacted include... Pittsburgh, Penn Hills, Mount Lebanon, Ross Township, McCandless Township, Moon Township, Weirton, Steubenville, Franklin Park, Shaler Township, North Side Pittsburgh, Baldwin, Upper St. Clair, Hampton Township, Scott Township, Wilkinsburg, Whitehall, Robinson Township, Dormont, and O`hara Township. This includes the following highways... Interstate 79 in Pennsylvania between mile markers 54 and 72. Parkway North between mile markers 1 and 13. Interstate 376 in Pennsylvania between mile markers 47 and 75. PRECAUTIONARY/PREPAREDNESS ACTIONS... If outdoors, consider seeking shelter inside a building. && LAT...LON 4034 8111 4052 8112 4060 8000 4049 7982 4036 8000 TIME...MOT...LOC 2057Z 266DEG 69KT 4044 8101 MAX HAIL SIZE...0.25 IN MAX WIND GUST...<30 MPH $$ Milcarek -
Pittsburgh/Western PA Winter 2024-2025 Thread
TheClimateChanger replied to Rd9108's topic in Upstate New York/Pennsylvania
Special Weather Statement National Weather Service Pittsburgh PA 322 PM EST Sat Feb 8 2025 OHZ039-040-048-049-082100- Tuscarawas OH-Harrison OH-Coshocton OH-Carroll OH- 322 PM EST Sat Feb 8 2025 ...A STRONG THUNDERSTORM WILL IMPACT NORTHERN HARRISON...NORTHEASTERN COSHOCTON...SOUTHERN CARROLL AND CENTRAL TUSCARAWAS COUNTIES THROUGH 400 PM EST... At 322 PM EST, Doppler radar was tracking a strong thunderstorm 7 miles southeast of Killbuck, or 8 miles south of Millersburg, moving east at 75 mph. HAZARD...Half inch hail. SOURCE...Radar indicated. IMPACT...Minor hail damage to vegetation is possible. Locations impacted include... New Philadelphia, Dover, Uhrichsville, Dennison, Sugarcreek, Gnadenhutten, Tuscarawas, Baltic, Scio, Midvale, Jewett, Warsaw, Amsterdam, Bowerston, Barnhill, Dellroy, Sherrodsville, Roswell, Stone Creek, and Leesville. This includes Interstate 77 in Ohio between mile markers 69 and 84. PRECAUTIONARY/PREPAREDNESS ACTIONS... If outdoors, consider seeking shelter inside a building. && LAT...LON 4045 8199 4044 8167 4053 8166 4058 8086 4056 8086 4056 8092 4047 8092 4047 8094 4042 8094 4042 8086 4034 8087 4033 8201 TIME...MOT...LOC 2022Z 266DEG 65KT 4043 8187 MAX HAIL SIZE...0.50 IN MAX WIND GUST...<30 MPH $$ Milcarek -
Pittsburgh/Western PA Winter 2024-2025 Thread
TheClimateChanger replied to Rd9108's topic in Upstate New York/Pennsylvania
Actually, looking back at the records, the seasonal snowfall that winter was only 19.3" through February 12 - that's even less than this winter. -
Pittsburgh/Western PA Winter 2024-2025 Thread
TheClimateChanger replied to Rd9108's topic in Upstate New York/Pennsylvania
Maybe, we just need to imagine it's 1993 again. I was doing some research some months back and came across an article in the Post Gazette for early March 1993. And it noted how, after several winters with below to much below normal snowfall, that winter (through the end of February) was actually pretty close to a normal Pittsburgh winter, even though it seemed much worse coming off a spate of mild winters. Snowfall stood at 37.5" versus a seasonal average of 46" (being the seasonal snowfall normal quoted at the time). Of course, little did they know the surprises the rest of March would bring, which would catapult the winter of 1992-1993 to one of the snowiest on record. -
Pittsburgh/Western PA Winter 2024-2025 Thread
TheClimateChanger replied to Rd9108's topic in Upstate New York/Pennsylvania
SPC has us outlined in a risk for general thunder today. A marginal risk of severe thunderstorms extends as far north as far southern Ohio, including locations such as Gallipolis, Ironton, and Portsmouth, along the Ohio River. -
Central PA Banter (Banter Less?) Thread
TheClimateChanger replied to Itstrainingtime's topic in Upstate New York/Pennsylvania
Unreal. It goes without saying that the grifting establishment social climbers are upset on X (see, e.g., post from @flying_rodent below). Do these people ever stop and think that these CIA front dollars are part of the reason these people hate us? Like, maybe, just maybe, Sri Lankans don't want to not use gendered language, and maybe people don't want meals going to Al Qaeda or bat virus research in Wuhan. But I don't know, I'm just a simple guy. Not a top-secret CIA spy. If we're spending all of that money to buy influence, it doesn't seem like it's working. -
Winter 2024-25 Medium/Long Range Discussion
TheClimateChanger replied to michsnowfreak's topic in Lakes/Ohio Valley
While improbable, not impossible. I recall one storm in early January 1999, I think around the 2nd or 3rd, where precipitation started as snow but we had sleet with temperatures around or even slightly below 10F and freezing rain in the teens, although temperatures eventually climbed to around freezing or slightly above. There may have even been some lightning and thunder. That was crazy stretch in general with about three feet of snow that month, most falling in about 15 days. -
Pittsburgh/Western PA Winter 2024-2025 Thread
TheClimateChanger replied to Rd9108's topic in Upstate New York/Pennsylvania
And actually this analysis overestimates the recurrence of what was depicted on the 18z GFS. A closer review of the model shows almost all of that falls in the final 8 days of the model run. There has never been that much snow observed in an 8-day period.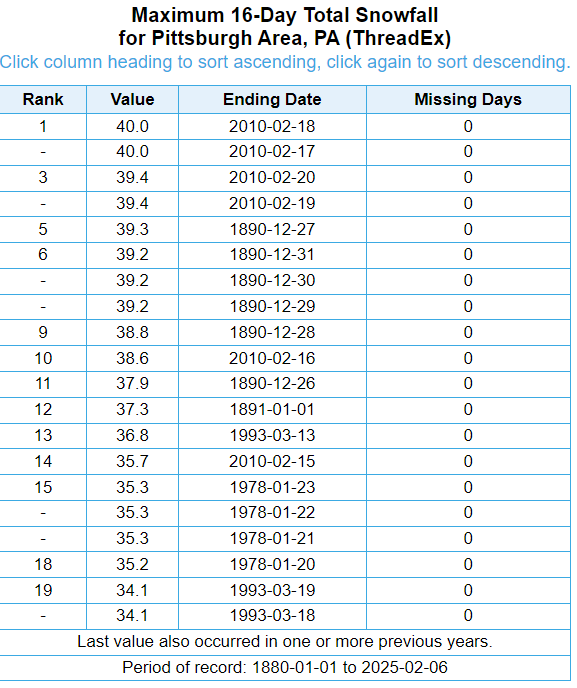
-
Pittsburgh/Western PA Winter 2024-2025 Thread
TheClimateChanger replied to Rd9108's topic in Upstate New York/Pennsylvania
We do need to take these model depictions with a grain of salt. For context, the snowiest 16-day periods on record are shown below. The only times that much snow fell in 16 days were with massive snowstorms in December 1890, January 1978, March 1993, and February 2010. Not even November 1950 had that much snow in any 16-day period, officially.
-
Winter 2024-25 Medium/Long Range Discussion
TheClimateChanger replied to michsnowfreak's topic in Lakes/Ohio Valley
Here is another good way to view the recent snow drought in Chicago. We can see the 24-month period ending January 31st was the least snowy 24 months since the 24-month period ending March 30, 1938! The exact ranking on this metric isn't super important, since these are not independent values - that is, any month will share 23 of the 24 months with the preceding and following month. And during the warm season, the values are static, since a month with no snow simply replaces a month with no snow two years earlier.