

TheClimateChanger
-
Posts
3,066 -
Joined
-
Last visited
Content Type
Profiles
Blogs
Forums
American Weather
Media Demo
Store
Gallery
Everything posted by TheClimateChanger
-
Similarly, in the 106-year period beginning in 1892 and ending in 1997 [inclusive], this value was exceeded in only 9 summers at Tallahassee, Florida.

-
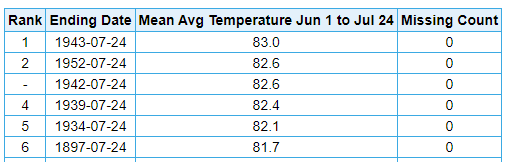
The mean temperature at DCA has been 81.9F for the summer to date. In the 93-year period beginning in 1884 and ending in 1976 [inclusive], this value was exceeded on only 5 occasions in Savannah, Georgia. Those being the summers of 1934, 1939, 1942, 1943 and 1952.
-
Central Pa. Summer 2024
TheClimateChanger replied to mahantango#1's topic in Upstate New York/Pennsylvania
70% chance of 90+ by Sunday for valleys and urban areas. The usual hot spots out your way will probably approach 95F. -
Central Pa. Summer 2024
TheClimateChanger replied to mahantango#1's topic in Upstate New York/Pennsylvania
The latest PBZ AFD highlighting some of the weather items I discussed yesterday. .LONG TERM /SUNDAY THROUGH WEDNESDAY/... KEY MESSAGES: - Warmer and more humid on Sunday. - A few rounds of disturbances pass to close out the weekend into the middle of next week. - Moderate risk of excessive heat beginning in August. ------------------------------------------------------------------- Further modification of the airmass continues on Sunday which will likely be the warmest day of the forecast period as probabilities sit up to 70% for >90F in the urban areas and valleys, though upper cloud coverage will increase from the southwest and could keep highs a little cooler. Ensemble clusters all absorb a cutoff upper low across the deep South back into the southwest flow aloft and show good agreement on its track through the Ohio Valley, but differ some on the amplification. This will return a more unsettled pattern to close out the end of the weekend into the beginning of next week as a few more disturbances pass through. Thereafter, ensembles still show notably good agreement by mid week in central CONUS ridging which would place our area in northwest flow aloft. While these patterns tend to be dry on average, they are also supportive of rounds of severe weather chances as we experienced in a similar pattern last week. Machine learning does paint a broad-brushed potential for a severe threat by mid week, but details won`t become clear for several more days. In addition, heat concerns return. Accordingly, CPC has issued another moderate risk of excessive heat from August 1st through August 7th. Lastly, with flow aloft extending downstream of the Canadian Rockies, wildfire smoke could make its debut to the Pittsburgh region this year. -
Pittsburgh, Pa Summer 2024 Thread.
TheClimateChanger replied to meatwad's topic in Upstate New York/Pennsylvania
.LONG TERM /SUNDAY THROUGH WEDNESDAY/... KEY MESSAGES: - Warmer and more humid on Sunday. - A few rounds of disturbances pass to close out the weekend into the middle of next week. - Moderate risk of excessive heat beginning in August. ------------------------------------------------------------------- Further modification of the airmass continues on Sunday which will likely be the warmest day of the forecast period as probabilities sit up to 70% for >90F in the urban areas and valleys, though upper cloud coverage will increase from the southwest and could keep highs a little cooler. Ensemble clusters all absorb a cutoff upper low across the deep South back into the southwest flow aloft and show good agreement on its track through the Ohio Valley, but differ some on the amplification. This will return a more unsettled pattern to close out the end of the weekend into the beginning of next week as a few more disturbances pass through. Thereafter, ensembles still show notably good agreement by mid week in central CONUS ridging which would place our area in northwest flow aloft. While these patterns tend to be dry on average, they are also supportive of rounds of severe weather chances as we experienced in a similar pattern last week. Machine learning does paint a broad-brushed potential for a severe threat by mid week, but details won`t become clear for several more days. In addition, heat concerns return. Accordingly, CPC has issued another moderate risk of excessive heat from August 1st through August 7th. Lastly, with flow aloft extending downstream of the Canadian Rockies, wildfire smoke could make its debut to the Pittsburgh region this year. -
Central Pa. Summer 2024
TheClimateChanger replied to mahantango#1's topic in Upstate New York/Pennsylvania
I am on team Artusa. Summer is not over yet! -
Central Pa. Summer 2024
TheClimateChanger replied to mahantango#1's topic in Upstate New York/Pennsylvania
The moderate risk of extreme heat has been extended for an additional day through August 7, 2024. US Hazards OutlookNWS Climate Prediction Center College Park MD300 PM EDT July 24 2024Synopsis: Coast-to-coast mid-level high pressure is predicted across the contiguous U.S. (CONUS) during week-2. This is associated with favored warmer-than-normal temperatures for most of the Lower 48 states. Excessive heat is most likely across the west-central, central, and northeastern CONUS during the week-2 outlook period. In Alaska, mid-level low pressure is forecasted across most of the state, with the exception of the Aleutian archipelago where mid-level high pressure is favored.Hazards High risk of excessive heat for the south-central Plains and northern and western Missouri, Thu-Mon, Aug 1-5. Moderate risk of excessive heat for the Northeast and Mid-Atlantic region, Thu-Wed, Aug 1-7. Moderate risk of excessive heat for portions of the Interior West, all but far southern portions of the Great Plains, and central portions of the Mississippi Valley, Thu-Wed, Aug 1-7. Slight risk of excessive heat for the Interior West, most of the Great Plains, most of the Mississippi and Ohio Valleys, the Great Lakes region, Northeast, and Mid-Atlantic, Thu-Wed, Aug 1-7. Slight risk of excessive heat for the Central Valley of California, Fri-Wed, Aug 2-7. Rapid Onset Drought risk for portions of the Northern and Central Plains. Detailed SummaryFor Saturday July 27 - Wednesday July 31: WPC Days 3-7 U.S. HazardsFor Thursday August 01 - Wednesday August 07: For the week-2 period, ensemble means favor anomalous mid-level ridging and accompanying positive height departures across the CONUS, with maximum 500-hPa heights of at least 594 dm across the southwestern and south-central states.The week-2 temperature outlook favors above-normal temperatures over almost all of the CONUS. A slight risk of excessive heat is depicted across most of the Lower 48 states outside of the Southeast and southern Texas, and valid for the entire Outlook period. Within this extensive slight risk area, there are two areas where a moderate risk of excessive heat is favored. One area includes the Northeast and much of the Mid-Atlantic region, valid Aug 1-7. The second, larger area includes much of the Interior West, most of the Great Plains, and central sections of the Mississippi Valley, Aug 1-7. Within this second, larger area, there is a high risk of excessive heat for the south-central Plains and adjacent parts of the Mississippi Valley, valid Aug 1-5. A general consensus of temperature and excessive heat guidance indicates actual air temperatures across portions of the Northeast and Mid-Atlantic region may reach well into the 90’s, with heat index values exceeding 100 deg F. For the Plains, maximum air temperatures of 100-105 deg F are expected, with heat index values surpassing 110 deg F over portions of the south-central Plains. A skill weighted, bias-corrected hybrid tool (which considers actual air temperature and heat index), raw temperatures from the ensemble means, and Probabilistic Extremes Tool (PET) temperatures were used in the construction of today’s excessive heat map. Based on these same objective tools, a slight risk of excessive heat is depicted for the Central Valley of California, Aug 2-7, where heat index values may approach or exceed 110 deg F.The subtropical ridge is predicted to be centered over the Four Corners region during week-2, in its climatological position during the summer monsoon season. The 06z and 12z GEFS runs are predicting a tropical cyclone over the eastern Pacific to pass south of the Gulf of California early in the Outlook period. This scenario may trigger a gulf surge of moisture into the American Southwest, with the PET precipitation tool depicting amounts of about 0.5-inch. However, no precipitation hazard is predicted at this time.The heaviest precipitation amounts predicted during this outlook period range from 1.0-1.5 inches over a 3-day period, focused along the Southeast and Gulf Coasts. However, normal weekly precipitation amounts for those areas range from 1.0-1.5 inches in most areas to almost 2 inches along the Gulf coast of Florida. Therefore, no precipitation hazards are depicted on today’s hazards map. However, according to the experimental Flood Hazard Outlook, this amount of precipitation is enough to renew flooding chances across the eastern coastal region of North Carolina, which recently experienced heavy precipitation and has elevated soil moisture anomalies.The combination of continued above-normal temperatures and below-normal precipitation supports the continuation of a Rapid Onset Drought (ROD) risk over many parts of the Northern and Central High Plains. Dry soils, stressed vegetation, and reduced water availability due to low ponds and streams may lead to increased impacts to agriculture and livestock, with some locations already experiencing impacts.No hazards are posted for Alaska during week-2. However, there is a significant chance of accumulating snow for portions of the central and eastern Brooks Range, which could have an impact on people within that area. This possibility will be reassessed tomorrow after looking at the most recent model solutions. Near Juneau, localized flooding may be a concern associated with the glacial outburst flood for the Mendenhall River.Forecaster: Anthony Artusa -
Central Pa. Summer 2024
TheClimateChanger replied to mahantango#1's topic in Upstate New York/Pennsylvania
CPC refusing to back down on the high heat. Significant flash drought risk over the Plains. -
Central Pa. Summer 2024
TheClimateChanger replied to mahantango#1's topic in Upstate New York/Pennsylvania
It gets especially intriguing at Hour 51, as it looks like all the smoke gets wrapped up in a giant cyclone. I am not too impressed with modeled concentrations right now. Would want to see more 150 mg/m2 or higher for more significant impacts, IMO. -
Central Pa. Summer 2024
TheClimateChanger replied to mahantango#1's topic in Upstate New York/Pennsylvania
The view from the RAP-SMOKE is probably better since it shows Canada too. Lots of smoke gathering over central Canada. You can kind of imagine this could make a beeline for Pennsylvania if it were to get caught up in some NW to SE oriented jet stream winds. I think we would need the trough to flatten and push east to get into more of a NW flow pattern. -
Central Pa. Summer 2024
TheClimateChanger replied to mahantango#1's topic in Upstate New York/Pennsylvania
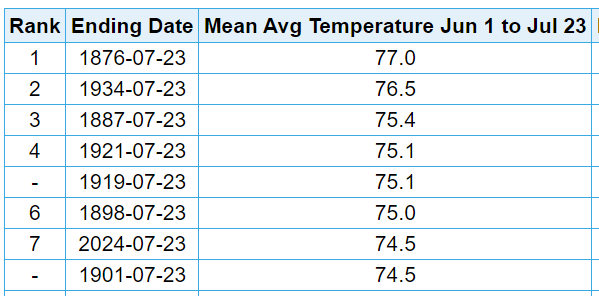
One thing I haven't seen much discussion of is how the extensive wildfire smoke might affect the upcoming temperatures? We've been fortunate so far that impacts have been minimal, but I do wonder if we won't start to see more smokiness and haze as we head into late summer. There's some evidence that wildfire smoke could lead to lower temperatures. Last summer saw several episodes of dense smoke, and it was the coldest summer at Harrisburg since 2017. Another good analog is 1950. Read about the Chinchaga fire storms, and Black Sunday here in the Commonwealth. Fascinating stuff. 1950 is tied with 1979 for 13th coldest summer at Harrisburg, and it came on the heels of the scorching summer of 1949. After this summer is complete, 1949 will drop into a 3-way tie for 18th warmest [with 2018 & 1955]. However, at the time, the heat of 1949 was nearly unparalleled among records dating to the 19th century, being exceeded only in the summers of 1900 and 1943. Nobody then foresaw a future where a mean of 75.4F would become rather pedestrian at Harrisburg [having been met or exceeded in 11 of the last 23 summers*]. So the drop-off between 1949 & 1950 must have been quite a shocker to the locals - perhaps a bit of a relief as well in those pre-A/C days. *Yes, 2024 is not complete. But the mean will most certainly exceed 75.4F. -
Central Pa. Summer 2024
TheClimateChanger replied to mahantango#1's topic in Upstate New York/Pennsylvania
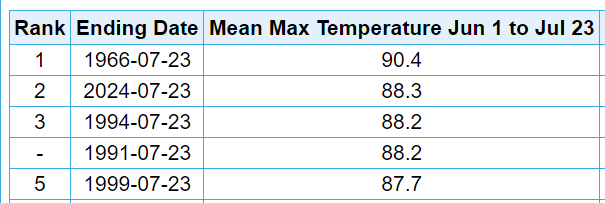
But my post was talking about the mean maximum temperature for summer to date, so it sounds like the only thing you really care about is arguing for the hell of it. -
Central Pa. Summer 2024
TheClimateChanger replied to mahantango#1's topic in Upstate New York/Pennsylvania
After further review, 1949 is missing the entire month of June at MPO. So toss that year, and make it 6th warmest (of 114 years).
-
Central Pa. Summer 2024
TheClimateChanger replied to mahantango#1's topic in Upstate New York/Pennsylvania
You're comparing the mean of 53 days with 1 day? But to answer your question, I have a scorching 88F on the trusty weather station. -
Central Pa. Summer 2024
TheClimateChanger replied to mahantango#1's topic in Upstate New York/Pennsylvania
Also, I've been told in the past that only maximum temperatures count. That is, that people judge summer heat by maximum temperature, and minimum temperatures don't count. The rankings are very similar across the board for mean maximum temperature. Every site is within 2 places of its mean temperature ranking if re-ranked by maximum temperature, with the exception of MPO and IPT. So we are legit cooking, and it's not just some overly inflated minimum temperatures.
-
Central Pa. Summer 2024
TheClimateChanger replied to mahantango#1's topic in Upstate New York/Pennsylvania
I think there's a reason to expect extreme heat at some point in the 6-14 day timeframe when CPC is saying there's an 80-90% chance heat index readings reach at or above the mid to upper 90s. -
Central Pa. Summer 2024
TheClimateChanger replied to mahantango#1's topic in Upstate New York/Pennsylvania
Extreme heat for CPC purposes is defined as a heat index roughly in the mid 90s for this time of the year in the Commonwealth. Those temperatures with unseasonably high dewpoints could easily attain that, and could even approach heat advisory criteria for a day or two. We can see the threshold for the 6-10 day period for "above normal MHI" is less than 95F for most of the state. This value actually appears to peak a couple weeks before maximum temperatures are achieved, as it's started to come down over the past couple of weeks. We can see in the 6-10 day period, there is an 80-90 percent chance that the heat index will peak above the 95F threshold. We can see in the 8-14 day max heat index outlook, the threshold is a bit higher. Not because that's a hotter period on average, but because there's two extra days in the period. So the threshold for what's considered an above normal MHI is higher. We have a 70-90 percent chance of reaching this threshold at some point over the period. Of course, there's some overlap in the two periods, so it could very well be on the same date. Anyways, no reason to suspect we are done with extreme heat for the near future. -
Central Pa. Summer 2024
TheClimateChanger replied to mahantango#1's topic in Upstate New York/Pennsylvania
Oh wait, I almost forgot about East Nantmeal. That's the place to beat the heat in the Commonwealth. It's even colder than the ridgetops.
-
Central Pa. Summer 2024
TheClimateChanger replied to mahantango#1's topic in Upstate New York/Pennsylvania
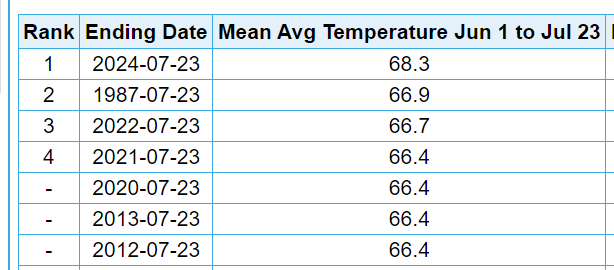
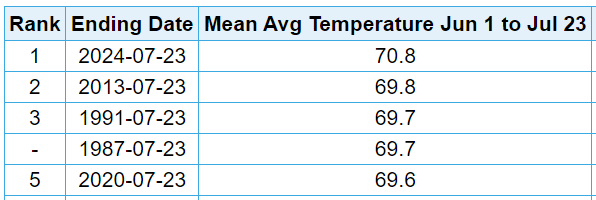
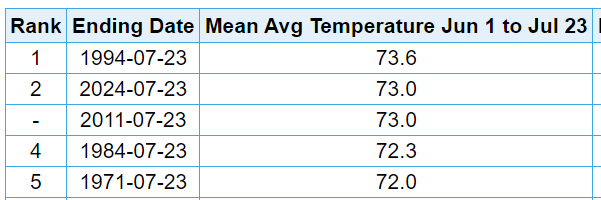
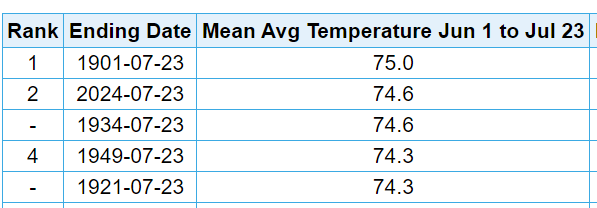
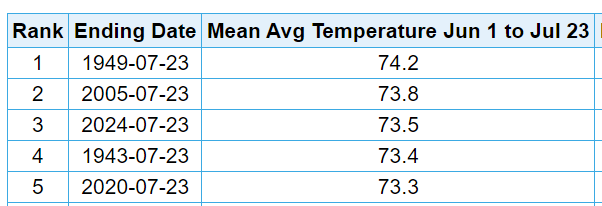
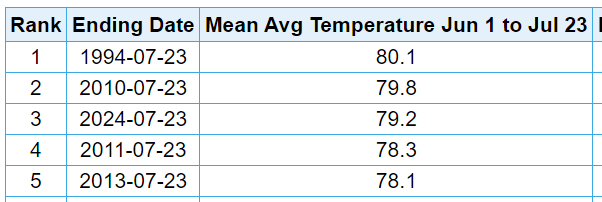
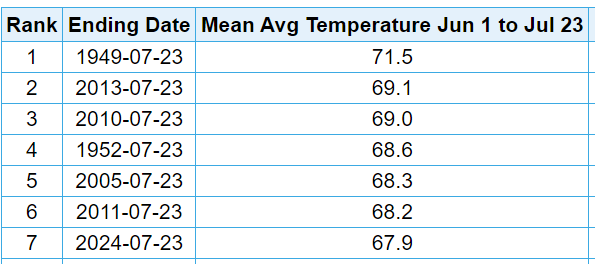
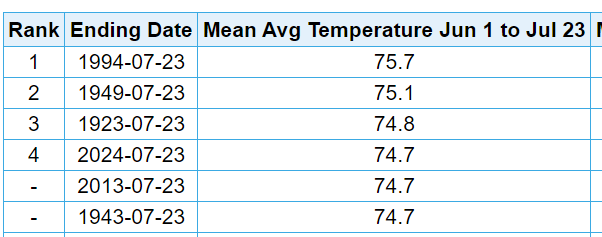
Anyways, shaping up to be an HISTORIC summer of epic proportions in the Commonwealth of Pennsylvania. CPC says more heat in the offing over the next 2 weeks and into the month of August, although there appears to be some disagreement there. Harrisburg - warmest of 137-year POR Reading - warmest of 129-year POR [by 1.2F] Bradford - warmest of 66-year POR [by 1.4F] DuBois - warmest of 59-year POR [by 1.0F] Altoona - 2nd warmest of 77-year POR Williamsport - 2nd warmest of 130-year POR Scranton/Wilkes-Barre - 3rd warmest of 124-year POR Philadelphia - 3rd warmest of 151+ year POR Allentown - Tied 4th warmest of 103 year POR Mount Pocono - 7th warmest of 115-year POR Pittsburgh - Tied 7th warmest of 150-year POR, by far hottest at the airport site Erie - The place to beat the heat in 2024. "Only" 11th warmest of 152-year POR.
-
Central Pa. Summer 2024
TheClimateChanger replied to mahantango#1's topic in Upstate New York/Pennsylvania
I'd probably trust the experts at CPC more than a model, no? -
Central Pa. Summer 2024
TheClimateChanger replied to mahantango#1's topic in Upstate New York/Pennsylvania
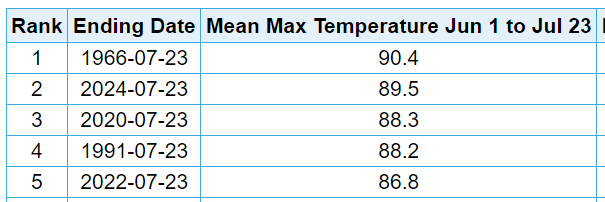
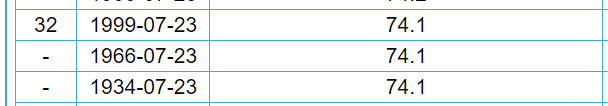
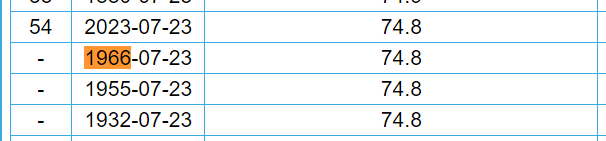
I didn't say anything about dropping it - just said it was inflated. We can see it looks to be running 2F warmer by daytime maxima than this year: But if we compare to the same location where the observation was made. Much of that disappears, and it is less than 1F warmer at Capital City Airport. But it's also inflated compared to surrounding observations, although there are a few sites that had similarly high readings. It looks like 1966 was a drought year, perhaps locally more severe drought conditions caused the grass and sod surrounding the thermometer site to die resulting in artificially inflated readings. If we look at the Hagerstown thread, we find 1966 only in 32nd place for warmest to date, tied with 1999 & 1934. At Williamsport, 1966 is only 112th warmest [of 130 years], tied with 1983, 1945 & 1918. This also means it's tied for 16th coldest to date. At Philadelphia, 1966 is only 54th warmest to date, tied with 2023, 1955 & 1932. This means there is a wide range in characterizing the temperature of 1966 in the region. Some places record it as a cold summer (IPT), some places as a lukewarm/moderate summer (PHL, HGR), and some as a hot summer (MDT, RDG, ABE). By contrast, this scorching summer is in the Top 4 hottest to date at all six of these long-term, first order, ThreadEx sites: RDG (#1), MDT (#1), IPT (#2), HGR (#2), PHL (#3), ABE (#4).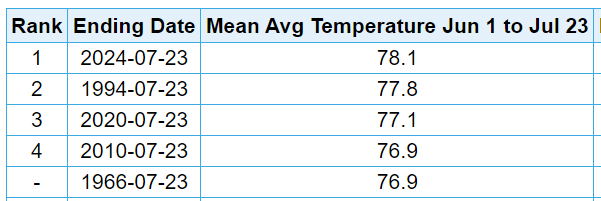

-
Central Pa. Summer 2024
TheClimateChanger replied to mahantango#1's topic in Upstate New York/Pennsylvania
-
Central Pa. Summer 2024
TheClimateChanger replied to mahantango#1's topic in Upstate New York/Pennsylvania
Does anyone know how the NWS determined how much rain fell at HGR the other day? I saw some discussion here. The precipitation sensor had failed and wasn't reporting any rainfall accumulation. The precipitation data was originally listed as "missing" but now they are reporting 2.93" fell. -
Occasional Thoughts on Climate Change
TheClimateChanger replied to donsutherland1's topic in Climate Change
The "raw data" graph presented by Martz is patently absurd. It shows 2019 as one of the coldest years on record. The only two years that are clearly colder are 1912 & 1917. It's as cold - maybe even a bit colder - than the late 1970s. I must have missed the months of bitterly cold and deep snow in 2019? What's funny is it shows the raw data being warmer than the adjusted data as recently as the early 2000s with the two being fairly close until 2016. Beginning in 2017, the raw data starts dropping precipitously below the adjusted data. How can any meteorologist think that is the real trend, or at least present it as the real trend? The claims about TOBs are also ridiculous. The observer was to reset the thermometers at a fixed time each day, and they recorded the temperature at time of observation as the set maximum. -
Pittsburgh, Pa Summer 2024 Thread.
TheClimateChanger replied to meatwad's topic in Upstate New York/Pennsylvania
Only a little over a tenth of an inch IMBY, which finally brings the monthly tally to a bit more than an inch.


