TheClimateChanger
-
Posts
3,056 -
Joined
-
Last visited
Content Type
Profiles
Blogs
Forums
American Weather
Media Demo
Store
Gallery
Everything posted by TheClimateChanger
-
Pittsburgh/Western PA Winter 2024-2025 Thread
TheClimateChanger replied to Rd9108's topic in Upstate New York/Pennsylvania
Definitely the good old days of yore. Here is what MGW observed from when they still had snow observations.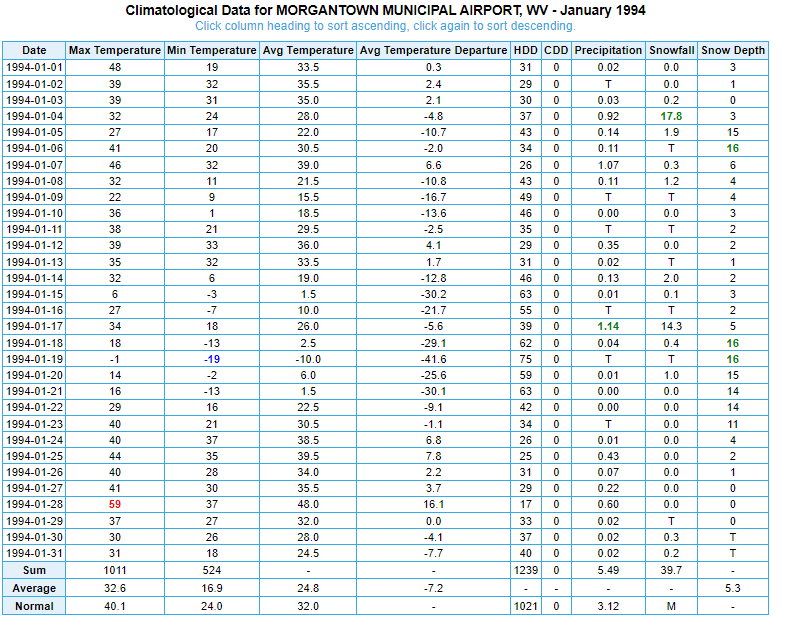
-
Good call. MLI is up to 60F. As an aside, it's crazy to me how fast that February monthly record high maximum has jumped in recent years. The long-standing record was 73F from 2/15/1921. In 2017, it tied this value 3 times and beat it once (74F, on 2/19/2017). Last year, it reached 76F on February 26, and an absolutely insane 79F on February 27. You have to think the first 80F February reading is right around the corner.
-
Let’s talk winter!! Ohio and surrounding states!! 24'-25'
TheClimateChanger replied to buckeye's topic in Lakes/Ohio Valley
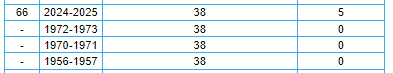
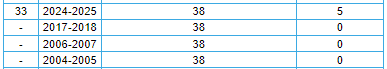
I'm just going off of xMacis. Looks like it's pretty typical for Ohio in a historical sense. Obviously, you may have done somewhat better in rural Knox county. xMacis reports CMH has had 23 days with 1" or more, which is only 36th most since 1948, and even that exaggerates the rarity versus limiting the comparison to the 1950 to early/mid 90s time frame. CLE has had 38 days of 1" or more snow cover. Looks like 69 other years have had as many or more [out of 133 years], and that includes a bunch of years from downtown where the snow cover would be less resilient. CAK has also had 38 days of 1" or more snow cover, which is a bit more impressive. But even still 35 other years had at least that many [out of 76 years with sufficient data], so pretty much par for the course [at least historically].
-
Occasional Thoughts on Climate Change
TheClimateChanger replied to donsutherland1's topic in Climate Change
At this point, it would seem catastrophic climate change cannot be avoided by emission reductions alone, so some form of geoengineering - whether it be direct air carbon capture, or some form of solar radiation management - is likely needed to avoid catastrophic climate change. My review of past climate change suggests there were glacial-free areas in the early Holocene in areas where there are now glaciers, and there may have been less summertime ice coverage. Global average temperatures during this period were very likely less than present temperatures but may have been as warm as early 20th century temperatures. However, this period of relative warmth lasted for thousands of years. Considering all reputable reconstructions suggest we have blown past the temperature at any point in the Holocene, to me, this suggests EXTREME changes will occur even with no further warming, including most likely a seasonally ice-free arctic ocean with substantial melting of montane glaciers and reduction in continental ice shelfs leading to significant sea level rise. Again, this assessment is based on NO FURTHER WARMING, but rather comparing similar, but cooler time frames to the present. It may even be the case that we are approaching the warmest period in 2.6 million years, although I cannot rule out some slightly warmer interglacials during the Pleistocene. In reality, we continue to quickly warm and will likely blow right past even the warmest of Pleistocene interglacial periods - perhaps, in a worst-case scenario, even reaching PETM levels. For the life of me, I cannot figure out how the IPCC safety zone of 1.5C or 2C was calculated - those are massive changes, corresponding to some of the warmest periods in the last 2.6 million years. It would be asinine to believe the earth could withstand such a massive climate change without dire consequences over the coming centuries. -
Occasional Thoughts on Climate Change
TheClimateChanger replied to donsutherland1's topic in Climate Change
I remain cautiously optimistic that the current administration may deploy a system of solar radiation management within the next 4 years or at least have a plan to implement such a system in the near future within the next 4 years, given its focus on technical solutions to the problems facing society. When prompted with a question about Elon's openness to implementing solar radiation management, Grok gave this response: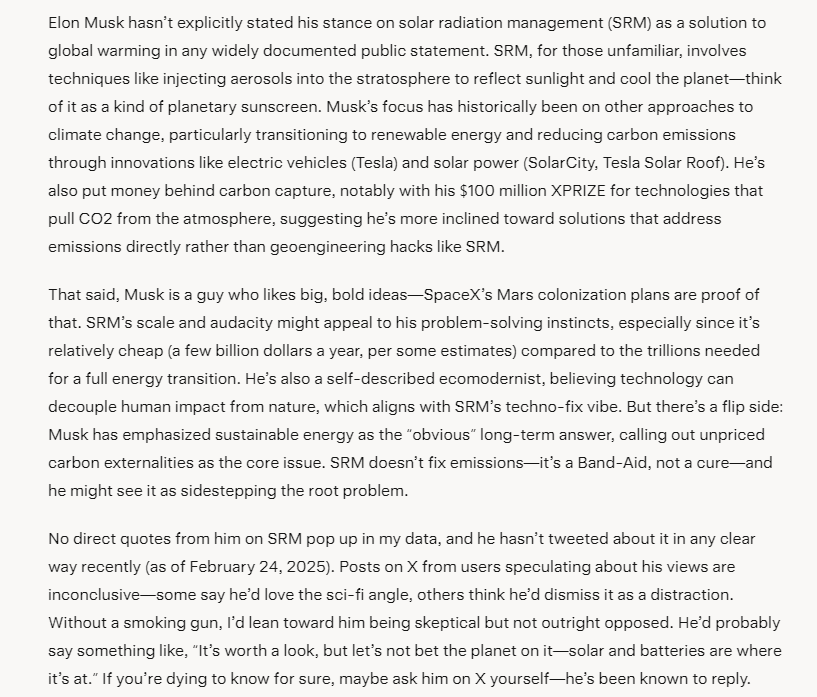
-
Let’s talk winter!! Ohio and surrounding states!! 24'-25'
TheClimateChanger replied to buckeye's topic in Lakes/Ohio Valley
Believe it or not, this used to be normal! -
Unbelievable. I was reading C. F. Volney's "A View of the Soil and Climate of the United States" from the early 1800s, and he noted the mild winters of the Ohio Valley and that parakeets overwintered in the Valley of the Scioto River. I thought, no way, there are no parakeets in Ohio. What the absolute bleep? There used to be parakeets in Ohio and we killed them all? Why did we kill all of the Ohio parakeets? This is an absolute travesty! Source: Carolina parakeet - Wikipedia
-
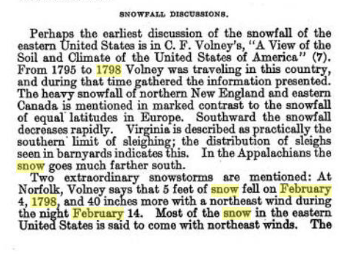
From the January 1915 Edition of the Monthly Weather Review, which was also published by Charles Franklin Brooks. The origination of the claim comes from C. F. Volney's "A View of the Soil and Climate of the United States of America" which was based on his observations from 1795 to 1798. I can't find any other source for the February 4, 1798, but there are surviving newspaper records of the February 14, 1798 storm and it is noted in Ludlum's work from 1963. Per Ludlum, it was reported that up to four feet of snow fell in parts of coastal North Carolina.
-
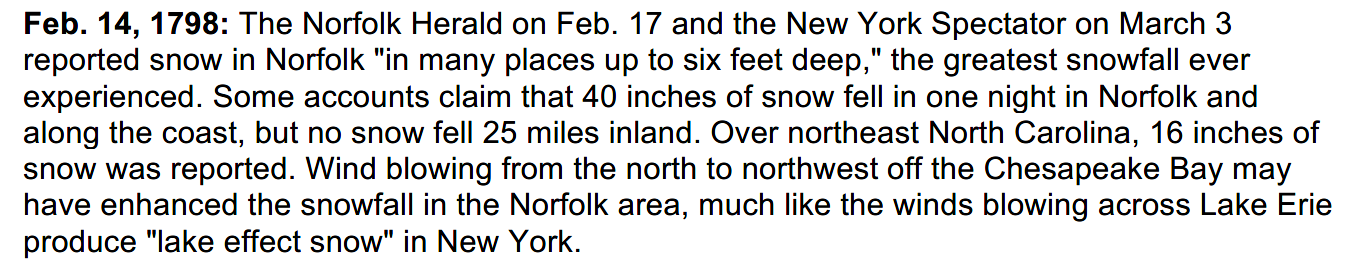
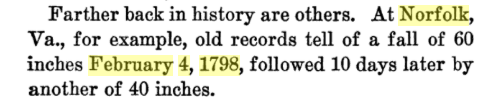
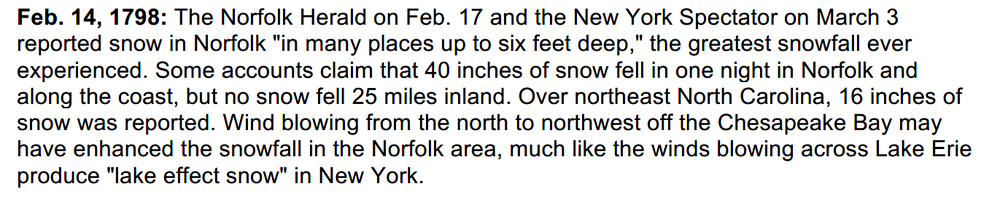
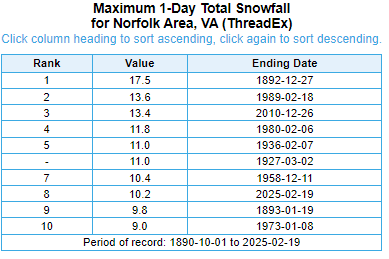
While it wasn't quite a redux of February 1798 for Norfolk, yesterday was the 8th highest calendar day snowfall on record since October 1, 1890. And the eighth time on record with 10 or more inches of snow in a single calendar day. In 1798, old records suggest as much as 60 inches fell on February 4, followed by another 40 inches on the 14th, with the Norfolk Herald and New York Spectator indicating snow depths as high as six feet on the level. Excerpt from "Why the Weather?" by Charles Frankin Brooks (1924). More insight on the February 14, 1798 storm:
-
Just a perfect storm. Increased human-induced forcing, and it looks like whatever natural processes were in play for a few decades to keep the radiative forcing trend below the human-induced warming trend have reversed over the past several years [as both are now, more or less, on top of one another].
-
One thing you have to wonder about is what is going on behind the scenes. I know a little while back, Elon Musk said he was more worried about CO2 becoming so high that it would be difficult to breathe. But this makes little sense. I was always under the impression that climate impacts would become catastrophic well before we reached those levels of CO2. You have to wonder if the U.S. government doesn't have contingency plans in place for solar radiation management. That comment would only seem to make sense if you believed we could engineer our way out of the temperature rise, but would not be able to withdraw enough carbon to prevent breathing impacts? Given Elon's ties to the U.S. government through SpaceX, you have to wonder if there isn't a plan in place to funnel taxpayer money to SpaceX in exchange for implementation of solar radiation management. In my opinion, we have already accidentally geoengineered our way to a Pliocene climate and seem well on our way to recreating the Eocene or Paleocene, maybe PETM in a bad case. As the U.S. government bureaucracy always has plans for just about every event, you have to assume they know full well how bad things really are. I mean they are blabbing on about a 2.5% chance of an asteroid hitting in 2032 and possibly needing to divert its course. Given how corrupt our government is (and I think people on both sides of the political aisle would agree with that statement), you have to wonder if there's really even an asteroid in danger of striking earth - or if it's not just another scheme to funnel taxpayer money to SpaceX to blow up a fake asteroid.
-
Pittsburgh/Western PA Winter 2024-2025 Thread
TheClimateChanger replied to Rd9108's topic in Upstate New York/Pennsylvania
Overall, you can't complain about how this worked out. Last week, it looked as though Chicago and Detroit were going to get lots of snow from this, and then the East Coast was going to get hammered by a blizzard later this week. In fact, Chicago saw little snowfall and Pittsburgh wound up with more snow than Detroit (although the first wave, of course, melted off here). And the East Coast is not getting a blizzard. -
Pittsburgh/Western PA Winter 2024-2025 Thread
TheClimateChanger replied to Rd9108's topic in Upstate New York/Pennsylvania
Was the report from 7 pm for sure? Technically, it is possible for it to snow but not result in any additional accumulation if the earlier report was an interim report. Snowfall guidelines say the accumulation is the maximum depth on the snow board in the 6-hour period. So, it could be possible that the depth was 2.6" on the snow board and additional snow fell over the six-hour period but the depth never exceeded 2.6" until the snow board was cleared due to compaction of the earlier fallen snow. Also, as you noted, snowfall and snow depth are recorded at the NWS office, which is close to the airport but not on the airport grounds. -
Pittsburgh/Western PA Winter 2024-2025 Thread
TheClimateChanger replied to Rd9108's topic in Upstate New York/Pennsylvania
I think the 3.5" was the total from the NWS. They reported 2.6" on the 16th, and then 0.9" on the 17th, so that would line up with the 24-hour report of 3.5" as of 7 am yesterday. -
I do wonder if even some of these warmer Pleistocene interglacials might have had surprisingly feisty mid-latitude winters given what I'm learning about precession and Milankovitch cycles which have driven these period glaciations. I know I previously commented about someone who, obviously falsely, suggested DC might have had centuries of poor winters during the Medieval period, but even these interglacials might have presented with more pronounced seasonality than the modern climate. Many of the proxies (ice core, tree rings) would be picking up more heavily on the warmer summers. I think the PETM might be a better analog for future climate, as that seems to be a period of higher GHG concentration. GHG warming would differ in many ways from natural cyclical warming. If concentrations of carbon dioxide approach PETM levels, can somebody explain why we wouldn't see PETM climatic conditions? Surely the configuration of the continents haven't changed that much over that time frame? And the sun's luminosity should have slightly increased relative to what it was during the early Eocene? Obviously, one difference is during the PETM, there was significantly less polar ice coverage prior to its onset. But over the coming millenia, one would expect this impact to lessen. Delayed, but not denied.
-
I do wonder if some of these observations of natural warm periods weren't influenced by the progression of the earth's axial tilt and seasonal precession. Looking back in history, the Holocene Climatic Optimum (c. 6kya) would have occurred during a time when the earth's axial tilt was very near its maximal value, which I think occurred around 10kya. Further, perihelion would have occurred during the summertime or early autumn in the Northern Hemisphere, as opposed to its occurrence during wintertime in recent centuries. These would have led to warming, but with a significant seasonal and Hemispheric variation. The Southern Hemisphere would not have warmed as much, although the albedo effects of the melting of snow and ice would likely cause net warming. Summers would be expected to be longer and hotter in the Northern Hemisphere, promoting ice and snow melt. However, winters could still have been surprisingly feisty even into the mid-latitudes as the earth would have been tilted further away from the sun and the distance of the earth to the sun would have been greater in that era. During the early Roman period (c. 2.5kya), the axial tilt would have declined significantly but still have been greater than today. I believe perihelion would have occurred in or around November. So I wonder if it was simply a case of summers being comparable to modern times, but winters being much harsher? It seems to me the climate should naturally be cooling overall over the past several millenia, with perihelion being aligned so closely to the winter solstice and with the earth's axial tilt gradually decreasing over time.
-
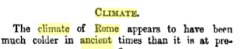
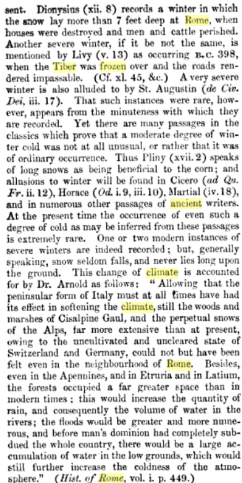
Looking at the ancient reports, it would appear the Roman winter was harsher than our own and even appearing harsh to scientists living in the tail end of the so-called Little Ice Age. It is reported that snow once settled to a depth of seven feet, and on another occasion, snow laid on the ground for fully 40 days in Rome. There are several recorded instances of the Tiber at Rome freezing solid. Now, it's true some of these predate the so-called Roman Warm Period; however, some of the reports overlap. Wikipedia cites 250BC-400AD as the timeframe for the warm period. Curiously, it looks like this period was first characterized in 1995 and popularized in Nature in 1999. Wikipedia claims it was a "regional" phenomenon, but it's curious that just before this "regional" phenomenon, records from the same region are suggestive of a colder climate - at least during the winter. The phrase "Roman Warm Period" first appears in a 1995 doctoral thesis.[5] It was popularized by an article published in Nature in 1999.[6] More recent research, including a 2019 analysis based on a much larger dataset of climate proxies, has found that the putative period, along with other warmer or colder pre-industrial periods such as the "Little Ice Age" and "Medieval Warm Period," were regional phenomena, not globally-coherent episodes.[7] That analysis uses the temperature record of the last 2,000 years dataset compiled by the PAGES 2k Consortium 2017.[7] Roman Warm Period - Wikipedia
-
Throughout the entire Roman Kingdom and the Republic there was the so-called Subatlantic period, in which the Greek and Etruscan city-states also developed.[7] It was characterized by cool summers and mild, rainy winters.[7] At the same time there were a number of drastic winters, including the complete freezing of the Tiber in 398 BC, 396 BC, 271 BC and 177 BC.[8] In subsequent centuries the reports of occasional harsh winters became associated with flooding rather than ice on the Tiber.[8] Evidence for a cooler Mediterranean climate in 600 BC–100 BC comes from remains of ancient harbors at Naples and in the Adriatic which are located about one meter below current water level. Edward Gibbon, citing ancient sources, thought that the Rhine and the Danube were frequently frozen, facilitating the invasion of barbarian armies into the Empire "over a vast and solid bridge of ice".[9] Suggesting colder climate, Gibbon also contended that during Caesar's time reindeer were commonly found in the forests of modern Poland and Germany, whereas in his time reindeer were not observed south of the Baltic.[9] During the reign of Augustus the climate became warmer and the aridity in North Africa persisted.[10] The biotopes of Heterogaster urticae, which in Roman times occurred farther north than in the 1950s, suggest that in the early Empire mean July temperatures were at least 1 °C above those of the mid-20th-century.[3] Pliny the Younger wrote that wine and olives were cultivated in more northerly parts of Italy than in the previous centuries,[4] as did Saserna in the last century BC (both father and son).[8] Climate of ancient Rome - Wikipedia
-
More on the so-called Roman Warm Period. This excerpt from William Henry Dyer's Ancient Rome (1864).
-
But on your point, Sam Carana of Arctic News had previously made a good point that total warming may actually already be on the order of 2.3C if we include these preindustrial climate impacts. The total warming is dependent on the choice of baseline, but it should be evident that humanity has been altering the climate for a considerable amount of time prior to the Industrial Revolution. Obviously, the magnitude of such changes pale in comparison to those of the most recent 100 or 150 years; however, they are still very notable compared to natural variations. Arctic News: pre-industrial
-
I was thinking more on the lines of this study: Reassessment of pre-industrial fire emissions strongly affects anthropogenic aerosol forcing | Nature Communications Abstract Uncertainty in pre-industrial natural aerosol emissions is a major component of the overall uncertainty in the radiative forcing of climate. Improved characterisation of natural emissions and their radiative effects can therefore increase the accuracy of global climate model projections. Here we show that revised assumptions about pre-industrial fire activity result in significantly increased aerosol concentrations in the pre-industrial atmosphere. Revised global model simulations predict a 35% reduction in the calculated global mean cloud albedo forcing over the Industrial Era (1750–2000 CE) compared to estimates using emissions data from the Sixth Coupled Model Intercomparison Project. An estimated upper limit to pre-industrial fire emissions results in a much greater (91%) reduction in forcing. When compared to 26 other uncertain parameters or inputs in our model, pre-industrial fire emissions are by far the single largest source of uncertainty in pre-industrial aerosol concentrations, and hence in our understanding of the magnitude of the historical radiative forcing due to anthropogenic aerosol emissions.
-
Note that millions of acres of rangeland would burn each and every year. Late summer until the start of winter were clearly very hazy, smoky periods in the past. Even if this was mostly a seasonal phenomenon, it may be possible that aerosols emitted in this time frame have a greater climate impact than aerosols emitted at other times during the calendar year. Perhaps leading to autumn cooling and an earlier start to winter (more ice and snow). So our modeling simply looking at total emissions of aerosols might also be overlooking the fact that not all emissions are equal, and that emissions during the summer and fall are much more impactful on the global climate.
-
I think we also need to consider the possibility that our estimates for aerosol forcing are incorrect relative to preindustrial, before claiming instead that our estimate of climate sensitivity to carbon dioxide is incorrect. It seems like it was a very smoky, dusty time. Is it not possible that the globally averaged sky is now clearer than it was in the preindustrial times, and that aerosols have shifted from a cooling effect to a warming effect? If this is possible, then, it would not just be unmasking greenhouse warming but also directly contributing (that is, causing) warming relative to preindustrial in recent decades. The question to consider - are human changes in fire suppression and land management perhaps now outweighing human pollution in recent decades? With also a possibility that natural changes set on by warming are contributing... for instance, Sahara dust is predicted to decrease in response to warming. Has that already commenced relative to preindustrial?
-
Fall/Winter '24 Banter and Complaints Go Here
TheClimateChanger replied to IWXwx's topic in Lakes/Ohio Valley
Gotta love the 19th century woman trudging through the Blizzard of 1899 icon for 30F. -
74 mph winds observed at Elkins Airport. Severe Thunderstorm Warning WVC077-093-161830- /O.NEW.KPBZ.SV.W.0001.250216T1800Z-250216T1830Z/ BULLETIN - IMMEDIATE BROADCAST REQUESTED Severe Thunderstorm Warning National Weather Service Pittsburgh PA 100 PM EST Sun Feb 16 2025 The National Weather Service in Pittsburgh has issued a * Severe Thunderstorm Warning for... Southeastern Preston County in northeastern West Virginia... North Central Tucker County in northeastern West Virginia... * Until 130 PM EST. * At 100 PM EST, a severe thunderstorm was located over Rowlesburg, moving northeast at 50 mph. HAZARD...70 mph wind gusts. SOURCE...Radar indicated. A 74 mph wind gust was reported at Elkins, WV IMPACT...Expect considerable tree damage. Damage is likely to mobile homes, roofs, and outbuildings. * Locations impacted include... Kingwood, Terra Alta, Rowlesburg, Albright, Tunnelton, Aurora, Cathedral State Park, Elgon and Cranesville. PRECAUTIONARY/PREPAREDNESS ACTIONS... Anyone outdoors should move to shelter inside a well-built structure and stay away from windows. This storm is capable of producing widespread damaging winds. && LAT...LON 3927 7969 3944 7980 3960 7950 3940 7948 3935 7948 3934 7949 3929 7949 3922 7965 TIME...MOT...LOC 1759Z 239DEG 44KT 3932 7967 THUNDERSTORM DAMAGE THREAT...CONSIDERABLE HAIL THREAT...RADAR INDICATED MAX HAIL SIZE...0.00 IN WIND THREAT...RADAR INDICATED MAX WIND GUST...70 MPH $$ McMullen
- 140 replies
-
- 4
-

-
- severe
- thunderstorms
- (and 2 more)