

TheClimateChanger
-
Posts
3,065 -
Joined
-
Last visited
Content Type
Profiles
Blogs
Forums
American Weather
Media Demo
Store
Gallery
Everything posted by TheClimateChanger
-
Central PA Autumn 2024
TheClimateChanger replied to Itstrainingtime's topic in Upstate New York/Pennsylvania
000CDUS41 KCTP 142120CLIBFDCLIMATE REPORT NATIONAL WEATHER SERVICE STATE COLLEGE PA520 PM EDT SAT SEP 14 2024......................................THE BRADFORD CLIMATE SUMMARY FOR SEPTEMBER 14 2024...VALID TODAY AS OF 0500 PM LOCAL TIME.CLIMATE NORMAL PERIOD 1991 TO 2020CLIMATE RECORD PERIOD 1957 TO 2024WEATHER ITEM OBSERVED TIME RECORD YEAR NORMAL DEPARTURE LAST VALUE (LST) VALUE VALUE FROM YEAR NORMAL ...................................................................TEMPERATURE (F) TODAY MAXIMUM 81R 359 PM 81 1991 71 10 67 MINIMUM 50 613 AM 27 1985 48 2 43 AVERAGE 66 60 6 55 PRECIPITATION (IN) TODAY 0.00 1.09 1980 0.12 -0.12 0.00 MONTH TO DATE 2.29 1.65 0.64 1.13 SINCE SEP 1 2.29 1.65 0.64 1.13 SINCE JAN 1 32.15 29.50 2.65 27.32 DEGREE DAYS HEATING TODAY 0 6 -6 10 MONTH TO DATE 65 68 -3 24 SINCE SEP 1 65 68 -3 24 SINCE JUL 1 116 171 -55 55 COOLING TODAY 1 1 0 0 MONTH TO DATE 5 19 -14 55 SINCE SEP 1 5 19 -14 55 SINCE JAN 1 464 272 192 341 ...................................................................WIND (MPH) HIGHEST WIND SPEED 12 HIGHEST WIND DIRECTION E (110) HIGHEST GUST SPEED 17 HIGHEST GUST DIRECTION SE (140) AVERAGE WIND SPEED 2.0 SKY COVER POSSIBLE SUNSHINE MM AVERAGE SKY COVER 0.1 WEATHER CONDITIONS THE FOLLOWING WEATHER WAS RECORDED TODAY. FOG RELATIVE HUMIDITY (PERCENT) HIGHEST 100 200 AM LOWEST 48 100 PM AVERAGE 74 ..........................................................THE BRADFORD CLIMATE NORMALS FOR TOMORROW NORMAL RECORD YEAR MAXIMUM TEMPERATURE (F) 71 85 1991 MINIMUM TEMPERATURE (F) 48 27 1983 SUNRISE AND SUNSET SEPTEMBER 14 2024.....SUNRISE 654 AM EDT SUNSET 725 PM EDT SEPTEMBER 15 2024.....SUNRISE 655 AM EDT SUNSET 723 PM EDT - INDICATES NEGATIVE NUMBERS.R INDICATES RECORD WAS SET OR TIED.MM INDICATES DATA IS MISSING.T INDICATES TRACE AMOUNT.$$ -
Pittsburgh, PA Fall 2024 Thread
TheClimateChanger replied to TheClimateChanger's topic in Upstate New York/Pennsylvania
000SXUS71 KPBZ 142151RERDUJRECORD EVENT REPORTNATIONAL WEATHER SERVICE PITTSBURGH PA0549 PM EDT SAT SEP 14 2024...RECORD HIGH TEMPERATURE SET AT DUBOIS PA...A RECORD HIGH TEMPERATURE OF 82 DEGREES WAS SET AT DUBOIS PA TODAY.THIS TIES THE OLD RECORD OF 82 DEGREES SET IN 2005.$$MILCAREK -
Central PA Autumn 2024
TheClimateChanger replied to Itstrainingtime's topic in Upstate New York/Pennsylvania
000SXUS71 KPBZ 142151RERDUJRECORD EVENT REPORTNATIONAL WEATHER SERVICE PITTSBURGH PA0549 PM EDT SAT SEP 14 2024...RECORD HIGH TEMPERATURE SET AT DUBOIS PA...A RECORD HIGH TEMPERATURE OF 82 DEGREES WAS SET AT DUBOIS PA TODAY.THIS TIES THE OLD RECORD OF 82 DEGREES SET IN 2005.$$MILCAREK -
The 1971-2000 normal and 1981-2010 normal for BWI for the month of December was 36.7F. The mean for those periods was 37.7F and 37.3F, respectively, but the normal appears to have been adjusted downward to account for changes in equipment. 2016 2008 2007 2004


-
2004, 2007, 2008, and 2016 were all warmer than normal based on the normals in place at the time [some by fairly substantial margins]. They jacked up what's considered "normal" at BWI in December by nearly 2F in 2021.
-
Pittsburgh, PA Fall 2024 Thread
TheClimateChanger replied to TheClimateChanger's topic in Upstate New York/Pennsylvania
PIT is 1.6F below normal through the 12th, but the next several days should get us back to normal [or above]. The 6-10 day and 8-14 day outlooks from yesterday look like an inferno for most of the eastern US, so we should be well-positioned for another warmer than normal month. -
Central PA Autumn 2024
TheClimateChanger replied to Itstrainingtime's topic in Upstate New York/Pennsylvania
I'm just repeating what others have told me about only the maximum temperatures counting. Take it up with them. -
Central PA Autumn 2024
TheClimateChanger replied to Itstrainingtime's topic in Upstate New York/Pennsylvania
I was told only daytime maxima count in the warm season here, and those are currently 3F below normal, and should come in above normal for the next several days at a minimum. By contrast, lows are nearly 7F below normal. The drought and unusually low humidity is clearly enhancing the negative departures through anomalous diurnal ranges. -
Occasional Thoughts on Climate Change
TheClimateChanger replied to donsutherland1's topic in Climate Change
Summer 2024 finished in fourth place nationally behind 1936, 2021 & 2022. -
Occasional Thoughts on Climate Change
TheClimateChanger replied to donsutherland1's topic in Climate Change
I mean just compare the last two decades of U.S. CRN data and/or US48 satellite derived data (you can even use the latter back to 1979) - neither of which is subject to any TOBs adjustment - to Martz's "raw" data. It's nonsense. -
Occasional Thoughts on Climate Change
TheClimateChanger replied to donsutherland1's topic in Climate Change
I don't even believe Martz's graphic is accurate. There's no way even the raw data would show 2019 as one of the coldest years. A so-called meteorology student really wants to claim 2019 was colder than the late 70s or some of the other historically cold years in the 19th century and early 20th century. Where was the feet of snow, days and days of below zero weather, etc.? What a joke! I don't even need a thermometer to tell me that's a load of bullcrap. 2019 wasn't even close to the coldest of that decade - years like 2014 & 2015 were obviously colder, which is what the actual data shows. Moreover, deniers used to say in the 1990s and early 2000s, that we were in a warm cycle comparable to the 1930s to 1950s, and it would soon start cooling. Obviously, it has instead continued to warm. But what even was the point of that discussion if that era was actually not warm and instead about the same as the so-called "cold cycle" in the late 1950s to 1980 era? It's laughably stupid. I suspect there's something else going on in that chart - not just TOBs. Like not factoring in station changes [location, elevation, makeup] and/or not properly gridding the data, but instead just taking a mean of whatever station data is available. -
Occasional Thoughts on Climate Change
TheClimateChanger replied to donsutherland1's topic in Climate Change
Martz has previously said the observers were "smart off" to reset the high temperature on the following day. But apparently they weren't smart enough to follow instructions and conform to the observational standards that were in place at the time. -
Correct me if I'm wrong, but unless current warming is outside of the range of modeled projections, there's no need to consider any of these other factors and the warming can be fully explained by greenhouse gas emissions [and other factors already considered in the modeling].
-
September 2024 General Discussion
TheClimateChanger replied to Geoboy645's topic in Lakes/Ohio Valley
Probably the only thing stopping a third consecutive year of record low gauge heights on the lower Mississippi. Currently forecast to approach -9 feet at Memphis (which is where the data below is from).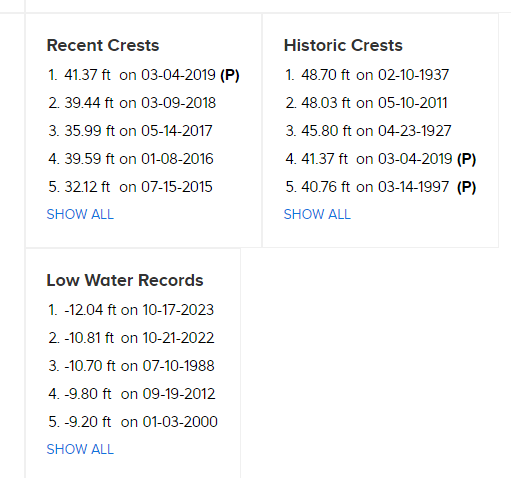
-
Central Pa. Summer 2024
TheClimateChanger replied to mahantango#1's topic in Upstate New York/Pennsylvania
Using 0C/32F, the only areas from 1991-2020 that would qualify as subtropical would be the Philadelphia metro area. Minimum monthly average is 34.0F at PHL and 33.4F at PNE. Also, some areas right along the Mason-Dixon line would qualify marginally. At HGR [Hagerstown, Md.], minimum average monthly temperature is 32.0F and at MGW [Morgantown, W. Va.] 32.1F. Using data from the past 15 years, however, additional areas would qualify, including parts of the Harrisburg area. Average monthly minimum (2010-2024) is 31.5F at MDT, but 32.3F at CXY. So right on the border of continental and subtropical climates, as defined by Koppen, in parts of the Susquehanna Valley over the past 15 years. -
Central Pa. Summer 2024
TheClimateChanger replied to mahantango#1's topic in Upstate New York/Pennsylvania
Only if you use the traditional -3C isotherm for the coldest month as the boundary between subtropical & continental. Typically, 0C is used, especially in North America. -
September 2024 General Discussion
TheClimateChanger replied to Geoboy645's topic in Lakes/Ohio Valley
Latest drought monitor from this morning shows continued expansion of drought conditions across the Ohio Valley. Zanesville has had just 0.88" since July 17, with 0.58" of that falling on July 29. Really only one legitimate chance for rain over the next 10 days there. -
September 2024 General Discussion
TheClimateChanger replied to Geoboy645's topic in Lakes/Ohio Valley
Looks like the cold front moving across the region today and tomorrow should push all of the smoke away for awhile. Perhaps a short window behind the cold front where some smoke can mix down to the surface even across Iowa and Illinois, although concentrations look to stay fairly low so the impact to air quality should be fairly small. -
If you look carefully at the above graphic, you will notice more warming has occurred from the 1990s to today than had occurred from the 1860s to 2000 [or at least a similar degree of warming].
-
For the youngsters today, don't let Dr. Spencer gaslight you into believing the 1990s were unusually cold. The 1990s were the hottest decade of all time at that point in history. Even Dr. Spencer used to argue it was part of some cylical warming trend. He is the most wrong "scientist" of all time. This is how the 1990s used to be displayed when I was growing up: Source: The 1990s was the warmest decade ever recorded instrumentally. The last... | Download Scientific Diagram (researchgate.net)
-
So surreal to see the "warmest decade of all time" [the 1990s - which many of y'all on Wright Weather and later on EasternUsWx.com incorrectly suggested was a "warm cycle" but which I, as a young child, I might add, correctly indicated would be the coldest decade of the rest of your lives] - now appear as frigid cold. I mean it looks colder than the 1800s looked back in the 1990s. Unreal.
-
Pittsburgh, PA Fall 2024 Thread
TheClimateChanger replied to TheClimateChanger's topic in Upstate New York/Pennsylvania
After reviewing the first several posts of the Fall 2023 thread, I can say we are off to a much more fall-like start to September than last year. -
Figured I'd get a fall thread going, now that it's September.
-
Pittsburgh, Pa Summer 2024 Thread.
TheClimateChanger replied to meatwad's topic in Upstate New York/Pennsylvania
Maybe someone needs to get an autumn/fall thread going, now that we are into the month of September? -
Pittsburgh, Pa Summer 2024 Thread.
TheClimateChanger replied to meatwad's topic in Upstate New York/Pennsylvania


