

TheClimateChanger
-
Posts
3,065 -
Joined
-
Last visited
Content Type
Profiles
Blogs
Forums
American Weather
Media Demo
Store
Gallery
Everything posted by TheClimateChanger
-
September 2024 General Discussion
TheClimateChanger replied to Geoboy645's topic in Lakes/Ohio Valley
For context, at Minneapolis, there have been 45 [of 152] Julys with 19 or fewer 80+ days, being nearly 30% of all historic Julys, and 91 [of 152] Augusts with 19 or fewer 80+ days, being nearly 60% of all historic Augusts. On the low end, July 1992 had only 3 such days and August 1912, 6. In the entire meteorological summer of 1904, there were only 19 such days. And July and August each have an extra day on September. And I get a weenie for calling September the newest summer month. Prior to 2000, the ratios are even worse. 43 [of 127] Julys, or more than 1/3 of 18th and 19th century Julys. And 79 [of 127] Augusts, or 62.2% of the time. Sorry but September increasingly holds it own against past Julys and Augusts. Is it breaking down heat records from those months? No. But it is within the historical climatology of those months. -
Occasional Thoughts on Climate Change
TheClimateChanger replied to donsutherland1's topic in Climate Change
Funny, the so-called "skeptics" [i.e., deniers] don't believe recent OBSERVED temperatures, but 100% believe some BS temperature reconstruction of 500 million years ago. What a joke! -
Pittsburgh, PA Fall 2024 Thread
TheClimateChanger replied to TheClimateChanger's topic in Upstate New York/Pennsylvania
September has been another warm month. 16th warmest in the threaded record, but only 2015, 2016 & 2018 have been warmer since 1931. Could vary a bit prior to the end of the month on Monday, but given the current forecast should finish very near the current value of 69.4F.
-
Pittsburgh, PA Fall 2024 Thread
TheClimateChanger replied to TheClimateChanger's topic in Upstate New York/Pennsylvania
And actually 1921 was not particularly warm the last three months of the year. Compared to the current 1991-2020 mean at PIT, October was +0.7F, November +2.1F, and December +0.3F. So only a bit above normal. A very warm October could almost seal up the warmest year on record, barring a major cold outbreak in November or December [because at that point November & December could probably run even slightly below normal and 2024 would still wind up #1].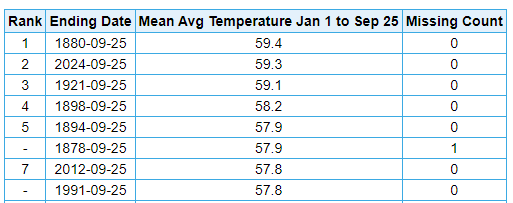
-
Pittsburgh, PA Fall 2024 Thread
TheClimateChanger replied to TheClimateChanger's topic in Upstate New York/Pennsylvania
Also haven't looked at this in a few weeks, but PIT is now just 0.1F below the warmest YTD in the threaded record. Obviously, the older records are from the city station. And the 19th century records seem to have had some sort of warm bias on top of that, particularly in the warm season. But despite any biases, right in the mix for the record warm annual mean temperature. 1880 was not warm for the last 3 months of year so it falls off pretty rapidly. 1921 is actually the current record year in the threaded record, and 2024 has been 0.2F above that year to date.
-
Pittsburgh, PA Fall 2024 Thread
TheClimateChanger replied to TheClimateChanger's topic in Upstate New York/Pennsylvania
If October, the Euro AIFS has a pretty warm looking pattern across the eastern U.S. after a cooler start to the month behind Helene. CPC agrees with increased odds of warmer than normal almost coast to coast. Not sure it will be a blowtorch, but I think odds are certainly in favor of another at least somewhat warmer than normal month. -
Pittsburgh, PA Fall 2024 Thread
TheClimateChanger replied to TheClimateChanger's topic in Upstate New York/Pennsylvania
I don't know what the weather app was looking at. There hasn't been a day within 5F of normal since the 11th. Looks like we may see a few seasonable or somewhat cooler than normal days as we head into early October, behind Helene's remnants. -
Pittsburgh, PA Fall 2024 Thread
TheClimateChanger replied to TheClimateChanger's topic in Upstate New York/Pennsylvania
September? Considering its 3.5F above normal, it's going to be closer to +5F than normal. Or was this meant to ask about the upcoming October? -
September 2024 General Discussion
TheClimateChanger replied to Geoboy645's topic in Lakes/Ohio Valley
Dayton has had 25 days of 90F or better temperatures this year. At the airport site, only 19 years [in 90 years of records] had more. Not a bad number. Would only be expected to be exceeded in about 1 of every 4 to 5 years based on historical records. No doubt being situated at 1,000+ feet helps keep these down. The 49 observed at Hamilton (Butler County) [elevation: 600 feet] is probably more representative of the conditions in the city of Dayton and the Miami River valley.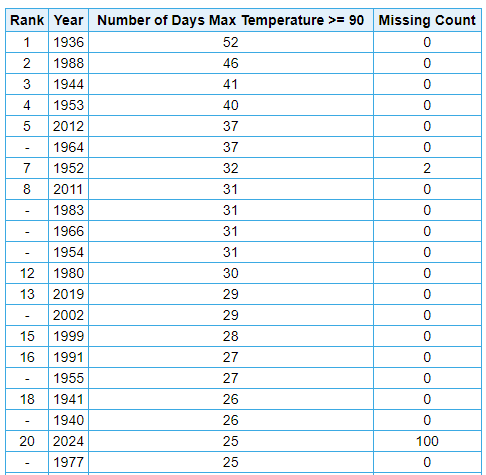
-
September 2024 General Discussion
TheClimateChanger replied to Geoboy645's topic in Lakes/Ohio Valley
Similar story in Chicagoland, where the mean high temperature has been the 5th warmest in the threaded record.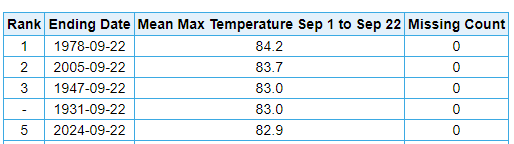
-
September 2024 General Discussion
TheClimateChanger replied to Geoboy645's topic in Lakes/Ohio Valley
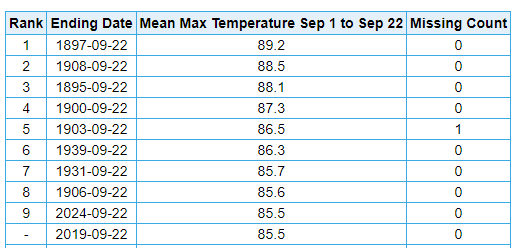
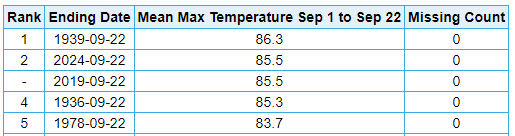
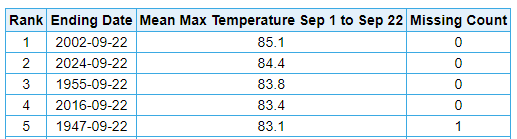
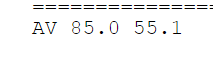
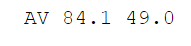
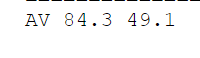
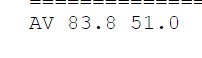
September off to an absolutely scorching start in the Ohio Valley. Really living up to its billing as the new summer month. The first 22 days of the month have been warmer than the vast majority of Julys based on average high temperature! Columbus, Ohio Dayton, Ohio Threaded Record: At the airport site: Findlay, Ohio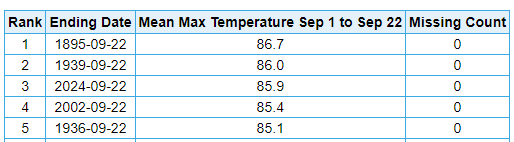
-
Occasional Thoughts on Climate Change
TheClimateChanger replied to donsutherland1's topic in Climate Change
Really helps to highlight the dirty little secret that nobody is allowed to utter. Contrary to "The Narrative" (TM), NOAA's temperature data consistently WARMS the PAST and COOLS the PRESENT when it comes to the highest quality stations - i.e., WBAN stations that have always observed on midnight-to-midnight days and have always been manned by meteorologists and/or trained observers from the army or navy. Too frequently this is hand-waved away by claiming it's due to the urban heat island effect due to these stations typically [but not always] being located in or near cities. Just look at the Del Rio graph. They tacked on 2F or more to all the early data - the handful of years in the early 1950s, and even into the colder summers in the 1970s - despite all of the data from the 1960s and 1970s being from the same location. And as @donsutherland1points out there's little evidence of explosive growth and urbanization driving these trends. So, what is the reason for the adjustments? I suspect it's largely due to pairwise homogenization, which is fine and dandy. But isn't a serious problem when a subset of the data (WBAN data) - and I would argue the superior quality data - has a trend that substantially deviates from the whole of the data? -
September 2024 General Discussion
TheClimateChanger replied to Geoboy645's topic in Lakes/Ohio Valley
Running the same analysis at Chicago. The current streak of 80F+ readings is up to 12 days, which is tied for 92nd longest [of any time of the year] and is forecast to reach 13 days [which would be tied for 75th longest at any time of the year]. As far as September is concerned at Chicago. The latest streaks of 10 or more days at or above 80F are: 13 days, ending 9/13/2005 [being the last 13 days of a 20-day streak]; 12 days, ending 9/15/1978; and 10 days, ending 9/17/1952, 9/10/2002 [last 10 days of a 12-day streak] and 9/10/1971 [last 10 days of a 13-day streak]. 34 days, ending 9/6/1995 [4th longest of all time] 24 days, ending 9/5/1983 [14th longest of all time] 20 days, ending 9/13/2005 20 days, ending 9/6/1980 19 days, ending 9/8/1960 15 days, ending 9/3/1953 13 days, ending 9/10/1971 12 days, ending 9/20/2024 [ongoing] 12 days, ending 9/10/2002 12 days, ending 9/15/1978 12 days, ending 9/5/1973 12 days, ending 9/4/1889 11 days, ending 9/8/1996 11 days, ending 9/1/1969 11 days, ending 9/4/1937 10 days, ending 9/4/1966 10 days, ending 9/3/1961 10 days, ending 9/17/1952 10 days, ending 9/9/1922 -
September 2024 General Discussion
TheClimateChanger replied to Geoboy645's topic in Lakes/Ohio Valley
The streak at Detroit is up to 12 days now, and is forecast to reach 14 days. 12 days matches the 120th longest streak of 80F+ max temps of all time [at any time of the year]. Should this streak reach 14 days, there have only been 88 streaks longer than that in the threaded record. The vast majority of 80+ streaks of 10 or more days occurred in meteorological summer, particularly July and/or August. Of all streaks of 10 or more days of 80+, only 19 have extended into and/or occurred entirely within the month of September - the vast majority ending very early on in the month and carrying over from August. The longest streak is 24 days, ending 9/6/1983. Prior to 2024, the longest streak entirely in the month of September is 10 days - being the last 10 days of the 18-day streak ending on 9/10/2002, as well as 10 day streaks ending 9/11/1961, 9/10/1933 and 9/11/1884. Prior to 2024, there are no instances of a streak of 10 or more days of 80F+ extending later than September 11. Also of note, there are only 19 instances of a streak of 10+ days of 80 or more which has extended into September in the entire threaded record, and two of them have occurred this year. A 10-day streak ended on September 1, 2024, and currently a 12-day streak is ongoing. 24 days, ending 9/6/1983 20 days, ending 9/3/2022 18 days, ending 9/10/2002 17 days, ending 9/7/2012 17 days, ending 9/7/1969 16 days, ending 9/4/1953 16 days, ending 9/8/1881 15 days, ending 9/1/2013 15 days, ending 9/1/1980 13 days, ending 9/6/1973 12 days, ending 9/20/2024 [ongoing] 12 days, ending 9/4/1937 11 days, ending 9/9/2015 10 days, ending 9/1/2024 10 days, ending 9/4/1966 10 days, ending 9/11/1961 10 days, ending 9/10/1933 10 days, ending 9/3/1889 10 days, ending 9/11/1884 -
September vibes - Last 90s for some, 1st frost for others
TheClimateChanger replied to tamarack's topic in New England
Wow, I would’ve thought 84F would be a record up there. What is the record for September 18? -
Fall 2024 Medium/Long Range Discussion
TheClimateChanger replied to madwx's topic in Lakes/Ohio Valley
Those areas should see drought improvement in the update this week due to the rains from Francine. Memphis had 6.52" of rain over the past week. -
Arctic Sea Ice Extent, Area, and Volume
TheClimateChanger replied to ORH_wxman's topic in Climate Change
But everyone on here said the ice would recover and/or we didn't have enough data to opine on the significance of the record ice loss. I said "no, the arctic is in a death spiral." I wonder who was right? -
2024-2025 La Nina
TheClimateChanger replied to George001's topic in Weather Forecasting and Discussion
One confounding factor is that the 3-year running means near the peak of solar activity all encompass notable El Nino events, except for the early 1980s peak (where the El Nino was offset by a couple of years). Perhaps unsurprisingly, the 1980s do not demonstrate the same degree of correlation. As the old maxim goes, correlation does not imply causation. -
Fall 2024 Medium/Long Range Discussion
TheClimateChanger replied to madwx's topic in Lakes/Ohio Valley
Decided to take a look at how these diurnal ranges compare to prior months. Obviously with the caveat that two more weeks are left in the month, so they will probably go down a bit. But at the moment, they would rank among the largest on record at New Philadelphia (records to 1948) and Zanesville (records to 1895). Here are all instances of a 30F+ diurnal range at both sites, with September 2024's data to date highlighted in bold. There has not been a mean monthly diurnal range at or above 30F at either site since June 1988. Note that the old data has somewhat of a bias towards larger diurnal ranges, since the LiG/CRS tends to result in somewhat higher highs and slightly lower lows than modern automated equipment. For cooperative data in the threaded record, a reset time in afternoon would also result in a slightly larger diurnal range since it has a greater positive bias on mean maximum temperature. New Philadelphia October 1963, 36.2F September 2024, 33.0F September 1963, 32.3F October 1964, 31.4F June 1988, 31.3F August 1962, 30.7F July 1965, 30.7F May 1977, 30.7F September 1985, 30.4F Zanesville October 1963, 35.3F May 1941, 34.7F September 1939, 33.6F September 1897, 33.3F October 1938, 32.8F September 2024, 32.7F May 1939, 32.3F October 1964, 32.1F April 1941, 32.0F September 1952, 31.5F October 1953, 31.4F September 1941, 31.2F June 1936, 31.2F May 1936, 31.1F September 1963, 30.5F July 1936, 30.5F September 1908, 30.5F June 1988, 30.4F September 1953, 30.4F August 1899, 30.2F July 1944, 30.1F September 1943, 30.0F
-
Fall 2024 Medium/Long Range Discussion
TheClimateChanger replied to madwx's topic in Lakes/Ohio Valley
But anyways, the thermometer seems to be working fine. High temperatures are right in line with the nearest sites. Low temperatures are higher due to urbanization. Here's September to date: Columbus Int'l Ohio State University Newark, Ohio Lancaster, Ohio Zanesville, Ohio
-
Fall 2024 Medium/Long Range Discussion
TheClimateChanger replied to madwx's topic in Lakes/Ohio Valley
That's not true. Cincinnati is in D1 - moderate drought, while Columbus is in D3 - extreme drought. -
Fall 2024 Medium/Long Range Discussion
TheClimateChanger replied to madwx's topic in Lakes/Ohio Valley
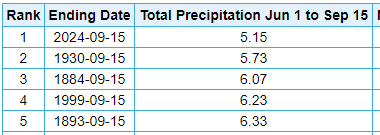
One for the record books. At Columbus, it's been the 5th warmest on record since June 1 (by mean maximum temperature - a better measure of drought stress than average temperature) and easily the driest on record - nearly 0.6" less than the 1930 drought. Mean High Temperature Precipitation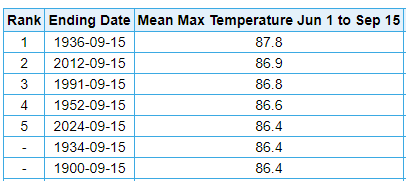
-
Pittsburgh, PA Fall 2024 Thread
TheClimateChanger replied to TheClimateChanger's topic in Upstate New York/Pennsylvania
Latest Op GFS not too enthused on the rainfall this week. -
Pittsburgh, PA Fall 2024 Thread
TheClimateChanger replied to TheClimateChanger's topic in Upstate New York/Pennsylvania
-
Central PA Autumn 2024
TheClimateChanger replied to Itstrainingtime's topic in Upstate New York/Pennsylvania
Should be another record or near record high at the Jefferson County Airport. Current record appears to be 82F, set in 1970.


