TheClimateChanger
-
Posts
3,065 -
Joined
-
Last visited
Content Type
Profiles
Blogs
Forums
American Weather
Media Demo
Store
Gallery
Everything posted by TheClimateChanger
-
@donsutherland1 - it is curious how this "urban heat island" effect suddenly appeared in Phoenix after 2019, which I pointed out is when 3 of 5 years saw 20+ days more of 110+ afternoons than any prior year. I wonder how the proponents of this "urban heat island" theory rectify their theory with the actual data? Surely, Phoenix has been a very large American city for decades at this point. Why was something like this never observed before 2020? Almost like there's something else going on here.
-
New England 2024 Warm Season Banter
TheClimateChanger replied to HoarfrostHubb's topic in New England
Muh urban heat island effect. All I'm saying Tip is if you had told the people of Washington D.C. 100-odd years ago that places high up in the mountains where 70-80 inches of snow fall each winter would, in the not-so-distant future, have warmer warmers than subtropical Washington, they'd have you locked up in the lunatic asylum. Downtown D.C. winter mean (1871-72 to 1903-1904) Elkins, West Virginia winter means (2015-16 to 2023-24), elev. ~2,000 feet, city pop. ~6,900 and Randolph County pop. ~27,800
-
Not trying to clutter anything. Just sharing some interesting statistics to be on the lookout for as we progress through the month of October.
-
Not good numbers for the snowpack retention crew. Going to be exceptionally hard to retain snowpack with only a week or two of days at or below freezing.
-
Another way of looking at this equitable climate is to consider the number of days with a max temperature of at least 70F, but less than 85F (i.e, within the range of 70-84F). The current record is 125 days, set in 2023 & 2024. There will be several more opportunities for such days this year, so Detroit should surpass 2023's sum. The pre-2023 record is 121 days from 1960, 2000, and 2004.
-
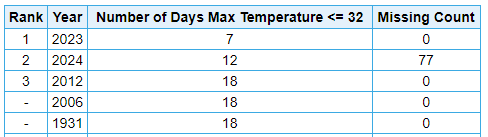
It will also be interesting to see how many days with max temperatures at or below freezing occur at Detroit prior to January 1, 2025. Currently, there have been 12 such days, which is the second least on record behind 2023 (7). What's insane about this statistic is that there have only been 19 days since January 1, 2023, where the max failed to reach 33F. Prior to 2023, the record for a single year was only 1 less than that (18, set in 2012, 2006 & 1931). "We do a lot of firsts. Let me tell you folks, we do a lot of firsts." - Donald J. Trump
-
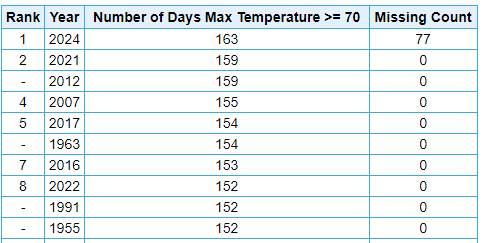
With 77 days left in the year, here's how 2024 ranks at Detroit for various temperature levels [down to 65F, won't go lower since there's likely to be a number of days in the 50-65F before the end of the year, so the rankings would be misleading at this point]. As noted, the record has already been set for 70+ days. If we can manage 2 more 75F days, we can tie that record too. I suspect the record for 65+ days may fall as well, and 60F+ is in play too. At higher levels of heat, sums are above the long-term medians, but not super high. It looks like Detroit is seeing a more equitable climate than in the past, as most of these moderately warm day records have been set in recent years. 95+: 2 days [tied 44th most] 90+: 14 days [tied 44th most] 85+: 38 days [tied 53rd most] 80+: 97 days [tied 5th most] 75+: 129 days [tied 2nd most] 70+: 163 days [record] 65+: 178 days [tied 7th most]
-
Upcoming pattern looks conducive for 2024 to tack on some more 70+ days to pad the record-breaking amount observed at Detroit. It seems likely the record is broken by more than an excess of one week over the former record of 159 days set in 2021 & 2012. "We do a lot of firsts. Let me tell you folks, we do a lot of firsts." - Donald J. Trump
-
Pittsburgh, PA Fall 2024 Thread
TheClimateChanger replied to TheClimateChanger's topic in Upstate New York/Pennsylvania
Lake effect saving us from frost and possible freeze. Looks like Thursday night and possibly Friday night are the best chances for frost. It doesn't look like a widespread freeze, but outlying areas - especially valley locations - could see subfreezing conditions on one or more mornings. At PIT, 7 of the last 9 days have been cooler than the current normals, but we are still nearly 2F above normal overall for the month. Looks like we'll tack on at least a couple/few more below normal days, which could bring us down to near seasonal averages before a warming trend commences. -
For the visual folks: What I find most startling here is the record before 2020 was 33 days [and even those were fairly recent]. Three of the last 5 summers have beaten the pre-2020 record by 20 or more days! "We do a lot of firsts. Let me tell you folks, we do a lot of firsts." - Donald J. Trump
-
Central PA Autumn 2024
TheClimateChanger replied to Itstrainingtime's topic in Upstate New York/Pennsylvania
Bro, it's 50 degrees in Clearfield. I'm betting that was graupel. -
Central PA Autumn 2024
TheClimateChanger replied to Itstrainingtime's topic in Upstate New York/Pennsylvania
Will be interesting to see if Harrisburg can pick up any additional days with a maximum temperature at or below freezing. Currently, at six on the year following last year's 1. So that's 7 days in two years. What I find fascinating is there were only 9 single years with 7 or fewer such days prior to 2023. And now it's approaching two full years with that many days. Wild. It's like former President Trump said at his Butler rally on October 5, "we do a lot of firsts. Let me tell you folks, we do a lot of firsts."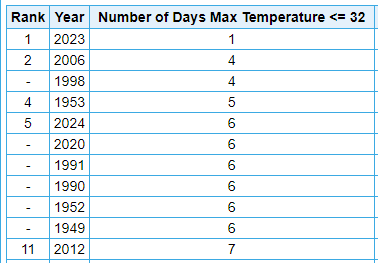
-
Occasional Thoughts on Climate Change
TheClimateChanger replied to donsutherland1's topic in Climate Change
I mean this level of gaslighting is nothing short of incredible. Do these people realize some of us were living in this era? It was almost uncontested on both sides of the so-called debate that the 1980s and 1990s were unusually warm. The debate was largely centered on the extent to which that was attributable to the greenhouse effect, or to natural and cyclical changes. A secondary corollary was the degree to which the warming was attributable to other, non-large scale changes, such us urbanization and the expansion of urban heat islands. Related to that, there was some "debate" as to whether - and by how much - temperatures in that era exceeded temperatures in another similar warm period from the 1930s to the early/mid 1950s. But even that facet of the so-called debate took for granted the fact that the 1980s and 1990s was a warm period, simply questioning the extent to which it differed [or exceeded] earlier warm periods. The reality is these satellite records begin right at the beginning of a very warm period, and this was understood and accepted by all (or nearly all) contemporaneous experts regardless of which side of the so-called "debate" they were on. This idea that the 1980s and 1990s were a cold period is a modern invention. Related to this people also always say what was the climate like before 1880 or 1850, etc.? Have these imbeciles never heard of the Little Ice Age? Pretty much everyone accepts the existence of the LIA, regardless of their position on AGW. The instrumental temperature largely begins at a time when temperatures had warmed some - or at least were beginning to warm - coming out of the LIA. It's very likely there's nothing close to this back to 1300 [start of the LIA]. -
Occasional Thoughts on Climate Change
TheClimateChanger replied to donsutherland1's topic in Climate Change
Here is an example. Paul Callahan [@ChescoWx] questions Roger Coppock as to why he begins his analysis in 1980? Obviously, this is complete and utter nonsense. That's when the first satellites carrying MSUs were launched into orbit. But the implication is this is a cherrypicked start date and that the warming trend is amplified because it starts at a cool period. GASLIGHT CITY! The 1980s were a very warm decade overall [read the article I posted above, and THINK!!!!] and the 1990s were considered to be the warmest decade on record - and by a fair margin. Many so-called experts insisted the 1990s and early 2000s were the peak or zenith of a long-term, but cyclical, warming trend, and that temperatures thereafter would fall. In fact, temperatures have risen at a greater rate than ever before since 2010. Not only have these so-called experts been wrong, they have been DEAD WRONG. -
The crazy thing is New Jersey and Pennsylvania are some of the wettest places in the country right now.
-
Occasional Thoughts on Climate Change
TheClimateChanger replied to donsutherland1's topic in Climate Change
Like President Trump said the other day, "We do a lot of firsts. Let me tell you, we do a lot of firsts." Link: Mississippi River's Tower Rock walkable for the 3rd year in a row | ksdk.com -
Occasional Thoughts on Climate Change
TheClimateChanger replied to donsutherland1's topic in Climate Change
We can also see any temperature records that show the 1980s and 1990s as cold are gaslighting us. The 1980s were very warm, as noted in the article. The 1990s were considered to be the warmest decade on record. And so much misinformation. They want us to "trust the experts" and the so-called experts were used to gaslight us with non sequiturs. "The question you have to ask yourself is, if this was the third warmest year in Pittsburgh, what happened to cause the other two" and "[t]he relationship between global warming and temperatures at any particular location is not very strong." Absolute rubbish from someone who should have known better even in that era. The funny thing is there are people here who think it's a government conspiracy or hoax, as if the U.S. government didn't spend decades gaslighting us and ignoring reality.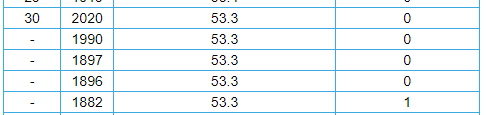
-
Occasional Thoughts on Climate Change
TheClimateChanger replied to donsutherland1's topic in Climate Change
You think that's bad. Get a load of this report from the year prior, in the Pittsburgh Press. What's interesting about this is they ranked the years by departure from the mean at the location in which the temperature was taken, rather than absolute temperature, which helped to somewhat account for the change in location and exposure over the years. Today, they no longer provide any sort of context with these threaded extremes. So whereas 1990 was considered the third warmest year on record in Pittsburgh at the time, today it's only 30th warmest [tied with 4 other years]. Although some of that is attributable to the fact that 6 recent years have been warmer than 1990, and one (2020) matched its annual mean. 2024 will certainly come in warmer, and is more likely than not to set the record for all years [even ignoring the nearly 500' elevation gain and change from heavy urban/rooftop siting to suburban airport setting].
-
Pittsburgh, PA Fall 2024 Thread
TheClimateChanger replied to TheClimateChanger's topic in Upstate New York/Pennsylvania
These statistics for the airport. I did notice an error in my analysis. There was a 3.3" snowfall on February 15, which was the highest daily snowfall so far in 2024. It was also the most since 8.0" fell on March 12, 2022. You are on the edge of the metro area, but have elevation (2000 feet +) so I'm not surprised you saw more snowfall. Not really representative of where the majority of people reside (generally 700' to 1300' ASL). -
Fall/Winter '24 Banter and Complaints Go Here
TheClimateChanger replied to IWXwx's topic in Lakes/Ohio Valley
3519 days since the last calendar day with 6" of snowfall, which is slightly longer than the streak indicated for Cincy (but should be slightly shorter if that one didn't stop counting on September 26). Although, it does claim you had an absolutely astounding 6,335-day drought which ended on February 3, 1948.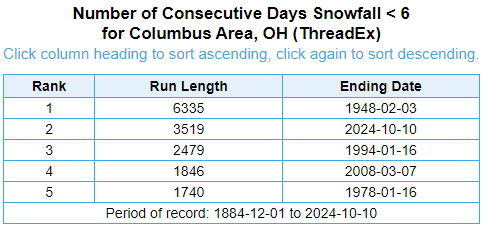
-
Fall/Winter '24 Banter and Complaints Go Here
TheClimateChanger replied to IWXwx's topic in Lakes/Ohio Valley
I was looking up current snowfall drought figures, and for Cincinnati, why does it show an ending date of September 26, 2024? I can assure you there was not 6" of snow on September 27. Hopefully, this nonsense gets resolved.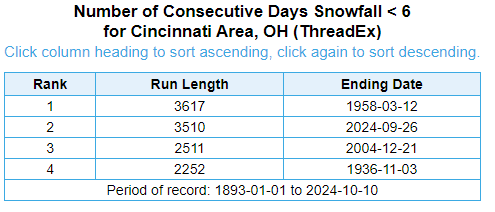
-
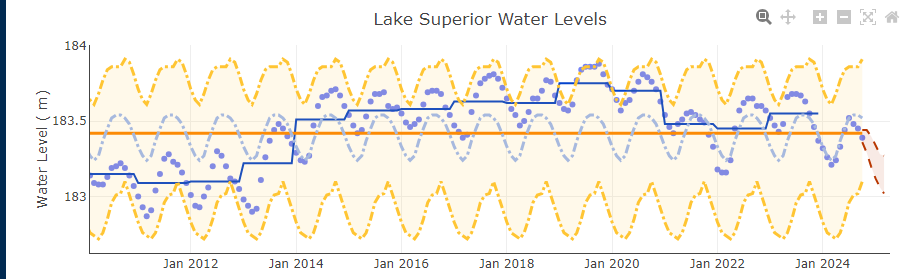
Big change from runs over the past couple weeks, that's for sure. I noticed we are finally starting to see a little movement on the Great Lakes, especially Lake Superior. Forecast calls for levels to continue dropping through March. Note that most precipitation in the Superior Basin is frozen in the winter, so less uncertainty moving forward. The other lakes are more uncertain. Current forecast calls for levels in March to range from 183.02 to 183.27 meters. At the low end, that would approach levels last seen in 2013. Big change from the record high levels of 2019 & 2020. Also note, there's a well-defined seasonality in lake levels, which reach their lowest typically in March or April.
-
Central PA Autumn 2024
TheClimateChanger replied to Itstrainingtime's topic in Upstate New York/Pennsylvania
Absolutely incredible. -
Central PA Autumn 2024
TheClimateChanger replied to Itstrainingtime's topic in Upstate New York/Pennsylvania
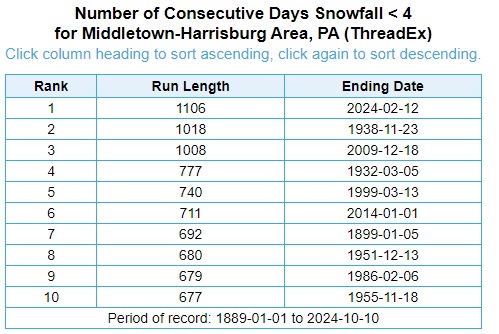
Didn't realize Harrisburg had a 4" snowfall last winter. Must have been one of the few locations to do it. Wow. -
Central PA Autumn 2024
TheClimateChanger replied to Itstrainingtime's topic in Upstate New York/Pennsylvania
Sorry misread that. The record broke in February.