TheClimateChanger
-
Posts
3,065 -
Joined
-
Last visited
Content Type
Profiles
Blogs
Forums
American Weather
Media Demo
Store
Gallery
Everything posted by TheClimateChanger
-
Fall 2024 Medium/Long Range Discussion
TheClimateChanger replied to madwx's topic in Lakes/Ohio Valley
Looking solid, Doc. -
Fall 2024 Medium/Long Range Discussion
TheClimateChanger replied to madwx's topic in Lakes/Ohio Valley
How has this compared to previous months? I noted previously that Zanesville, Ohio had its fifth driest month on record (any month) in August with 0.17 inches, and driest of any month since October 1924. Now just two months later, they may eclipse that figure with just 0.13” so far and looking pretty dry for the next week. -
Occasional Thoughts on Climate Change
TheClimateChanger replied to donsutherland1's topic in Climate Change
Wow - why would they install a weather station on a landfill? -
Occasional Thoughts on Climate Change
TheClimateChanger replied to donsutherland1's topic in Climate Change
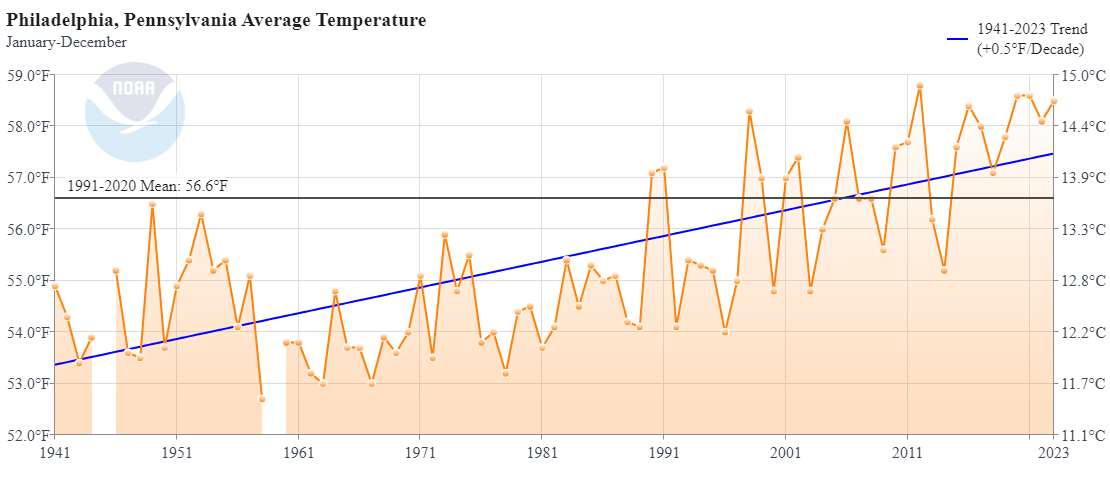
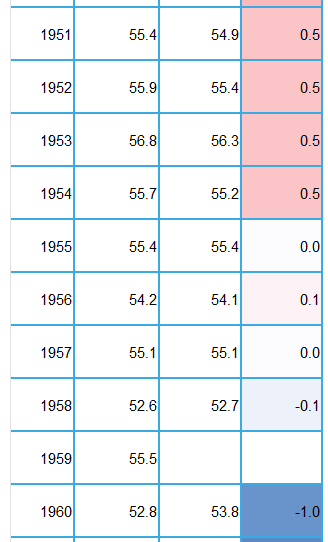
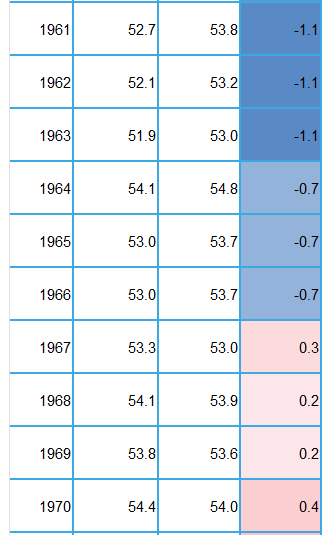
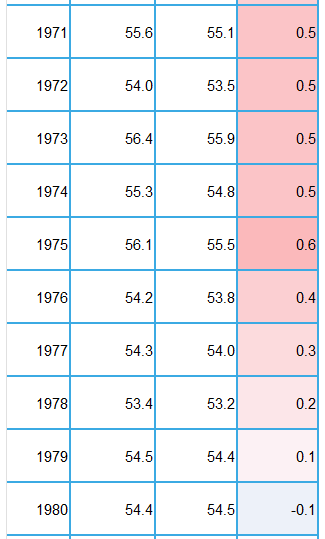
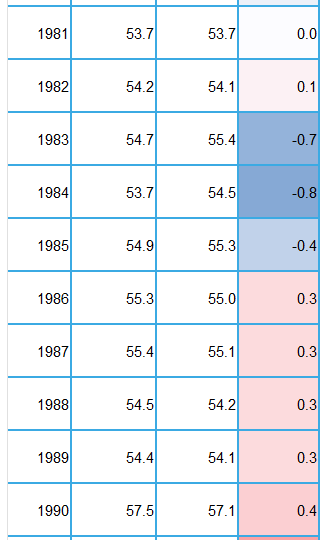
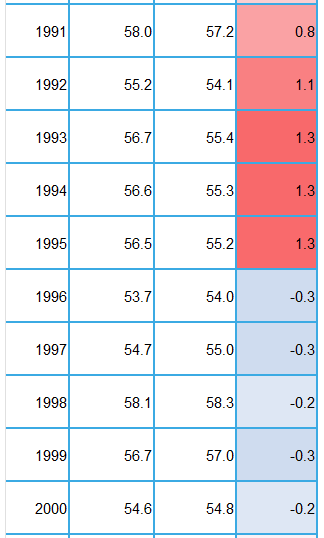
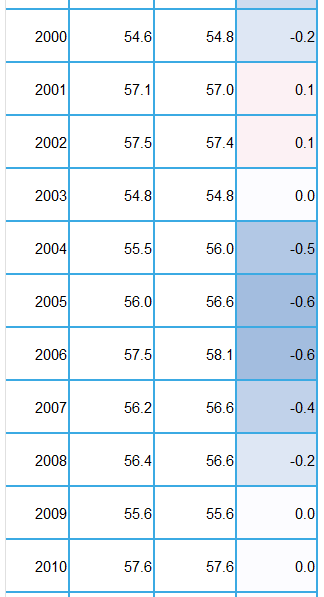
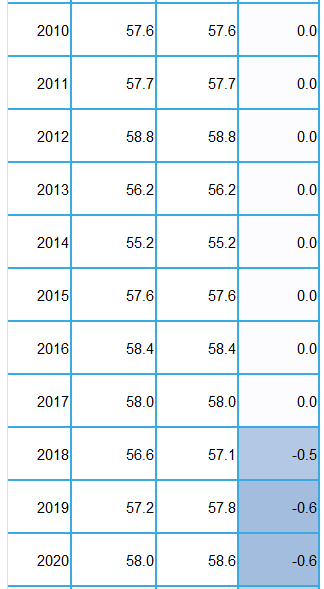
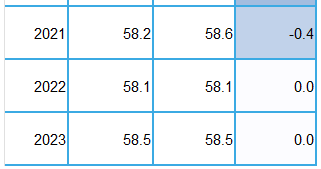
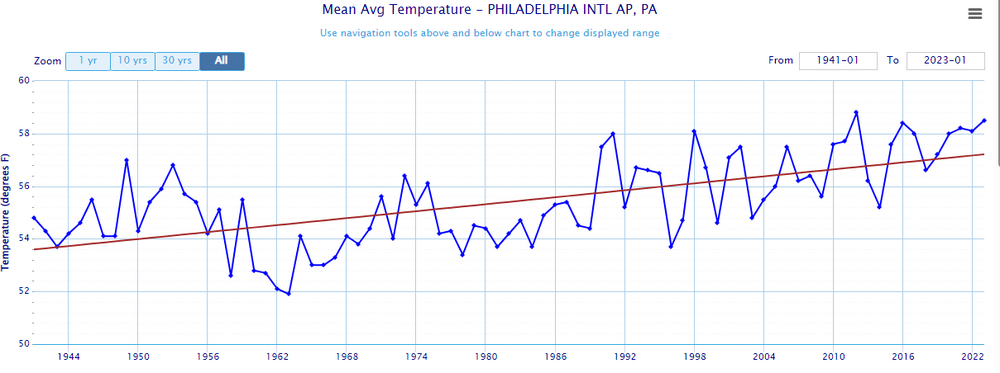
So what we can see is relative to the actual observations, NCEI adjustments generally slightly cooled the 1940s and 1950s. However, beginning in the late 1950s and continuing through the mid 1960s, there is a period where NCEI substantially warmed the actual observations. Thereafter [and continuing through the late 1970s], NCEI adjustments favored a small cooling. In the early 1980s, NCEI adjustments were a general warming of the actual observations. From the mid 1980s through the mid 1990s, there was a significant cooling adjustment. NOTE: This adjustment from 1985-1995 appears to be related to the defective HO-83 hygrothermometer, which produced spuriously high readings in that era at first-order sites. I don't think there's any express adjustment for the instrument, but rather it's adjusted through comparison with other observations. Following the installation of the ASOS in 1996, adjustments have generally been modest with either no change to the data or a small warming adjustment applied. The overall effect of adjustments on the trendline at PHL is small, although it does slightly increase the trend from .441F/decade to .489F/decade. -
Occasional Thoughts on Climate Change
TheClimateChanger replied to donsutherland1's topic in Climate Change
@ChescoWx Red means actual is WARMER than NCEI, and blue means actual is COOLER than NCEI. White means no change. NCEI does not have a value for 1945 or 1959.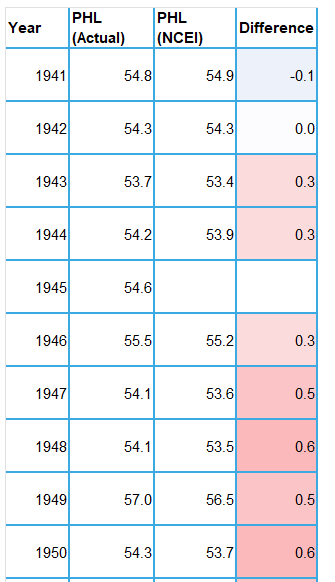
-
Occasional Thoughts on Climate Change
TheClimateChanger replied to donsutherland1's topic in Climate Change
@ChescoWx Here is what NCEI shows for "Filthadelphia." Here is the graph based on actual data: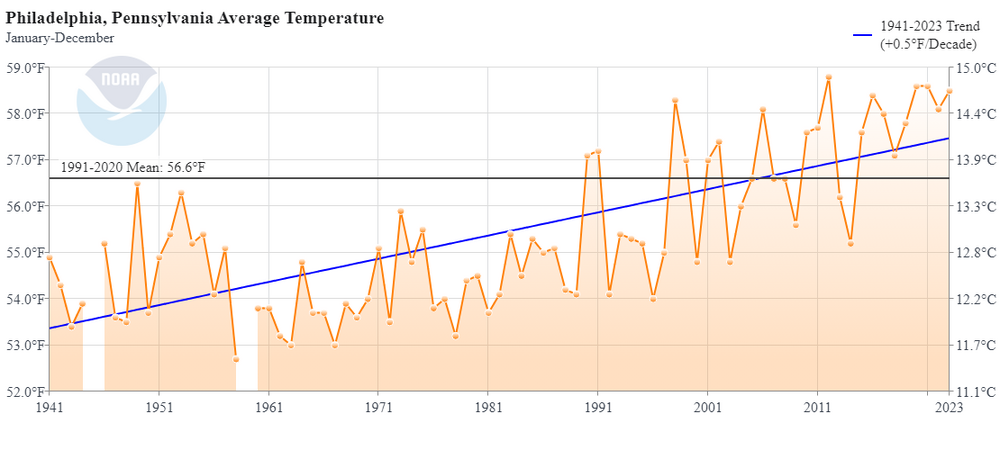
-
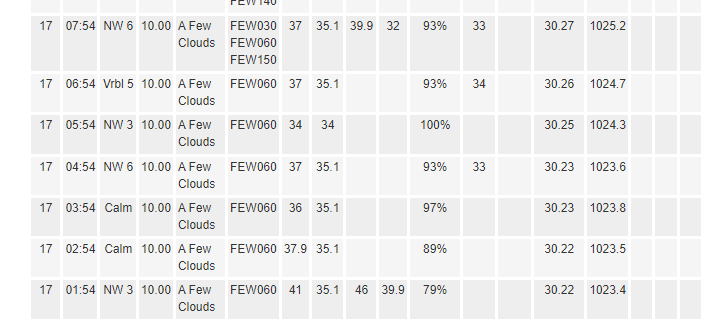
Also, the example posted is from an AWOS, not an ASOS, which tend to be less reliable.
-
Central PA Autumn 2024
TheClimateChanger replied to Itstrainingtime's topic in Upstate New York/Pennsylvania
75 in November and I would have to run the heat in my house to keep it at a comfortable temperature [assuming a chilly overnight]. -
Arctic Sea Ice Extent, Area, and Volume
TheClimateChanger replied to ORH_wxman's topic in Climate Change
Interesting. Was 2012 still the lowest on record on October 18 [I know it was the all-time minimum]? -
Pann is an idiot. Always complaining about the BWI "heat island" - you want to know what temperatures would look like if we continued to measure the old way (i.e., on the rooftop of the Baltimore Commons)? Well I have an idea, let's look at the actual data. They kept that site open until 2000, before retiring it because of how much hotter is was! There were dozens of more days in the 90s and 100s, and with minima above 80F. When you look at the historic records, THIS is what you are looking at. Of course, the source below somehow spins that into "climate change is a hoax" even though common sense would dictate the opposite conclusion... that is, the old records were of poorer quality and warm biased. The BWI "urban heat island" effect is mostly made up. The Inner Harbor ASOS is always warmer [which is probably a better measure for the city of Baltimore, you know the place were most people live and work!], and lately has been MUCH warmer. Source: How not to measure temperature, part 48. NOAA cites errors with Baltimore's Rooftop USHCN Station – Watts Up With That?
-
If BWI was running 2-4F warmer [relative to average] than all other sites, you can guarantee, there'd be 100 posts about this at this point. Now, it's crickets - although I do see @WxUSAFhas also raised some questions about the readings recently.

-
Something is amiss. I never see ASOS reporting 100% without some sort of weather (fog, rain, snow), and they claim it actually dropped 2F below the minimum hourly dewpoint reading. Looking at the climate stats, BWI is running 2-4F cooler [relative to its average] than all of the surrounding sites for weeks on end. What is going on here?
-
Something amiss with the BWI temperature sensor? This strikes me as odd. Rarely if ever see an ASOS sensor reporting 100% humidity without some type of weather (fog, rain, snow). And not only that it claims it fell 2F below the minimum hourly dewpoint reading at some point. Wasn't even 100% ideal radiational cooling conditions with a 3-6 mph wind, rather than dead calm over that interval. Looks like it's been running 2-3F below the norms compared to other sites over the past several weeks as well.
-
Very impressive. 77.50% of the continental U.S. is in D0 to D4. That is the 20th highest weekly amount since the drought monitor began in 2000. Only the period from July 10, 2012 to September 4, 2012, and the period from October 11, 2022 to December 13, 2022 had more D0 or worse conditions. No other single week outside of those stretches had more drought or dryness.
-
Fall 2024 Medium/Long Range Discussion
TheClimateChanger replied to madwx's topic in Lakes/Ohio Valley
Not bad. Would like to see the oranges and reds shift a bit further northwest. -
Fall/Winter '24 Banter and Complaints Go Here
TheClimateChanger replied to IWXwx's topic in Lakes/Ohio Valley
Nah, overall climate is just a little cooler than Tennessee used to be, and the last couple of years have been fully Tennessean. You cherrypicked two locations that are more than 600' lower in elevation than Pittsburgh airport.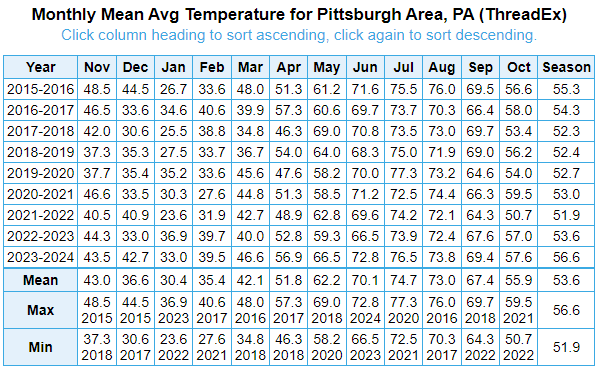
-
Fall/Winter '24 Banter and Complaints Go Here
TheClimateChanger replied to IWXwx's topic in Lakes/Ohio Valley
-
Brrr... Detroit made it down to 37F. So cold! The record low max for October 16 & 18 is 37F! The record low for today is 23F.
-
New England 2024 Warm Season Banter
TheClimateChanger replied to HoarfrostHubb's topic in New England
No, not sarcastic. And I like you Tip, but I'm going to have to respectfully disagree. The sample size was more than the standard 30-year for the historic DC numbers. Yes, the Elkin figures are only 9 years, but this year will be the tenth - does anyone really think it's going to deviate that substantially from the previous 9? A 10-year sample historically would be a good approximation for a 30-year mean centered on that 10 years. I doubt there's ever been an instance [when the climate has been less in flux] where a 10-year mean differed more than about 1F from its corresponding 30-year mean. 10 years is long enough to overcome pretty much any climate cycles. Even the solar cycle is only 11 years, so you're pretty much capturing an entire solar cycle in that sample. I'll grant you right now it's only 9, but winter is coming! -
Fall/Winter '24 Banter and Complaints Go Here
TheClimateChanger replied to IWXwx's topic in Lakes/Ohio Valley
Where is that guy from Illinois that's always complaining about Illinois winters? He needs to see this! -
Fall/Winter '24 Banter and Complaints Go Here
TheClimateChanger replied to IWXwx's topic in Lakes/Ohio Valley
Glad somebody said it. And Chicago, you guys have cold winters compared to Ohio and Pennsylvania. But people don't think Ohio and Pennsylvania are mild. Dude, our winters are basically 1950 Kentucky/Tennessee winters. It's laughably stupid. Like Florida doesn't have mild winters, it has NO winter. It's not a 4-season location. -
Fall/Winter '24 Banter and Complaints Go Here
TheClimateChanger replied to IWXwx's topic in Lakes/Ohio Valley
-
False, it has plenty to do with October. I just stated in my post, there are opportunities for several days of 70+ coming up this week to add onto the current record. The 32 or lower max temperatures is also relevant, because as we move into late October, it becomes possible to have high temperatures at or below freezing. The earliest 32F max for Detroit is October 29, 1925. As though a switch is flipped, it becomes commonplace in the month of November. Every day in the month of November, save the 2nd and 6th, have had at least one 32 or lower afternoon [and those days were close with highs of 33F and 34F]. By the second half of November, highs below 20F occur from time to time. So it is indeed something to watch over the coming weeks, as I said.
-
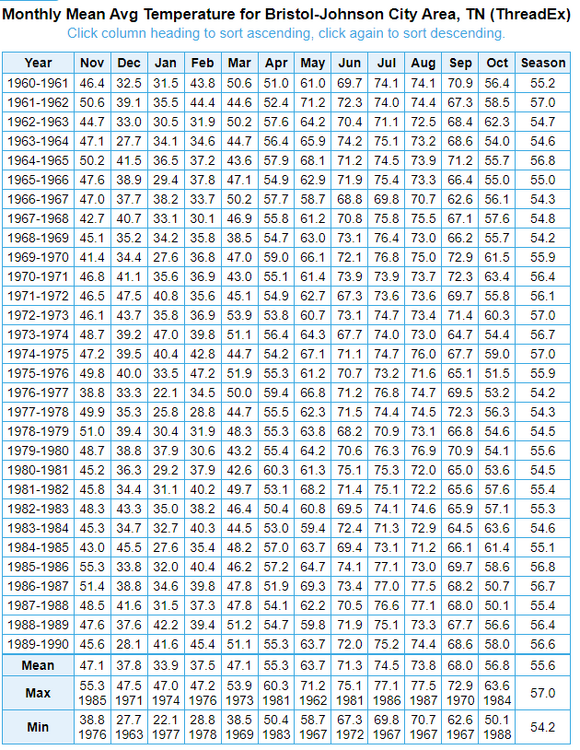
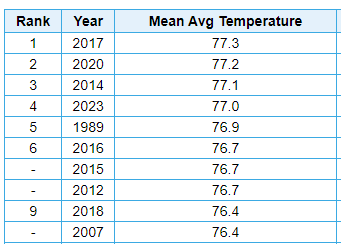
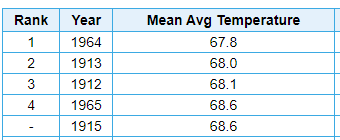
If we look at the 10 hottest years at Phoenix, we see a number of recent years with means ranging from 76.4F to 77.3F. I suspect 2024 will eclipse these, but the year is not yet complete. But if we subtract Maue's speculated 10F urban heat island effect, then we see all of these years were actually far cooler than the coldest years on record. Astounding! What we can conclude then is rural areas have warmed considerably, but Phoenix [and only Phoenix] has actually cooled considerably but the urban heat island has corrupted the data to such an extent that it looks like it has warmed. Fascinating theory.
-
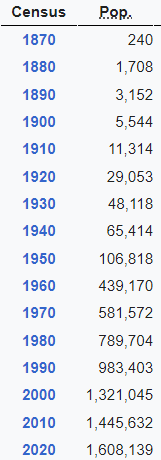
Here is the historical population data for Phoenix. Weird how this "urban heat island" effect wasn't a big deal in 2000, when the population was more than 1.3 million, or 1990, when the population was about 1 million, or 1980, when the population was about 800,000. It just suddenly appeared in 2020, when heat records were being broken left and right. Fascinating phenomena.