TheClimateChanger
-
Posts
3,060 -
Joined
-
Last visited
Content Type
Profiles
Blogs
Forums
American Weather
Media Demo
Store
Gallery
Everything posted by TheClimateChanger
-
Good luck with your theory. I hope it works out for you, seriously.
-
-
Central PA Autumn 2024
TheClimateChanger replied to Itstrainingtime's topic in Upstate New York/Pennsylvania
.CLIMATE... A record high temperature of 77 degrees was set at Bradford on Monday. This breaks the old record of 75 degrees set Oct 21, 1979. A record high temperature of 80 degrees was tied at Altoona on Monday. This ties the old record of 80 degrees set Oct 21, 2020. For reference, here are the daily record maximum temperatures for October 22-23: Harrisburg 83/1947 | 86/1947 Williamsport82/2020 | 84/1947 Altoona81/2020 | 78/2020 Bradford 78/1979 | 78/2020 The State College COOP reports records from 7am-7am, with each daily report representative of the previous 24 hours. With that in mind, here are the daily record maximum temperatures for October 23-24: State College 84/1979 | 78/2020 -
One thing I find interesting about San Diego is it used to be freezing cold with fewer days above 70F than Fairbanks, Alaska sees these days. Yet now it's above 70F for nearly 9 straight months of the year. Some could argue that it's due to the thermometer being moved to the airport, but the airport is right on the waterfront. It looks like San Diego has been a major beneficiary of climate change.
-
-
Central PA Autumn 2024
TheClimateChanger replied to Itstrainingtime's topic in Upstate New York/Pennsylvania
Can't beat that. Maybe they ought to change the name to Sun City, Pennsylvania. Might reverse those population drops. -
Central PA Autumn 2024
TheClimateChanger replied to Itstrainingtime's topic in Upstate New York/Pennsylvania
That East Nantmeal urban heat island is growing insane. Your lows are now several degrees warmer than the lows at Baltimore! -
Central PA Autumn 2024
TheClimateChanger replied to Itstrainingtime's topic in Upstate New York/Pennsylvania
Looks like more of the same through Wednesday, per CTP.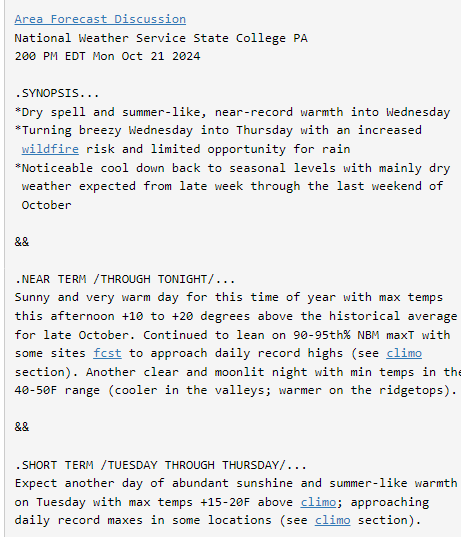
-
Central PA Autumn 2024
TheClimateChanger replied to Itstrainingtime's topic in Upstate New York/Pennsylvania
Looks like Bradford has at least reached a daily record high. Altoona nearing its record as well. -
One thing I found weird about that is I had never heard of a "volcanic summer" showing up in the geologic record. It's always a "volcanic winter" with a period of cooling corresponding to an explosive volcanic eruption. One would think if volcanos were capable of causing warming of a similar magnitude, the geologic record would have been replete with examples prior to 2022... especially considering the globe is like 70% water. Surely HTHH was not the first volcanic eruption of that magnitude in a relatively shallow ocean or sea?
-
New England 2024 Warm Season Banter
TheClimateChanger replied to HoarfrostHubb's topic in New England
I would trust the Dr. Elbert Little and the U.S. Forest Service over a Google search. Looks like there farthest north native range is far southern Ontario and southwest New York. Range and Niche Maps for pawpaw Climate Change Atlas - Northern Research Station, USDA Forest Service
-
The urban heat island effect has been solved!
-
Fall 2024 Medium/Long Range Discussion
TheClimateChanger replied to madwx's topic in Lakes/Ohio Valley
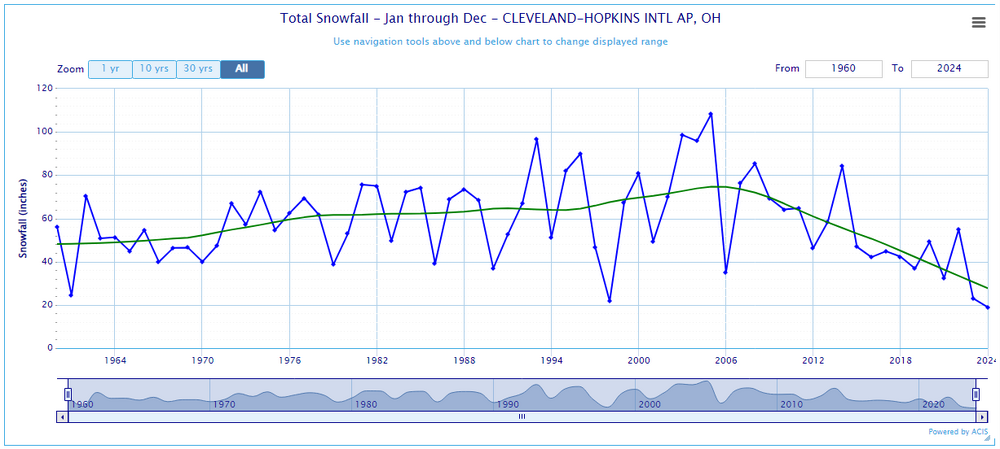
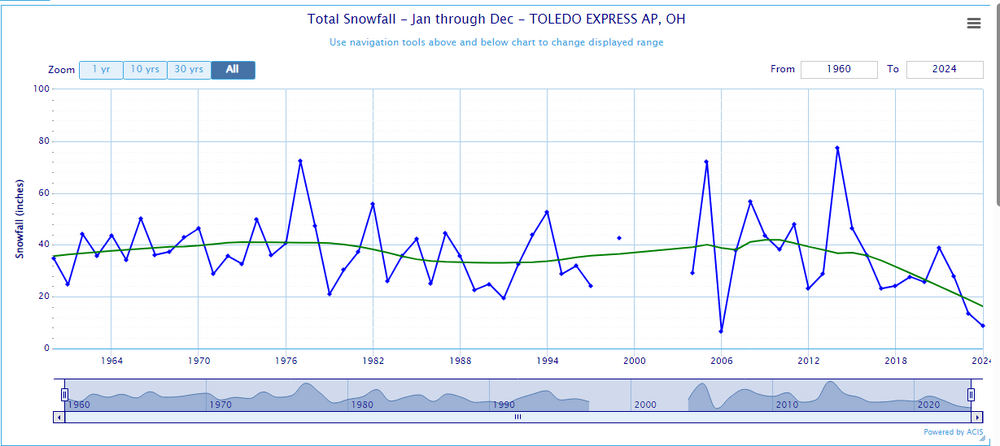
Really surprised @buckeye has come out to gloat? Is anyone else in the subforum on the board yet for snowfall? Maybe that dude in the UP? I think if the subforum had been polled as to which city would see the first official measurable snowfall, Columbus would have been dead last.
-
New England 2024 Warm Season Banter
TheClimateChanger replied to HoarfrostHubb's topic in New England
ChatGPT says they are not native. Is there any evidence of non-cultivated pawpaws in New Hampshire or Vermont?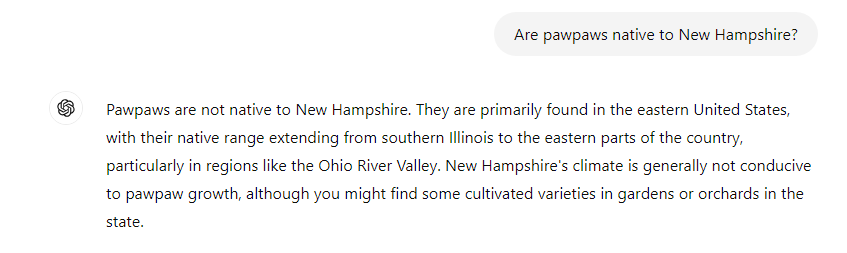
-
Looks like the Mid Atlantic is one of the wettest places in the country right now.
-
Fall 2024 Medium/Long Range Discussion
TheClimateChanger replied to madwx's topic in Lakes/Ohio Valley
Allegedly, Columbus had its second earliest accumulating snowfall of record on the 15th. Looking at the WX code, there was hail reported. I wonder if it was actually graupel or small hail?
-
Fall 2024 Medium/Long Range Discussion
TheClimateChanger replied to madwx's topic in Lakes/Ohio Valley
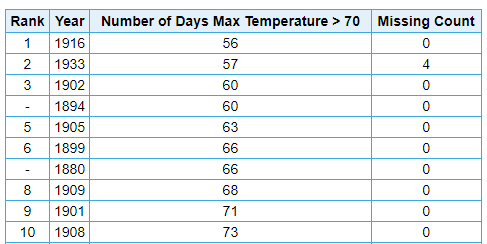
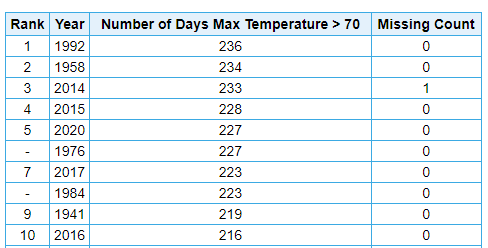
1950 was an interesting autumn. In addition to the epic November snowstorm and the impressive heat of October 31 & November 1, there was an event known as "Black Sunday" which occurred on September 24 of that year. Must have been similar to the smoke pall that hit the northeast last June, but by all accounts, was even more impressive - perhaps aided by the general pollution and smog which was ubiquitous in that era and the lower sun angle of late September. The smoke allegedly originated from the Chinchaga Firestorm in western Canda. Was also freezing cold that day (probably aided in part by the smoke blocking the sunlight)... the high of 46F at Detroit is a daily record low and the third lowest for the month. The high was 45F on the 29th in 1967, and an absurd 41F on the 30th in 1899 [it was also 47F the prior day in that year]. -
Occasional Thoughts on Climate Change
TheClimateChanger replied to donsutherland1's topic in Climate Change
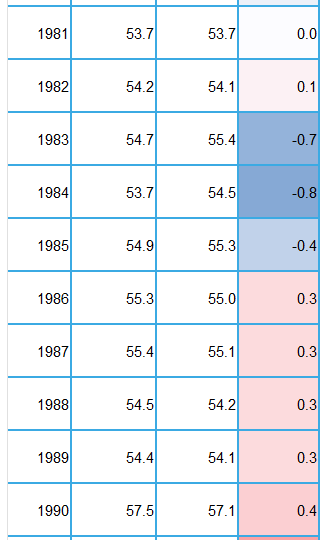
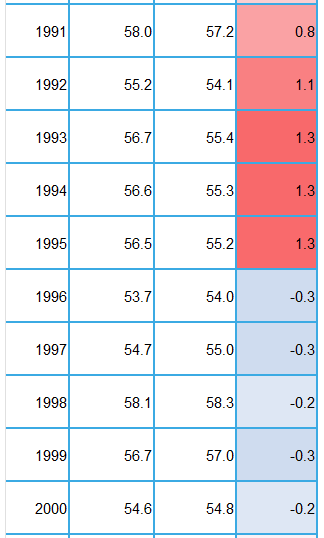
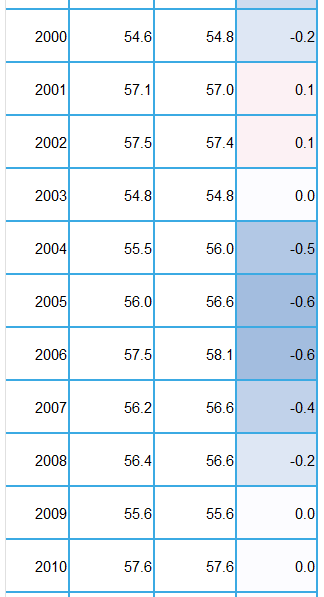
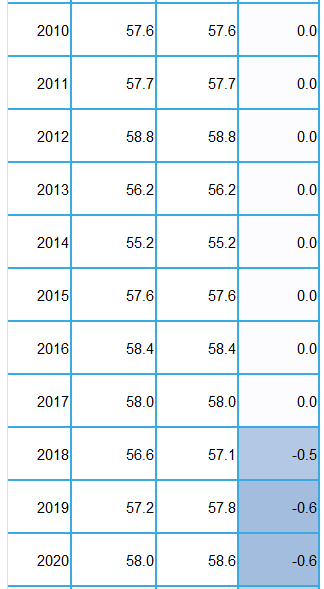
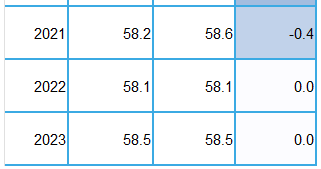
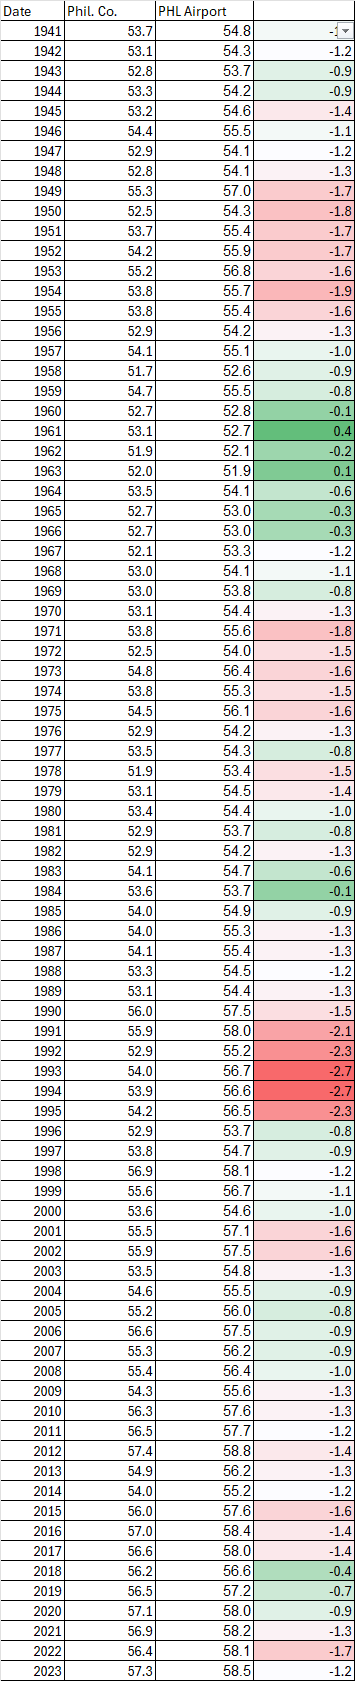
Here are the numbers comparing Philadelphia County to PHL. The county figures are probably more relevant than the city figures, as these are utilized as part of the divisional averages, state averages and national averages. The county averages are almost uniformly lower than the PHL airport averages, except for a couple years in the 1960s. That was also the period where there was the least overall difference. The largest cooling is in the early 1990s, likely related to the HO-83 hygrothermometer in place at the time which lead to spuriously high readings at the airport. Overall, the adjustments make the trend slightly less. As noted, the raw data from PHL suggests a trend of +0.441F/decade since 1941, while the NCEI averages for Philadelphia County suggest a trend of 0.42F/decade.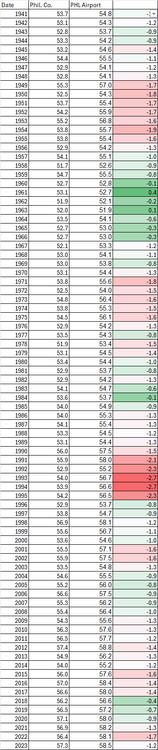
-
Fall 2024 Medium/Long Range Discussion
TheClimateChanger replied to madwx's topic in Lakes/Ohio Valley
I think we’d all take a couple days around 80, if it meant a blizzard with 30” of snow and subzero temperatures over the extended Thanksgiving holiday. Not real convinced 1950 is good analog at this point. -
Fall 2024 Medium/Long Range Discussion
TheClimateChanger replied to madwx's topic in Lakes/Ohio Valley
Looking solid, Doc. -
Fall 2024 Medium/Long Range Discussion
TheClimateChanger replied to madwx's topic in Lakes/Ohio Valley
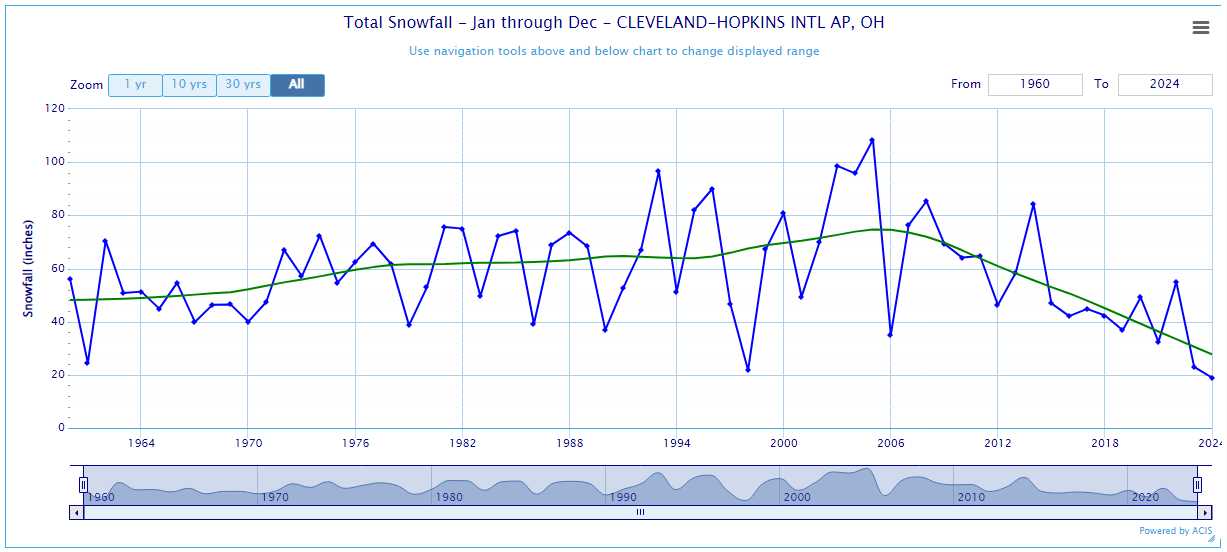
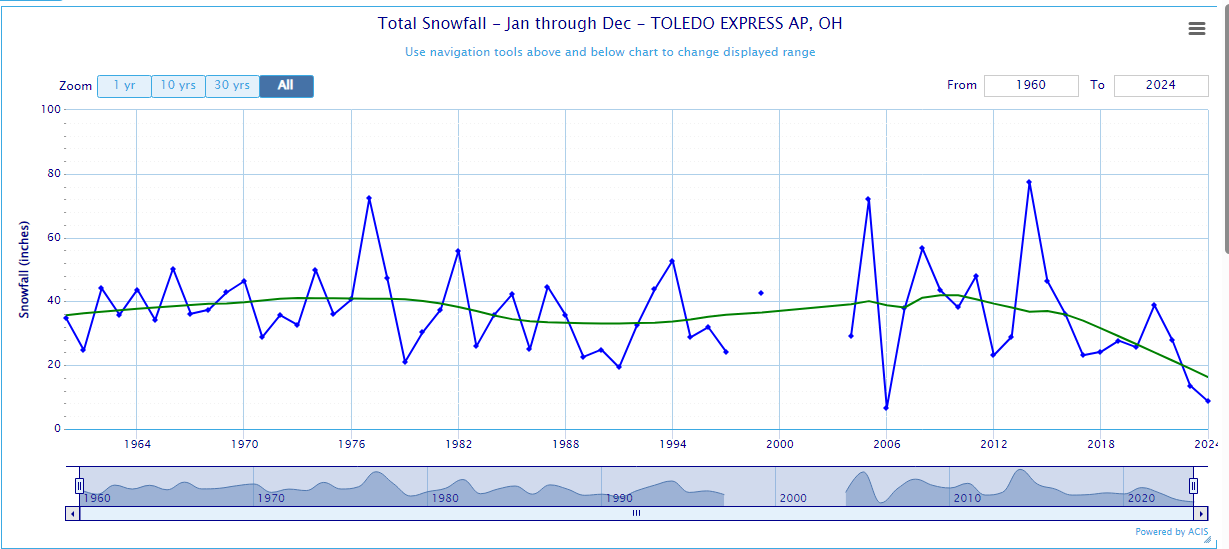
How has this compared to previous months? I noted previously that Zanesville, Ohio had its fifth driest month on record (any month) in August with 0.17 inches, and driest of any month since October 1924. Now just two months later, they may eclipse that figure with just 0.13” so far and looking pretty dry for the next week. -
Occasional Thoughts on Climate Change
TheClimateChanger replied to donsutherland1's topic in Climate Change
Wow - why would they install a weather station on a landfill? -
Occasional Thoughts on Climate Change
TheClimateChanger replied to donsutherland1's topic in Climate Change
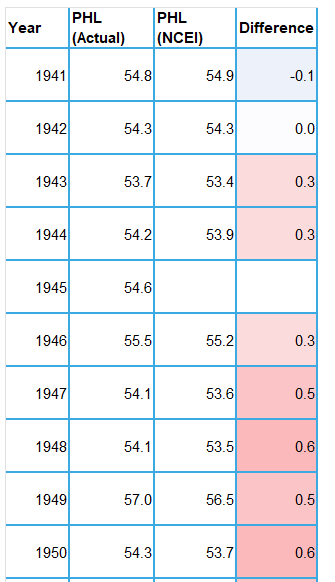
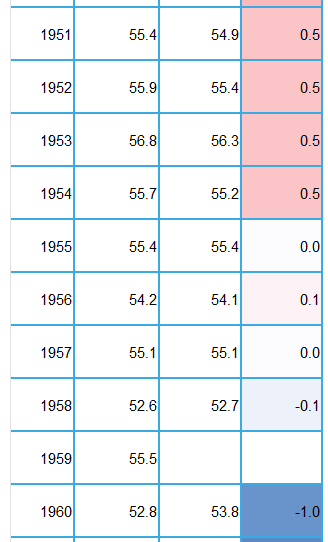
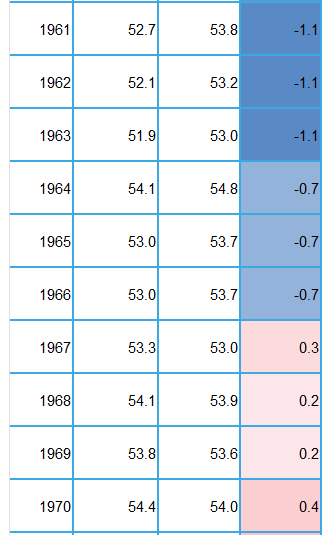
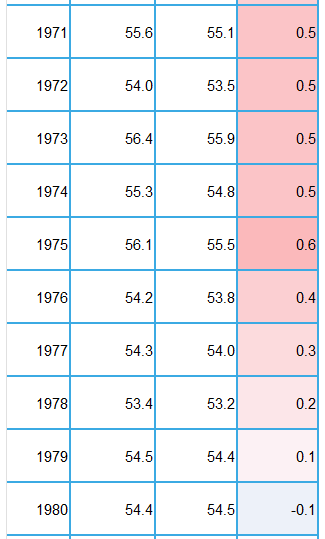
So what we can see is relative to the actual observations, NCEI adjustments generally slightly cooled the 1940s and 1950s. However, beginning in the late 1950s and continuing through the mid 1960s, there is a period where NCEI substantially warmed the actual observations. Thereafter [and continuing through the late 1970s], NCEI adjustments favored a small cooling. In the early 1980s, NCEI adjustments were a general warming of the actual observations. From the mid 1980s through the mid 1990s, there was a significant cooling adjustment. NOTE: This adjustment from 1985-1995 appears to be related to the defective HO-83 hygrothermometer, which produced spuriously high readings in that era at first-order sites. I don't think there's any express adjustment for the instrument, but rather it's adjusted through comparison with other observations. Following the installation of the ASOS in 1996, adjustments have generally been modest with either no change to the data or a small warming adjustment applied. The overall effect of adjustments on the trendline at PHL is small, although it does slightly increase the trend from .441F/decade to .489F/decade. -
Occasional Thoughts on Climate Change
TheClimateChanger replied to donsutherland1's topic in Climate Change
@ChescoWx Red means actual is WARMER than NCEI, and blue means actual is COOLER than NCEI. White means no change. NCEI does not have a value for 1945 or 1959.