TheClimateChanger
-
Posts
3,059 -
Joined
-
Last visited
Content Type
Profiles
Blogs
Forums
American Weather
Media Demo
Store
Gallery
Everything posted by TheClimateChanger
-
Pittsburgh/Western PA Winter 2024-2025 Thread
TheClimateChanger replied to Rd9108's topic in Upstate New York/Pennsylvania
-
Pittsburgh/Western PA Winter 2024-2025 Thread
TheClimateChanger replied to Rd9108's topic in Upstate New York/Pennsylvania
Roads are awful out there. -
Apparently so, although the dry fall is making for limited water.
-
Pittsburgh/Western PA Winter 2024-2025 Thread
TheClimateChanger replied to Rd9108's topic in Upstate New York/Pennsylvania
Nice little event this morning. I measured about 1.3” on an elevated flat surface. -
Winter 2024-25 Medium/Long Range Discussion
TheClimateChanger replied to michsnowfreak's topic in Lakes/Ohio Valley
Something like this would satisfy Beavis. You know it's a good month when the cumulative low temperature is -284.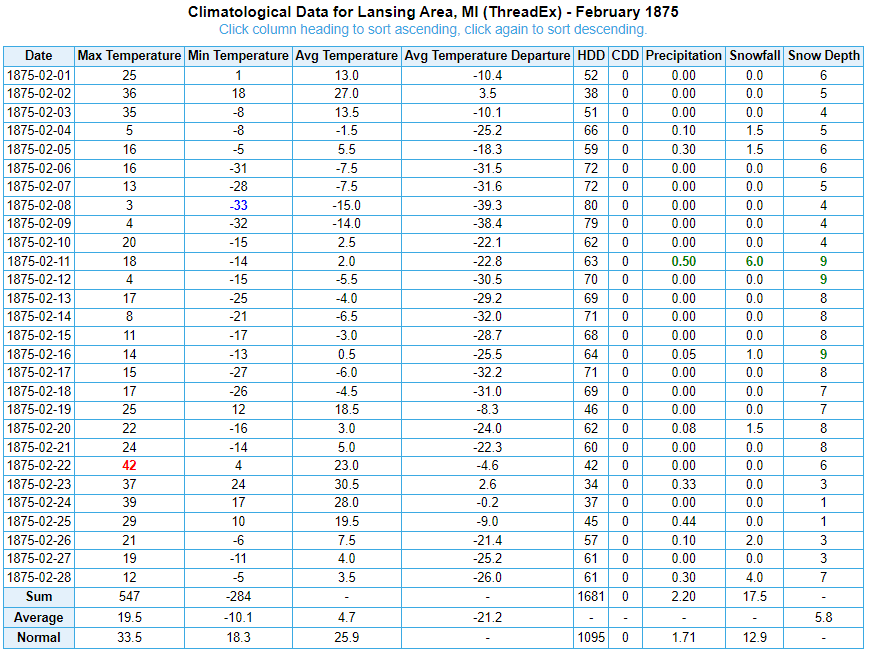
-
Winter 2024-25 Medium/Long Range Discussion
TheClimateChanger replied to michsnowfreak's topic in Lakes/Ohio Valley
You should take a look at 1995-96. You nearly had him doubled. Hell, Charleston, West Virginia had about 4x as much snow. -
Chicago Weather Records Tracking
TheClimateChanger replied to Chicago Storm's topic in Lakes/Ohio Valley
Would certainly look that way. This is computed by averaging of monthly average, so it's using the December mean to date. With the looming warmup, it might even end up somewhat above this. Rest assured, Chi-town is not alone. Pretty much everywhere is on track for a record-breaker, or certainly top 2 or 3.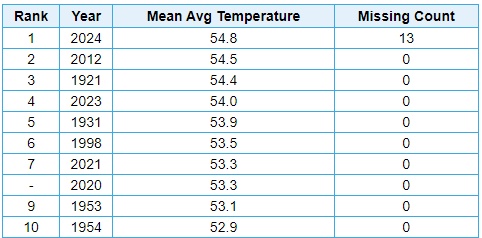
-
Winter 2024-25 Medium/Long Range Discussion
TheClimateChanger replied to michsnowfreak's topic in Lakes/Ohio Valley
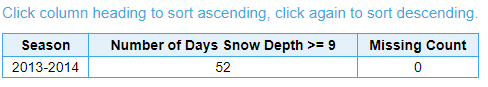
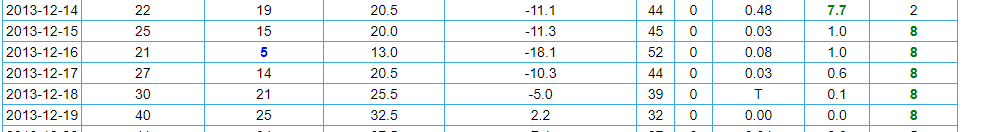
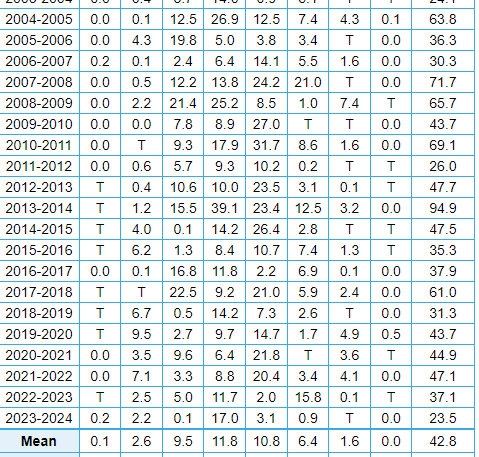
xMacis is goofy for snow depth since 2013-2014. Let's hope those are the right numbers above prior to 2012-2013. Look at this. Number of days 8"+ at DTW during 2013-2014: Number of days 9"+ at DTW: This would imply there were no days with exactly 8", but this is completely incorrect. In fact, there were five days just in December with 8" snow depth at DTW. Something's coded wrong here. You'd have to go in and manually calculate the number of days at each depth.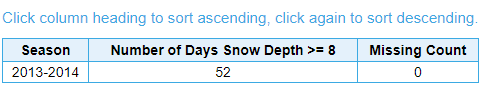
-
Winter 2024-25 Medium/Long Range Discussion
TheClimateChanger replied to michsnowfreak's topic in Lakes/Ohio Valley
Here are the top 10 SDD winters for DTW from 1959-1960 to 2012-2013, inclusive. These values are valid for DTW only, and may differ some from the threaded record prior to 1966. I wanted to maintain location consistency for this analysis. 1981-82, 528 1977-78, 514 2010-11, 494 1998-99, 391 2008-09, 382 2000-01, 333 1984-85, 309 1974-75, 297 1975-76, 285 1966-67, 277 Here are the 10 lowest SDD counts for that same time frame: 1988-89, 34 1979-80, 35 1982-83, 36 2011-12, 44 1971-72, 47 1960-61, 53 1965-66, 63 2001-02, 66 1995-96, 66 1968-69, 67 -
Winter 2024-25 Medium/Long Range Discussion
TheClimateChanger replied to michsnowfreak's topic in Lakes/Ohio Valley
I will generate the numbers for 1959-1960 to 2012-2013 in a second. Would have to do some weird stuff to figure out 2013-2014 to 2023-2024. -
Winter 2024-25 Medium/Long Range Discussion
TheClimateChanger replied to michsnowfreak's topic in Lakes/Ohio Valley
In fact, it doesn't seem to be working for any exact values other than 2 inches [and some other random depths]. It will generate number of days greater than or equal to a value, but it is having trouble with equal than. Weird. -
Winter 2024-25 Medium/Long Range Discussion
TheClimateChanger replied to michsnowfreak's topic in Lakes/Ohio Valley
I was going to do it for you, but for some reason, xMacis is messed up. If you select numbers of days where snow depth is exactly 1", it won't generate any days after the winter of 2012-13 for some reason. For DTW, that is. Not sure if this is the case for other locations. And I have no idea why it is doing it? -
Winter 2024-25 Medium/Long Range Discussion
TheClimateChanger replied to michsnowfreak's topic in Lakes/Ohio Valley
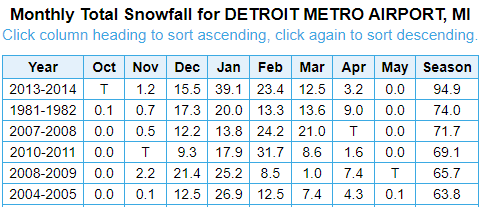
Were they really that unusual temperature-wise? Only 4 of 11 winters from 2004-2005 to 2014-15 were colder than the long-term average of 27.2 at DTW (1958-59 to 2023-24). Snowfall was certainly plentiful, however, with only 3 lower than the mean at DTW since 1959-1960. And also 5 of the top 6 amounts dating back to that timeframe (at bottom).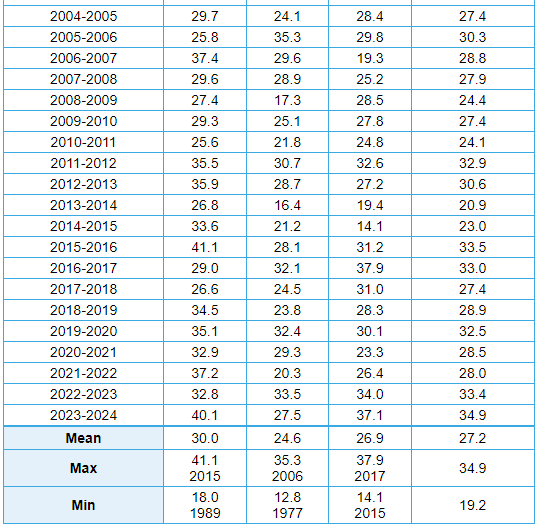
-
2024-2025 La Nina
TheClimateChanger replied to George001's topic in Weather Forecasting and Discussion
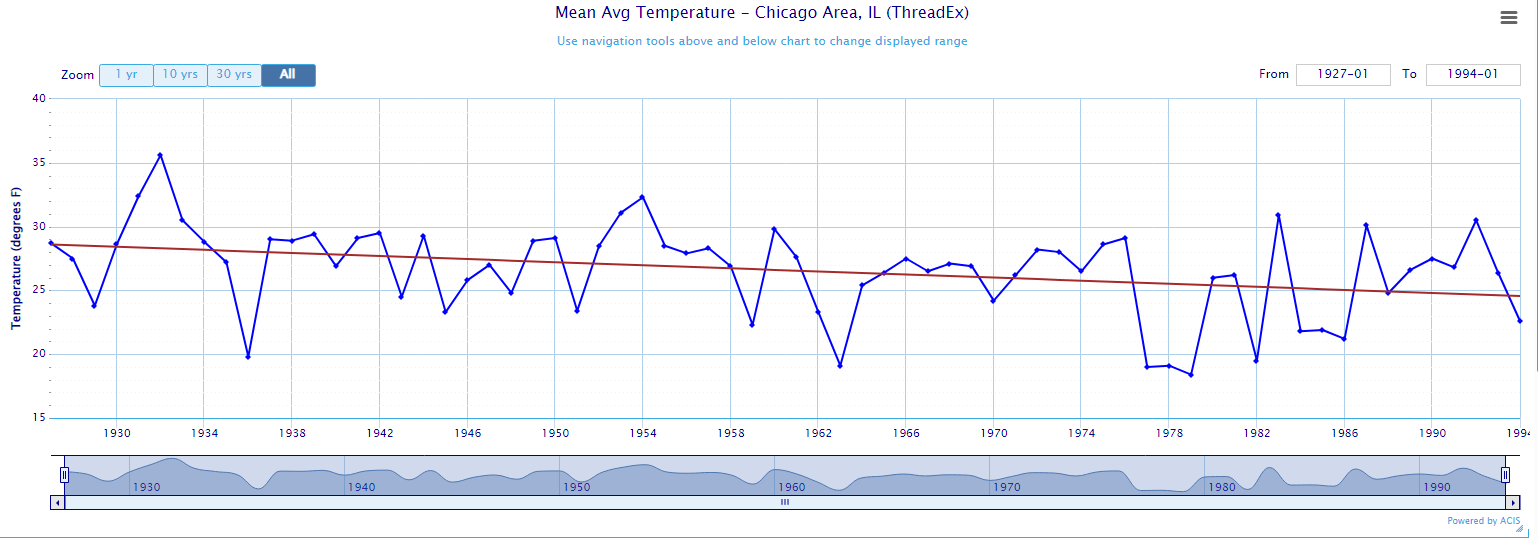
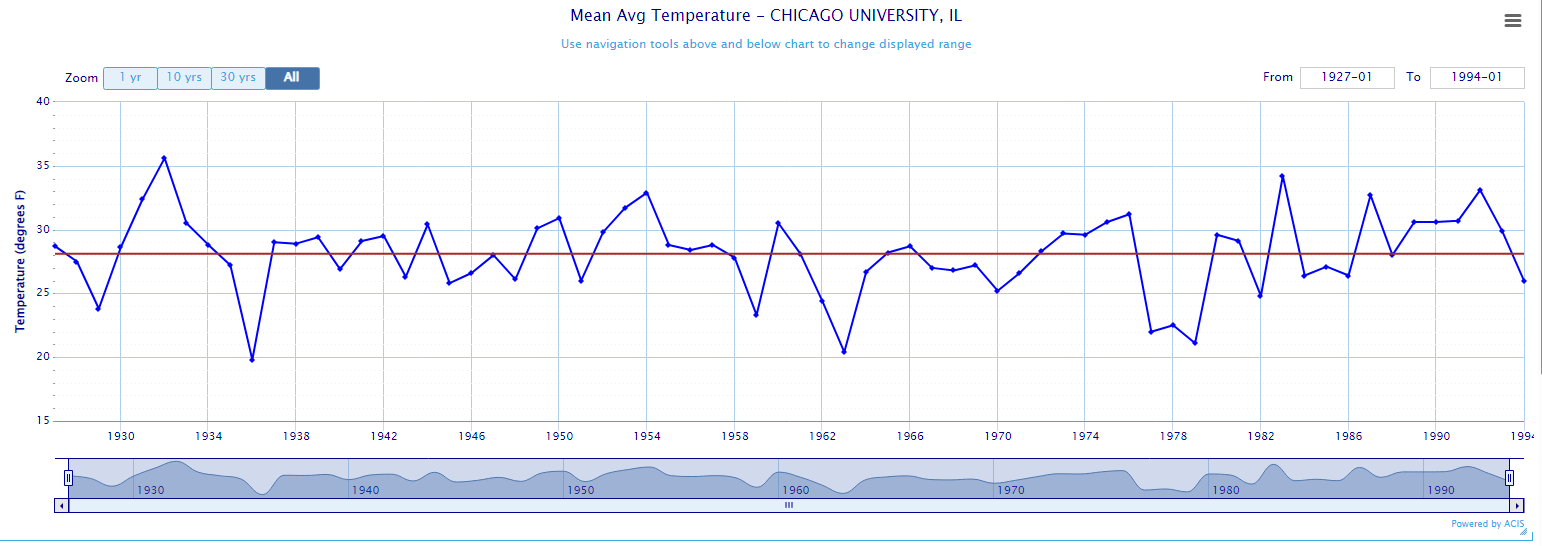
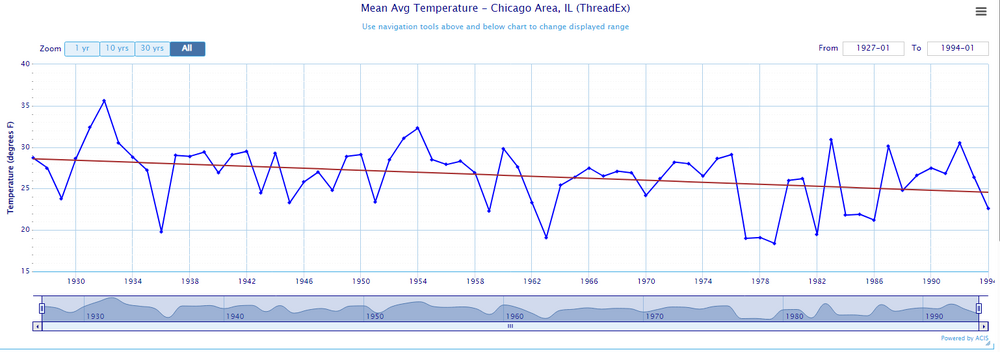
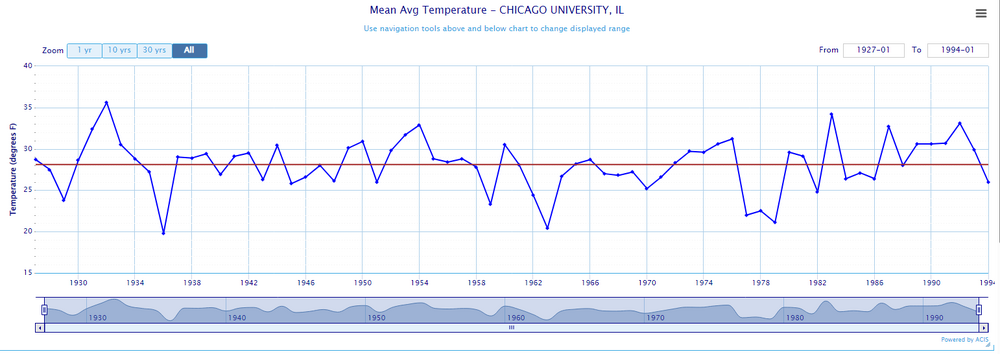
You know what they say, there are lies, there are damn lies, and then there are statistics. Here's how to manufacture a massive cooling trend from a trendless data. Move the station further and further away from the lake and present with no adjustment or even proper context. In fact, falsely claim the cooling should be even more pronounced if not for the ever-growing UHI effect. Chicago "thread" [Mean winter temps from 1926-27 to 1993-94] University of Chicago [Mean winter temps from 1926-27 to 1993-94] We can see using a fixed site (in this case, the University of Chicago), the 1960s and 1970s were somewhat colder than the preceding decades, but not to the extent shown on the threaded record. By the 1980s and early 1990s, temperatures had recovered and were already exceeding many of the past decades. Overall, a flat trend over that interval with a cyclical cooling and warming superimposed on the trend. Much more in line with the NOAA values for Cook County.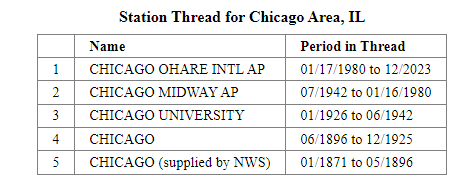
-
Pittsburgh/Western PA Winter 2024-2025 Thread
TheClimateChanger replied to Rd9108's topic in Upstate New York/Pennsylvania
I was updating the post from last week. -
I will acknowledge you can see that 2015 anomaly on this graphic as well that @Typhoon Tip mentioned. Not really sure what was going on there. It was like mother nature was trying to fight back or something but failed.
-
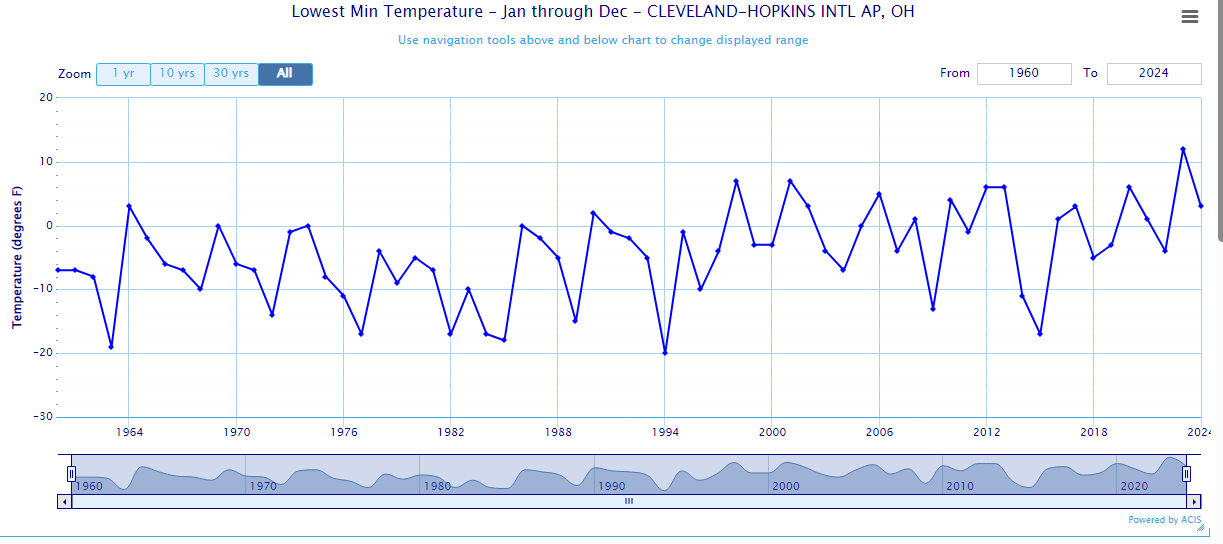
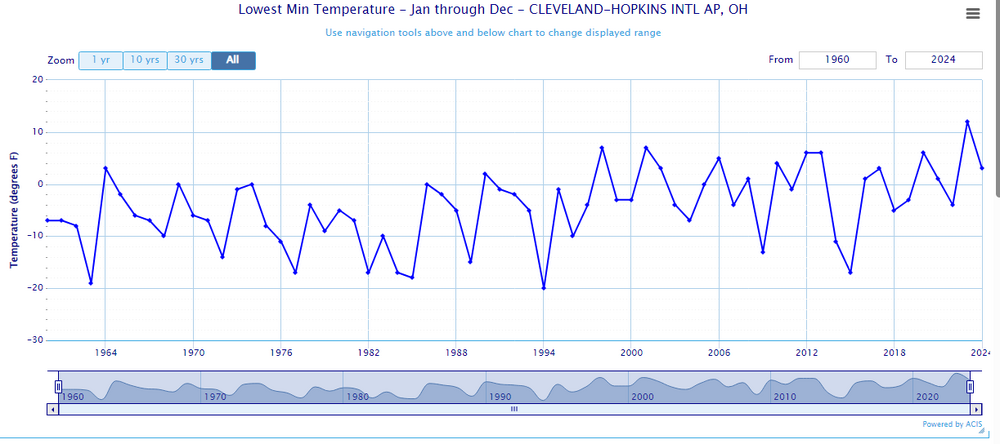
And anyone saying I'm being alarmist, look at the data yourself. For the first 30 years of this dataset, there is only one zone 7 year (1964), with a few others right at 0 [cusp of 6/7]. 6 of the last nine years have been zone 7, with one of those being zone 8 conditions. What used to be exceptionally rare, is now the norm and characteristic of the climate of Cleveland. All I'm doing is extrapolating the trend, which I find to also be consistent with my understanding of prior similar climate regimes.
-
This has always been my premise. When you look at similar ancient climate regimes with large inland bodies of water, you always find very warm subtropical flora and fauna well up into the mid and high latitudes. If you look at Cleveland, you can see traditionally it was zone 5 to cold zone 6, but now is firmly zone 7. 2023 was the first year [since 1960] with Zone 8 conditions. I don't put a whole lot of stock in the pre-1960 numbers due to a variety of reasons. Moving forward with these trends, it's reasonable to expect Zone 8 conditions to fully envelope this region by the latter half of this century. If warming continues, zones 9 to 10 look likely for next century. I've never seen a valid rebuttal to this. Only, oh shut up, Cleveland won't look like Miami. You are trolling.
-
Pittsburgh/Western PA Winter 2024-2025 Thread
TheClimateChanger replied to Rd9108's topic in Upstate New York/Pennsylvania
Departure down to -0.6F as of yesterday. With a high temperature of 58F earlier, today should push it into the positive range for the first time this month. -
Winter 2024-25 Medium/Long Range Discussion
TheClimateChanger replied to michsnowfreak's topic in Lakes/Ohio Valley
-
Surprised there was less talk of this. CLE picked up 3.8" yesterday, which appears to be the third snowiest calendar day dating back to February 13, 2022 - a period of about 2 years and 10 months.
-
Pittsburgh/Western PA Winter 2024-2025 Thread
TheClimateChanger replied to Rd9108's topic in Upstate New York/Pennsylvania
Interesting. Just checked and it's showing 7-8 inches for the city. I haven't seen anything that would lead me to believe that's a likely outcome. -
Pittsburgh/Western PA Winter 2024-2025 Thread
TheClimateChanger replied to Rd9108's topic in Upstate New York/Pennsylvania
I think the biggest question on everyone’s mind is whether PIT may see its first below normal month since August 2023. Through the first ten days of the month, December is sitting at -1.2F. My inclination, however, is no. The month will probably finish above normal. We shall see. -
Fall/Winter '24 Banter and Complaints Go Here
TheClimateChanger replied to IWXwx's topic in Lakes/Ohio Valley
Would be a fitting end to what should go down in the record books as the warmest year on record just about everywhere. -
Central PA Winter 2024/2025
TheClimateChanger replied to Voyager's topic in Upstate New York/Pennsylvania
It's little wonder they caught him at McDonald's.