

TheClimateChanger
-
Posts
3,065 -
Joined
-
Last visited
Content Type
Profiles
Blogs
Forums
American Weather
Media Demo
Store
Gallery
Everything posted by TheClimateChanger
-
Pittsburgh/Western PA Summer 2022 Discussion
TheClimateChanger replied to Ahoff's topic in Upstate New York/Pennsylvania
Maybe I have too much time on my hands, but I went through every first-order climate site in PIT's CWA and all surrounding offices (CLE, ILN, BUF, RLX, CTP, and LWX) and only a few locations have received 4 or fewer 90+ days. Most lower elevations sites have 2-4x that amount, with up to 5-7x that amount in the Coastal Plain and a couple of other particularly low elevation sites. Except for MFD and HLG, there's BUF next to Lake Erie and several high elevation sites with DUJ at 1800' and EKN, BFD, BKW and JST all above 2000'. Even AGC (which was the official site from 7/1/1935-9/16/1952) is at 9 days, which honestly seems more in line with most observations. PIT 4 DUJ 4 MFD 4 BUF 4 HLG 3 EKN 3 BFD 2 BKW 1 JST 0 -
Upstate/Eastern New York-Springtime?
TheClimateChanger replied to BuffaloWeather's topic in Upstate New York/Pennsylvania
Not sure how you put up with that. Syracuse has 4 more 90+ days this year alone than Pittsburgh International has recorded in the last two summers combined. -
Yes, not nearly as much movement as the wintertime. With that said, they keep redefining what is normal. Based on 1961-1990 normals, June was 67.8, July 71.9, and August 70.3. Now its 69.9 (+2.1F), 73.9 (+2.0F), and 72.3 (+2.0F). So it would have been considered more than 4F above normal as recently as 2000.
-
What an incredible summer of yesteryear in New York State. I see people say these temperatures are unattainable due to urban heat island, but when you look at the actual data, you see that it was unimaginably cold upstate as well with numerous locations in the 30s - even several freezing temperatures.
-
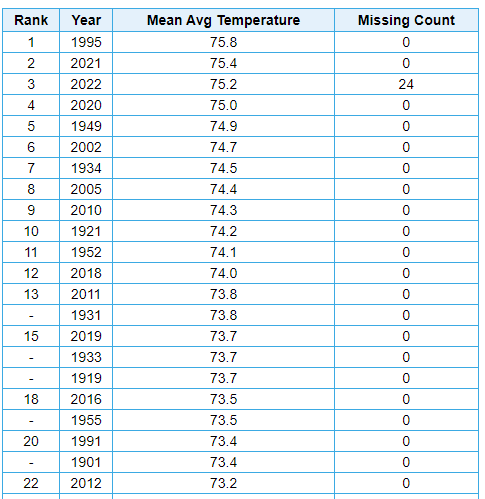
Very similar story in Toledo. If the summer ended today, it would rank as third warmest in between 2021 and 2020. I question the 1995 readings as the temperatures in the era (late 1980s - mid 1990s) were inflated by the HO83 hygrothermometer, which is known to have a substantial warm bias. Still very impressive... looking at top 22 of 150 years, we find 2002, 2005, 2010, 2011, 2012, 2016, 2018, 2019, 2020, 2021, and 2022. Just incredible never-ending heat, making the Dust Bowl era look mild. What really makes these readings impressive is Toledo Express airport is in a rather rural setting, situated in the middle of a green belt including the Oak Openings Preserve and Maumee State Forest, with nothing but cornfields and soybeans and scattered towns for hundreds of miles to the west.
-
In what has become a familiar refrain, another scorching summer in northern Ohio. Akron is currently tied for 6th place with 2020 for the warmest June 1 - August 7 periods on record. While the top four on this list are all quite old, those years all cooled in late August. So all of the current record hottest summers are exclusively very recent (see table below). If the summer ended today, it would tie for hottest on record with 2020 and 2016. 2018 and 2021 are tied for third hottest on record at two-tenths of a degree below 2020 and 2016. It appears 2022 should follow suit, and end up somewhere in the mix with these recent years. What's especially interesting and mindboggling is the station thread includes records from the University of Akron, and then present-day Akron Fulton International Airport for a while, before moving to the Akron-Canton Regional Airport in Green Township. If records were still taken at KAKR, a lot of these recent readings would be another 0.5-1F warmer.
-
Dishonorable mention to the other Italian-American weather guru named Joe, for this atrocious forecast at the Heartland Institute's ICCC in July 2014:
-
E PA/NJ/DE Summer 2022 OBS Thread
TheClimateChanger replied to Maxwell03's topic in Philadelphia Region
East Nantmeal sounds like a magical place. You even have one fewer 90+ day than Bradford at 2100’ near the New York state line. And if there’s a heat island in McKean County, there must be a heat island everyone. 40,000 people and 1,000 square miles. -
Heck, we get 1995-esque temperatures today, and people comment about how it's a mild summer of yesteryear.
-
Well, I'm sure the current system isn't perfect. It's probably the best system we have. When was the ASOS installed at PHL? Those readings from 1993-1995 are probably hyper-inflated from the HO-83 sensors, which are known to have read 1-3C too high during the daytime on sunny days with light winds - which are common during the summertime. https://climateaudit.org/2007/08/22/the-ho-83-hygrothermometer/ I wonder how warm summers like 1987, 1988, 1991, 1993, 1994, and 1995 from that era would be if measured today? Maybe the volcanic summer of 1992 would be even a bit cooler. I remember hearing about how 1995 was a deadly, once in a lifetime heatwave - yet now it barely even stands out as hot, as it seems almost every summer is nearly as warm or warmer these days.
-
Good point. I just took a look at PHL and PNE, and they are always about the same for daytime highs in the summer with PHL may be averaging a couple tenths of a degree warmer. Looks like it's spot on, at least for daytime maxima - unless PNE sensor also somehow broke this summer as well. I don't know about the low temperatures, although I wouldn't think it's a sensor issue if daytime maxima are unaffected. With that said, could be change in ground cover around the station, or construction? Not saying that's the case, just a possibility. Either way clearly not two degrees off. Funny how there's always so much discussion about sensors all of a sudden reading too high, but never the inverse. Even when Albany was reporting a solid 3F low for well over a year...
-
Pittsburgh/Western PA Summer 2022 Discussion
TheClimateChanger replied to Ahoff's topic in Upstate New York/Pennsylvania
It means the long-range GFS is actually going to be correct for a change. -
Actually, fourth warmest at Freehold if you toss 1983 (missing the entire months of June and July - that average is based on just the first three days of August), and 1987 (missing the entire month of June - the coolest summer month - and therefore inflated).
-
Pittsburgh/Western PA Summer 2022 Discussion
TheClimateChanger replied to Ahoff's topic in Upstate New York/Pennsylvania
Farmer’s Almanac forecast just dropped. We’re on the edge of significant shivers, slushy, icy and snowy, and unreasonably cold and snowy. -
Pittsburgh/Western PA Summer 2022 Discussion
TheClimateChanger replied to Ahoff's topic in Upstate New York/Pennsylvania
-
Pittsburgh/Western PA Summer 2022 Discussion
TheClimateChanger replied to Ahoff's topic in Upstate New York/Pennsylvania
Tornado Warning PAC051-WVC077-020015- /O.NEW.KPBZ.TO.W.0018.220801T2339Z-220802T0015Z/ BULLETIN - EAS ACTIVATION REQUESTED Tornado Warning National Weather Service Pittsburgh PA Issued by National Weather Service Charleston WV 739 PM EDT Mon Aug 1 2022 The National Weather Service in Pittsburgh has issued a * Tornado Warning for... Southeastern Fayette County in southwestern Pennsylvania... Northeastern Preston County in northeastern West Virginia... * Until 815 PM EDT. * At 739 PM EDT, a severe thunderstorm capable of producing a tornado was located over Uniontown, moving east at 20 mph. HAZARD...Tornado. SOURCE...Radar indicated rotation. IMPACT...Flying debris will be dangerous to those caught without shelter. Mobile homes will be damaged or destroyed. Damage to roofs, windows, and vehicles will occur. Tree damage is likely. * This dangerous storm will be near... Farmington around 805 PM EDT. Other locations impacted by this tornadic thunderstorm include Mill Run, Dunbar, Fairchance, Ohiopyle, Chalkhill and Markleysburg. PRECAUTIONARY/PREPAREDNESS ACTIONS... TAKE COVER NOW! Move to a basement or an interior room on the lowest floor of a sturdy building. Avoid windows. If you are outdoors, in a mobile home, or in a vehicle, move to the closest substantial shelter and protect yourself from flying debris. Torrential rainfall is occurring with this storm, and may lead to flash flooding. Do not drive your vehicle through flooded roadways. Please report severe weather by calling 412-262-1988, posting to the NWS Pittsburgh Facebook page, or using Twitter @NWSPITTSBURGH. && LAT...LON 3994 7937 3990 7940 3985 7942 3985 7940 3972 7945 3972 7948 3971 7948 3983 7984 4000 7979 3996 7936 TIME...MOT...LOC 2339Z 285DEG 19KT 3990 7973 TORNADO...RADAR INDICATED MAX HAIL SIZE...<.75 IN $$ -
Pittsburgh/Western PA Summer 2022 Discussion
TheClimateChanger replied to Ahoff's topic in Upstate New York/Pennsylvania
Tornado Warning PAC051-059-WVC061-020015- /O.NEW.KPBZ.TO.W.0019.220801T2344Z-220802T0015Z/ BULLETIN - EAS ACTIVATION REQUESTED Tornado Warning National Weather Service Pittsburgh PA Issued by National Weather Service Charleston WV 744 PM EDT Mon Aug 1 2022 The National Weather Service in Pittsburgh has issued a * Tornado Warning for... Central Greene County in southwestern Pennsylvania... Southwestern Fayette County in southwestern Pennsylvania... Northwestern Monongalia County in northern West Virginia... * Until 815 PM EDT. * At 743 PM EDT, a tornado producing storm was located near Waynesburg, moving southeast at 20 mph. HAZARD...Damaging tornado and quarter size hail. SOURCE...Radar confirmed tornado. IMPACT...Flying debris will be dangerous to those caught without shelter. Mobile homes will be damaged or destroyed. Damage to roofs, windows, and vehicles will occur. Tree damage is likely. * This tornadic storm will be near... Waynesburg around 755 PM EDT. Other locations impacted by this tornadic thunderstorm include Rogersville, Spraggs, Nineveh and Mount Morris. PRECAUTIONARY/PREPAREDNESS ACTIONS... To repeat, a tornado is on the ground. TAKE COVER NOW! Move to a basement or an interior room on the lowest floor of a sturdy building. Avoid windows. If you are outdoors, in a mobile home, or in a vehicle, move to the closest substantial shelter and protect yourself from flying debris. Torrential rainfall is occurring with this storm, and may lead to flash flooding. Do not drive your vehicle through flooded roadways. Please report severe weather by calling 412-262-1988, posting to the NWS Pittsburgh Facebook page, or using Twitter @NWSPITTSBURGH. && LAT...LON 3987 8040 4001 8029 3985 7993 3971 8013 TIME...MOT...LOC 2343Z 308DEG 17KT 3989 8029 TORNADO...OBSERVED MAX HAIL SIZE...1.00 IN $$ -
Upstate/Eastern New York-Springtime?
TheClimateChanger replied to BuffaloWeather's topic in Upstate New York/Pennsylvania
I'd argue that, in light of the new normal, it's really a below average summer. It's 33rd out of 149 years overall, so easily in the top quartile for warmest June 1 to July 31st periods. However, since 2010, only four years have been cooler at BUF - 2013, 2014, 2015, and 2017. Seven have been warmer - 2010, 2011, 2012, 2016, 2018, 2020, and 2021, and one (2019) has been the same. Since 2005, a similar story, with only 6 cooler years (2007, 2009, and the four listed above) versus 10 warmer and one equal year. And 2007 was only a tenth of a degree cooler than this year for the same period. Only 2009 had a mean temperature in the bottom half of all years. -
Really crazy how quick things have heated up in the summertime. I've been warning about this since the 1990s, but even so, to see it come to fruition and play out the way it has over the past 30 years has been sobering. We'll likely be seeing summers approaching and exceeding 80+ in our lifetimes. Just look at this data... Here's the warmest June 1 - July 31st periods on record for Toledo. It's crazy to see how what were once considered very hot summers in my lifetime are now just run of the mill summers. 1991 was 9th hottest on record (out of 128 years) when it occurred. Now it's 20th (out of 150 years). What was once the 9th hottest start to summer on record in Toledo has been surpassed 11 times in the past 32 years (more frequently than once every 3 years). In fact, it's been surpassed every single year since 2019 (2018 was a tenth of a degree cooler). 1995 would have been the 7th hottest start to summer at the time - not relegated to a tie for 14th place. 1999, went from 9th to 17th. These were considered scorching summers when I was younger. It makes you wonder too, whether those heat records of the late 1980s and early 1990s weren't somewhat inflated by the warm-biased HO-83 sensors. Was a big story at the time, especially with the rollout of ASOS in the mid and late 90s. Same story at Cleveland. 1995 has gone from 7th hottest start to summer, all the way down to 13th. What was the 7th hottest in 125 years has been surpassed 6 times in 27 years. 1999 went from a two-way tie for 10th all the way down to a three-way tie for 18th in just 23 years. What was considered a scorching summer at the time has been met or surpassed 9 times in 23 years. Similar story at Canton-Akron, although 1991 is holding up much better (again, wonder how much the HO-83 helped out there?). It's only been surpassed once so far. 1999, on the other hand, went from a two-way tie for 10th place on the hottest starts to summer, all they way to a three-way tie for 18th place. At the time, the 10th hottest summer in 113 years. It's now been met or surpassed 9 times in 23 years. Same story with Detroit. I expanded this one a little further to capture the present year, which places 29th overall - but would have been 16th hottest at the end of the 20th century. And heck a bunch of those hot periods were in my lifetime (1987, 1988, 1991, 1994, 1995, 1999) - several probably somewhat inflated. There were only 11 hotter starts to summer before my time. Just to give you a different perspective, by looking at where this seemingly pedestrian summer would have placed in the not so distant past. Even the early years are probably inflated since they were typically rooftop measurements in high density urban cores. Ironically, climate deniers have shown that rooftop measurements are garbage. And these weren't even taken with fan aspiration, just an old school Stevenson screen. Probably picking up superheated air from the roof and building. Just crazy they act like its warmed a degree, when it's obviously warmed much more than that just in our lifetimes.
-
GFS really liking those state and provincial heat records in early August, especially Minnesota.
-
Long range GFS seems to really be sniffing out the potential heat wave. Obviously, unlikely and a long way out. But it did show 18z GFS temperatures in Michigan peaking at 109F (there were actually several days in a row where parts of the state were at or above 105F) and 106F in Ontario. These are 2 PM EDT temperatures... probably a good chance the high would be 1 or 2 degrees above those readings. All-time record for Michigan is 112F and Ontario 108F, so that's kind of intriguing to see on a 2+ week model. Wonder what it's seeing to come up with such high readings? Prompted to me to check Twitter, but I didn't see any mention of the long range GFS. I did notice a number of Tweets from earlier in the month about the long-range GFS showing 40-42C in the UK. It was way early with the potential, but it actually happened. I'd say that's absolutely incredible that the GFS was able to sniff out the potential of a heat wave shattering the national record weeks in advance, even if the timing was way off. Absolutely astounding, really.
-
Upstate/Eastern New York-Springtime?
TheClimateChanger replied to BuffaloWeather's topic in Upstate New York/Pennsylvania
Klaus Schwab and the World Economic Forum would like to derail your plans for western New York to become a climate refuge. They are promoting an MIT plan to create a Brazil-sized raft of "space bubbles" to blot out about 1.8% of the sun's energy to offset global warming. If something like this comes to fruition, western New York may cool and be 1.8% darker. -
Upstate/Eastern New York-Springtime?
TheClimateChanger replied to BuffaloWeather's topic in Upstate New York/Pennsylvania
Agreed, although I think it may be worse than you think. Given what we've been seeing, which is often worse than what the models show, and factoring in the model projections for the year 2100, looks like there will be a permanent dust bowl over the central and southern Plains. That is to say, conditions akin to those present during the Dust Bowl will just be considered the base climate state as opposed to some extreme deviation from the norm. While the Great Lakes are projected to see precipitation increases, the summer projections show a modest decrease in precipitation - but more importantly, a large increase in the number of consecutive dry days and the number of days with extreme heat (90s, 100s) with the precipitation falling increasingly in occasional torrents - perhaps from tropical disturbances, or slow-moving gullywashers from time to time when the heat breaks. Makes sense with the Hadley cells moving north and expanding - should put much of the CONUS firmly in a region of predominantly sinking air. I imagine agricultural interests will find such conditions quite challenging. Will probably require substantially more irrigation. I just get worried when I see widespread temperatures of 115-118F in the Pacific Northwest, and 100-104F in the UK (north of 50N), which are both heavily marine-influenced climates, but relatively dry in the summertime. What happens when this projected drying expands east into the Plains. There were temperatures up to 120F in the Dust Bowl all the way into the northern Plains. What happens in 2100, with CO2 at 500+, maybe substantially higher, in an already drying climate when a mega drought shows up - do we see temperatures of 130F, 140F, shattering world records? Will it just get so hot that crops simply desiccate and die in the extreme heat, such that no amount of irrigation will be sufficient? -
Looks like the high was at least 79 already.
-
Pittsburgh/Western PA Summer 2022 Discussion
TheClimateChanger replied to Ahoff's topic in Upstate New York/Pennsylvania
HRRR and NAM3k much warmer than the global models tomorrow. Wonder if they will score a coup.


