TheClimateChanger
-
Posts
4,598 -
Joined
-
Last visited
Content Type
Profiles
Blogs
Forums
American Weather
Media Demo
Store
Gallery
Everything posted by TheClimateChanger
-
It's happening, Tip. Buckle in.
-
-
Pittsburgh, Pa Summer 2024 Thread.
TheClimateChanger replied to meatwad's topic in Upstate New York/Pennsylvania
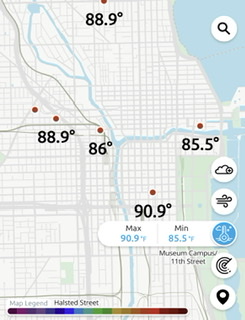
The map on the left is not a believable presentation. It's almost never 3F hotter in Wheeling and Pittsburgh than Columbus and Dayton in this weather pattern - let alone 2F hotter than Charleston. And several degrees hotter than Baltimore, Washington and Philly in the coastal plain. -
Pittsburgh, Pa Summer 2024 Thread.
TheClimateChanger replied to meatwad's topic in Upstate New York/Pennsylvania
The European temperature forecasts in hot summer patterns always seem to be off for this part of the country. Always has a very " warm wintertime" pattern with hot air funneling up the Ohio Valley bringing in temperatures across western Pennsylvania and northern West Virginia which are hotter than places to the west. This is a common temperature pattern in the winter, but almost never happens in the summer. Realistically, to get upper 90s in southwest Pennsylvania, you would want to see low 100s across western/central Ohio and Indiana. Not cooler temperatures in the lower to mid 90s. -
Pittsburgh, Pa Summer 2024 Thread.
TheClimateChanger replied to meatwad's topic in Upstate New York/Pennsylvania
Yeah, I'm going to take the under there. I have to doubt we have daily record highs on 4 of 5 days next week, break the monthly record high, tie the old monthly record high on another day, and have a third day within 1F of the monthly record - all within a 5-day stretch. -
Pittsburgh, Pa Summer 2024 Thread.
TheClimateChanger replied to meatwad's topic in Upstate New York/Pennsylvania
Yes, it would be fairly unusual if the heat pans out. For sh*ts and giggles, I ran out the Accuweather forecast temperatures for Pittsburgh International and came up with a mean of 72.9F. It looked like it was returning more downtown Pittsburgh than the airport, so I re-ran using the forecast for Carnot-Moon and came up with a mean of 72.3F. The NWS point-click forecast centered on PIT would get us to 69.8F by the 18th, which matches what Accuweather shows for Carnot-Moon. Neither of these values are close to the record in the threaded history, but the warmest June at PIT is 1967 with a mean of 73.0F, followed by 72.9F in 1994, 72.6F in 1991, and 72.3F in 1996. June is one month that hasn't had a lot of top tier warmth in recent years. If the Accuweather forecast were to verify, it would be the warmest in about 30 years. Wouldn't normally put too much stock in it, but it tracks the NWS forecast for the next week. And CPC has us in a ridiculous 80-90% chance of above normal in the 8-14 day period (June 19th through 25th). That's about as high as they ever go. -
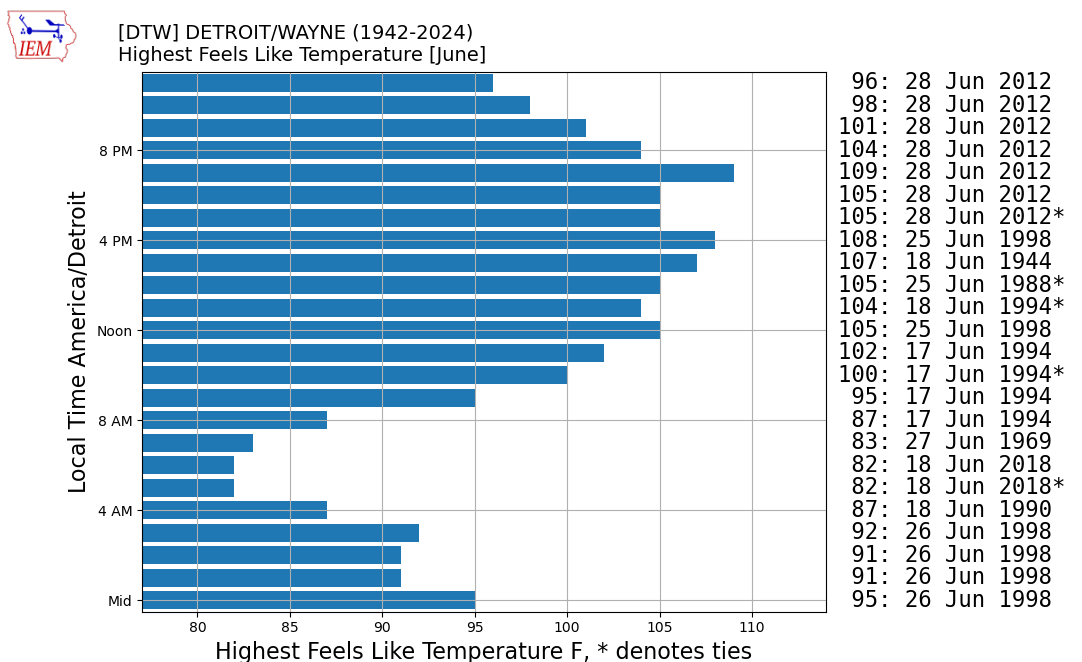
For Detroit, the highest hourly heat index on record back to 1942 for the month of June is 109F on June 28, 2012. So I'm going to have to take the under there.

-
Pittsburgh, Pa Summer 2024 Thread.
TheClimateChanger replied to meatwad's topic in Upstate New York/Pennsylvania
-
Pittsburgh, Pa Summer 2024 Thread.
TheClimateChanger replied to meatwad's topic in Upstate New York/Pennsylvania
I saw a post on Reddit saying the weather hasn't felt like summer in Pittsburgh. Of course, this is patently absurd. It's June 10th, and the first 9 days of June have been 2.2F above normal. It's even more ridiculous when you consider fully 12 ENTIRE summers (JJA) were cooler than the first 9 days of June this year [by far, the coldest part of meteorological summer historically]. 11 of them in the 35 years between 1958 & 1992 (inclusive). So historically at the airport in the late 20th century, roughly 1 in 3 ENTIRE summers were cooler than than the first 9 days of June. Fully 19 summers have been within 0.4F of the first 9 days of June. Some people have a really warped sense of what "normal" is. Even by mean maximum temperatures, there have been several cooler summers and fully 14 that were no more than 0.4F warmer of the first 9 days of June this year. While certainly it would be a cool summer if this happened, historically it would be far from unprecedented for these conditions to persist for an entire summer [including second half of June, all of July and August].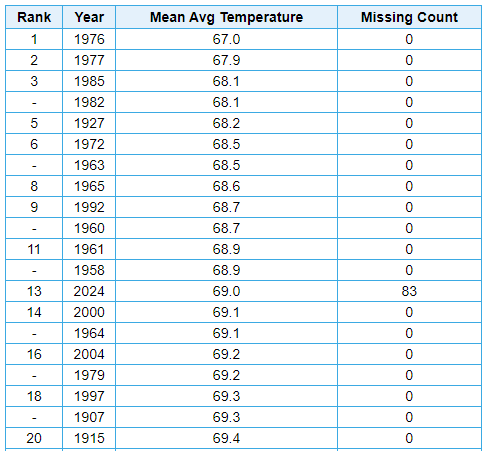
-
Pittsburgh, Pa Summer 2024 Thread.
TheClimateChanger replied to meatwad's topic in Upstate New York/Pennsylvania
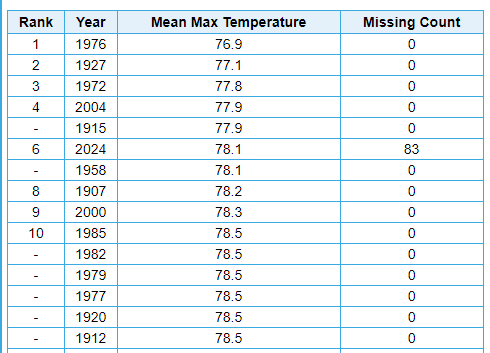
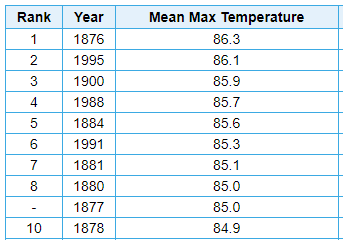
I think it's just a matter of time before we have a record breaking summer, maybe this will be the year? Here's the top 10 by warmest mean temperature. The 19th century data doesn't really jive with the limited data out there from other locations in the region (even considering the change in location). In more recent times from the airport location, 1995 is 5th warmest and 2016 is 8th warmest. Unlike a lot of locations, more recent decades have done somewhat better with average maximum temperature [suggesting some of the early warmth is driven by warm lows]. On this list, 1995 is 2nd; 1988 is 4th; and 1991 is 6th. I do find it a little suspect that in the small era of the defective HO-83 hygrothermometer (mid 1980s to 1995), so many warm maximum temperatures were observed (1987, 1988, 1991, 1993-1995). Regardless, in this era, where lows don't drop and even cold snaps can barely drop below normal, imagine if a 1988 or 1995 type pattern were to set up. Anyways, enjoy the next couple of days. Looks like we might throw up some rare -8 or larger departures.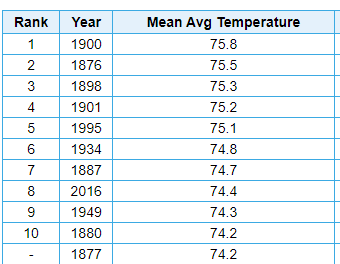
-
Pittsburgh, Pa Summer 2024 Thread.
TheClimateChanger replied to meatwad's topic in Upstate New York/Pennsylvania
What's crazy is I thought for sure at midmonth, we'd be below normal. But looking at the current departure plus the forecast through the 15th, it now looks like we'll be slightly warmer than normal, even before the heat returns. -
Pittsburgh, Pa Summer 2024 Thread.
TheClimateChanger replied to meatwad's topic in Upstate New York/Pennsylvania
In any case, looks like June will finish above normal. I believe that will make twelve consecutive months. -
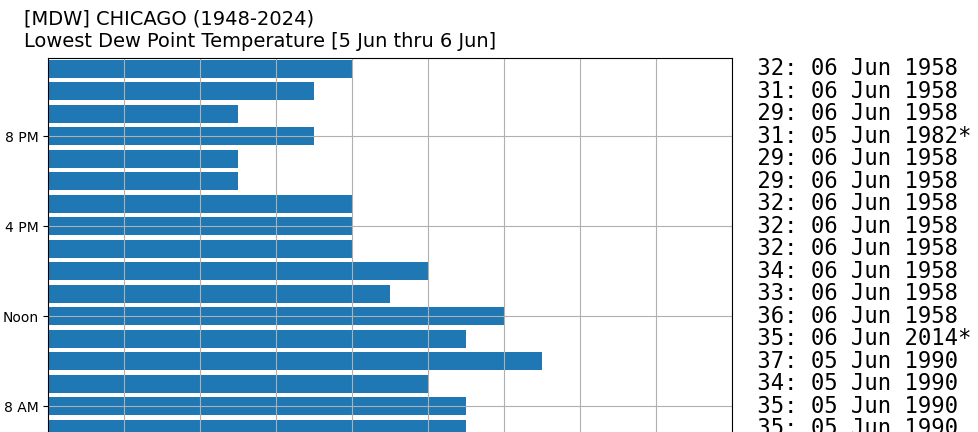
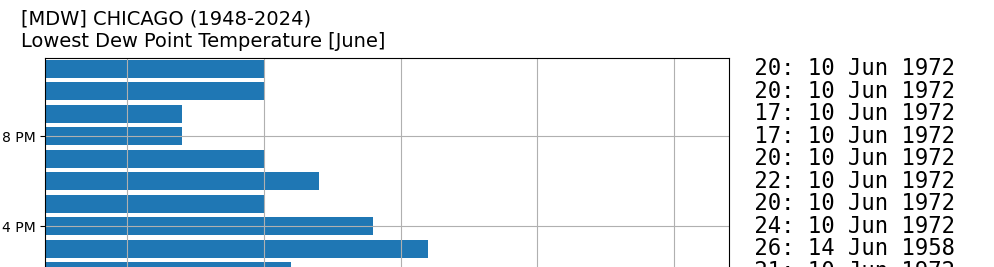
This is from the Iowa Mesonet automated data plotter.
-
Pittsburgh, Pa Summer 2024 Thread.
TheClimateChanger replied to meatwad's topic in Upstate New York/Pennsylvania
-
Dewpoint of 40F at Midway, which is just 4F above the lowest noon local time dewpoint of record on the 6th of June, dating back to 1948. The monthly record low dewpoint in that time period is 17F, from June 10, 1972:
-
Pittsburgh, Pa Summer 2024 Thread.
TheClimateChanger replied to meatwad's topic in Upstate New York/Pennsylvania
-
This is why the change in wet bulb temperature is probably a better measure of the added heat stress from climate change. Dry bulb temperatures have risen, but so have dewpoints. So wet bulb temperature readings would capture both that elevated dry bulb temperature and added absolute humidity.
-
Occasional Thoughts on Climate Change
TheClimateChanger replied to donsutherland1's topic in Climate Change
It is kind of comical that an annual mean temperature that just 30-ish years ago was so astoundingly high that the NWS thought the thermometer was defective is routinely met or exceeded every single year. There's the 1990 & 1991 heat wave on there. While reported as tying the record, 1991 was actually 0.1F cooler than 1931.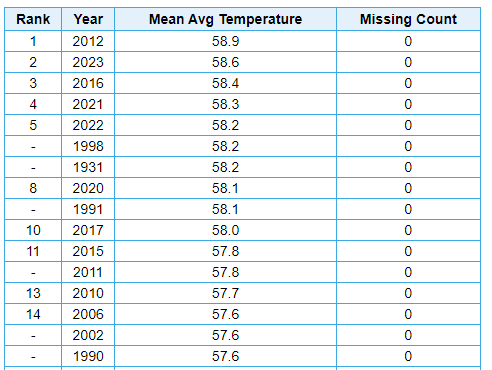
-
Occasional Thoughts on Climate Change
TheClimateChanger replied to donsutherland1's topic in Climate Change
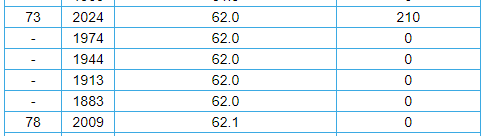
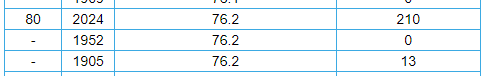
Dude, it's so much hotter today than the 19th century, that we could literally delete the entire summer and just transition from spring to fall and the annual mean would still be in the ballpark of the mean for the entire year from that era. Look, here's Boston. 2024 is already warmer than 1888, 1904, and 1875. We could leap straight from early June to late September, skipping over almost the entirety of June, July, August, and September, and still beat some of those years. Boston is actually a very bad example, because it's been cooler. Look at Atlanta. No June 5-30, July, August, September, or October factored in, and 2024 is already warmer than or as warm as 76 full years! January & February are warmer than November and December. December is roughly between February and March means, November between March & April, October between April & May, June through September hotter than any of the first five months. Without even factoring in June 5 through October, the hottest part of the year in South Florida, Miami's mean for 2024 to date would already place as 48th warmest on record - matching or exceeding 81 full years. Tl;dr: To get to some of the coldest 19th / early-mid 20th century means, we would need to forgo the entire summer and just leap from May into October.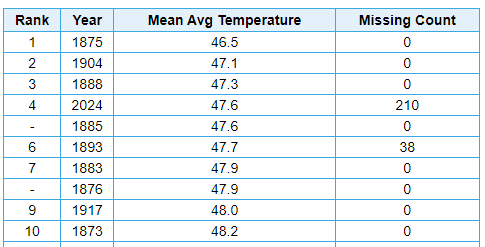
-
Pittsburgh, Pa Summer 2024 Thread.
TheClimateChanger replied to meatwad's topic in Upstate New York/Pennsylvania
Yes, I suspect it finishes somewhat above on the whole. I've read from several sources I trust that the second half of June should be fairly hot. -
Occasional Thoughts on Climate Change
TheClimateChanger replied to donsutherland1's topic in Climate Change
You'd think the Midwest summertime climate change hole would show up in the data for Des Moines. I'm seeing a nearly 8F/century rise since 2001, and a 2.9F/century rise over the past 50 years. Wait until you guys get a load of the Td increases over that same time! Wet bulb temperatures are probably rising at twice the rate of the dry bulb readings. -
Occasional Thoughts on Climate Change
TheClimateChanger replied to donsutherland1's topic in Climate Change
I will grant him that the temperatures from that era were inflated, but not because of asphalt or dirt. The HO-83 hygrothermometer was defective and produced spuriously warm temperatures. -
Occasional Thoughts on Climate Change
TheClimateChanger replied to donsutherland1's topic in Climate Change
Here's another good one from January 1, 1992. "The thermometer may have been placed at times over asphalt or dirt, rather than over grass as it is supposed to be." Meanwhile, the old records were taken on asphalt rooftops. Make it make sense. I wonder what Mr. Hendricksen's excuse would be today, when pretty much every year is as hot or hotter than 1991. -
Occasional Thoughts on Climate Change
TheClimateChanger replied to donsutherland1's topic in Climate Change
Gotta love these oldies, but goodies. Like this passage from the Globe in 1991. You know who was right? Dr. Hansen. Pinatubo did drop global temperatures in 1992 & 1993, and then did rebound to record breaking levels in the 1990s. You know who was wrong? The so-called state climatologist. -
Occasional Thoughts on Climate Change
TheClimateChanger replied to donsutherland1's topic in Climate Change
Just because we're not getting gigantic heat blobs doesn't mean it's not warming at an alarming clip. I responded to "you know who" who was going on about adjustments to the NCEI numbers for Harrisburg, PA. I noticed immediately his alleged adjustments actually cool the recent summertime warming trend. So I pulled up the data for MDT and CXY airports... Since 2001, MDT is warming at +10.4F/century in the summertime; CXY Airport is warming at +17.2F/century in the summertime. This isn't even a cherrypicked start period. There were a lot of warm summers in the early years of this century. 2001 was hot - I remember Korey Stringer passing away at Vikings practice from the heat. 2002 was a ridiculous scorcher, as was 2005. 2006 was mostly hot. I think it reached 121F in South Dakota and was basically a statistical tie with 1936. And if you believe the people on this forum, recent summers haven't been too bad. I realize it's too short of a timeframe to really draw any significant conclusions, but wow. It's like we're boiling frogs. Maybe it's not reaching 120F every summer, but quietly this century, every location is heating up in the summertime and heating up quickly.