

TheClimateChanger
-
Posts
3,186 -
Joined
-
Last visited
Content Type
Profiles
Blogs
Forums
American Weather
Media Demo
Store
Gallery
Everything posted by TheClimateChanger
-
Occasional Thoughts on Climate Change
TheClimateChanger replied to donsutherland1's topic in Climate Change
Here are some interesting tidbits from Blodget's 1857 work "Climatology of the United States and of the temperate latitudes of the North American Continent": The frequent occurrence of snows in April and even in May in the latitude of Washington is a striking phenomenon of the climate. As early as 1755 Richard Brooke, "of Maryland," communicated observations to the Royal Phil. Society in which he remarks of April, 1755, “on the 16th it snowed as hard as ever I knew it to do”; and of the same month in 1757 “the wettest and coldest April within man’s memory”. (Phil. Trans., 1759.) At several instances in recent years a quantity of snow has fallen in April in several instances a foot or more in depth in the interior valleys of Virginia. On April 22d, 1856, a small quantity fell at Washington, and near a foot in depth in Upper Virginia. A remarkable instance of the extension of snows southward at extreme intervals is given by Abiel Holmes of Charleston, S. C., in a paper communicating the results of many years of observations at Charleston to the American Academy. On January 10th, 1800, there fell at Savannah the deepest snow accompanied by the greatest cold ever remembered in Lower Georgia. The snow was three feet deep on a level.” The yearly extremes of temperature for several years are also given by Mr. Holmes, as observed at Charleston. — Memoirs Am. Acad., 1809. +-----------------+-----------------+-----------------+ | Year | Max Temp (°F) | Min Temp (°F) | +-----------------+-----------------+-----------------+ | 1750 | 96 | 25 | | 1751 | 94 | 23 | | 1752 | 101 | 18 | | 1753 | 91 | 28 | | 1754 | 93 | 22 | | 1755 | 90 | 27 | | 1756 | 96 | 26 | | 1757 | 90 | 25 | | 1758 | 94 | 25 | | 1759 | 93 | 27 | | 1791 | 90 | 28 | | 1792 | 96 | 20 | | 1793 | 89 | 30 | | 1794 | 91 | 34 | | 1795 | 92 | 29 | | 1796 | 89 | 17 | | 1797 | 85 | 22 | | 1798 | 88 | 31 | +-----------------+-----------------+-----------------+ On March 6th, 1843, snow fell for fifteen hours at Augusta, Georgia, covering the ground fifteen inches deep. (Holbrook in Am. Alm., 1845.) In this month snow fell over a large area of the States bordering the Gulf, embracing New Orleans and Mobile. Ramsey says (Views of South Carolina, vol. 11, p. 52): “On December 31st, 1790, wind northeast, a severe snow storm began in Charleston which continued twelve hours. In consequence the streets were covered with snow two to four inches deep. Another took place on February 28th, 1790, wind northwest, which continued several hours and covered the ground five or six inches deep. Similar snow storms fell in January 1800, and were then thrice repeated in twenty-three days, amounting in all to more than ten inches. -
Yeah, my magnolia blooms look like they took a hit. Not sure if they will recover and open.
-
Definitely an interesting time to be a weather geek. September 24, 1950 ("Black Sunday") is the third coldest on record at Detroit for that month, with a high of 46F. The Day the Sun Disappeared—September 24, 1950 - Burchfield Penney Art Center Black Sunday: Darkness falls in the PA Wilds - Pennsylvania Wilds And then, of course, November brought the Great Appalachian Storm which produced record-breaking snow for the Appalachians and Ohio Valley. The high of 17F on the 24th, being eclipsed by only three dates, all earlier than 1950 (12F, on 11/21/1880; 16F on 11/22/1880; and 14F on 11/29/1950). I don't know what was going on in 1880 but there were a whole slew of record low maxima. Great Appalachian Storm of 1950 - Wikipedia
-
2025-2026 ENSO
TheClimateChanger replied to 40/70 Benchmark's topic in Weather Forecasting and Discussion
Yeah, that's why I was pointing out those observations. 1816 is known as the "year without a summer" due to the Tambora eruption the year prior. -
Wow!
-
2025-2026 ENSO
TheClimateChanger replied to 40/70 Benchmark's topic in Weather Forecasting and Discussion
While there are other references to a "red sun" - not as frequent as these - strewn throughout the journal. The instances where sunspots were visible to the naked eye are the only instances noted in the entire journal. The sunspot activity might be a bit of a surprise as this was during the height of the Dalton Minimum. However, this does correspond with the maximum for Solar Cycle VI, which occurred in April 1816. So, there must have a fair amount of sunspot activity at that time despite the relative minimum of solar activity. -
2025-2026 ENSO
TheClimateChanger replied to 40/70 Benchmark's topic in Weather Forecasting and Discussion
I was recently reading Leonard Hill's meteorological journal for East Bridgewater, Massachusetts, which extends from 1806-1869. One thing I found interesting was the observations from 1816. Interesting observations: April 28 - "sun red"; April 29 - "sun red"; April 30 - "spots on the sun -- very red"; May 1 - "sun red"; May 5 - "sun red"; May 6 - "spots on sun"; May 18 - "sun red"; May 19 - "red spots on sun"; June 1 - "red sun"; June 21 - "spots on sun; sun red"; August 19 - "spots on sun" We can also see the likely cause of the failed harvest. While the journal probably seems quite a bit colder to us, it looks like most of the weather wasn't too out of the ordinary for the journalist's time. An April with 4" of snow on April 12, that lingers for a few days, with some additional light snows on April 18 & 20, are described as "mild" and "little snow." But we see there was a heavy killing frost on June 10. Afterwards, it seems like crops were progressing okay, albeit perhaps a bit droughty, but in the end of September, a hard freeze struck before the crop was ready probably owing to having been replanted after the June frost? -
2025-2026 ENSO
TheClimateChanger replied to 40/70 Benchmark's topic in Weather Forecasting and Discussion
IMO, in heavy blowing and drifting conditions, the board measurements should always be compared with a number of readings from the ground to ensure it is reasonable - could undercount or overcount depending on the conditions (windspeed, wind direction, surroundings, whether there was already a significant amount of snow on the ground, etc.). -
2025-2026 ENSO
TheClimateChanger replied to 40/70 Benchmark's topic in Weather Forecasting and Discussion
Compare that today, and you get nonsense like this. The board clearing procedure is too difficult for FAA contractors. Extreme Snowfall Reports: How Reliable Are They? | Weather Underground In December 2017, Erie reported 51" of snow in 24 hours, setting a new state record. The record was later disallowed and the numbers adjusted because they were clearing the board hourly and measuring a bunch of snow that was blowing and drifting onto the board. The original measurements had 26.5" of snow falling on December 26, with the depth dropping from 28" on the morning of the 26th to 23" on the morning of the 27th. Now I know fake effect snow sublimates away like crazy, but c'mon. And I know similar errors have taken place at EWR and BWI in the recent past. December 25-27, 2017: See here for the same type of error at BWI: Last Winter's Record Snow Miscalculated At BWI-Marshall - CBS Baltimore -
2025-2026 ENSO
TheClimateChanger replied to 40/70 Benchmark's topic in Weather Forecasting and Discussion
Most historic snow totals are undoubtedly understated. And I would argue that extends even beyond 1980. Here is DuBois, PA for February 1993. Note the depth goes from 0 to 15 inches, even though only 14.0" was recorded as having fallen. It gets even worse when you consider 0.8" of that fell before depth reached zero. So, from February 10 to February 26, the depth increased by 15" even though only 13.2" of snow was recorded. -
So much for that UHI. DTW had a low of 29F on the 5th, versus 39F at FNT and 37F at MBS. Crazy.
-
Nothing like 1950 though. On April 13, the high was 24F at Detroit City Airport and 22F at Flint.
-
Central PA Spring 2025
TheClimateChanger replied to canderson's topic in Upstate New York/Pennsylvania
A frosty 15F at Bradford this morning. The record is 7F from 1972. -
They keep shifting these products earlier and earlier. I like the approach of NWS Nashville. Meanwhile, there are freeze products in effect all the way into central Ohio and Indiana on April 8/9.
-
-
Comparing this to the records from Lansing/East Lansing, Michigan back to January 1, 1864. There is reasonable agreement, although the trend there comes out to about 2.4F/century. Some of that is probably attributable to increased urbanization. Ingham County, Michigan has a population of about 290,000. While KLAN is technically located in mostly rural Clinton County (pop: 79k), it is in the far south in suburban DeWitt Township. At the beginning of this dataset, population was minimal in this region. The nice thing here is all of the data is mean of daily high and low. No data on xMacis for 1872 & 1873, which show up as relatively cool years on my adjusted DBQ data set. Also, no data for 1856 & 1857, which show up as very cold years on my adjusted DBQ data set; however, those years are both well known for extreme cold (even for that era). No significant elevation change since 1863. Through 1910, records are from Michigan Agricultural College (now Michigan State University), then from the WB Office in East Lansing until April 1948 and again from August 1954 through April 1959. All other records are from KLAN [Capital Region International Airport]. Top 20 Coldest Years: 1875 41.7 1885 41.9 1868 42.0 1869 42.3 1883 42.3 1866 42.9 1917 43.2 1904 43.9 1888 44.0 1867 44.1 1895 44.3 1912 44.3 1884 44.4 1924 44.6 1972 44.6 1865 44.7 1893 44.7 1864 44.9 1926 44.9 1978 45.1 Top 20 Warmest Years: 2024 51.8 2012 51.6 2023 51.2 2021 51.1 2016 50.6 1921 50.5 2017 50.4 1931 50.2 1998 50.2 1955 49.9 2022 49.9 1987 49.8 2010 49.8 2020 49.8 1953 49.6 2006 49.5 1949 49.2 2005 49.2 1941 49.1 1938 49.0
-
From my adjusted Dubuque values, I calculate a warming trend of about 1.3F/century. The top 20 coldest years are: Adjusted Annual Mean Temperatures in Dubuque, Iowa (Ordered by Temperature, Lowest to Highest) YEAR | ANNUAL TEMPERATURE (°F) -----|----------------------- 1875 | 41.7 1917 | 42.5 1857 | 42.9 1885 | 43.2 1856 | 43.3 1883 | 43.5 1888 | 43.5 1872 | 43.6 1893 | 43.7 1951 | 43.7 2014 | 43.7 1866 | 43.8 1924 | 43.9 1929 | 44.0 1868 | 44.1 1869 | 44.2 1912 | 44.2 1904 | 44.3 1873 | 44.4 1978 | 44.4 The top 20 warmest years are: Adjusted Annual Mean Temperatures in Dubuque, Iowa (Ordered by Temperature, Highest to Lowest) YEAR | ANNUAL TEMPERATURE (°F) -----|----------------------- 1931 | 51.3 2024 | 51.2 1998 | 50.5 2012 | 50.5 2023 | 50.1 1921 | 49.8 1987 | 49.8 2016 | 49.5 1941 | 49.4 1878 | 49.2 1939 | 49.2 1938 | 49.1 2006 | 49.1 1946 | 49.0 2021 | 49.0 1934 | 48.8 1854 | 48.7 1981 | 48.7 1999 | 48.7 2017 | 48.7
-
Interesting. This inspired me to look to see if I could find a more rural dataset of high quality that could be extended back to that era with minimal adjustment. The candidate I found was Dubuque, Iowa. Dubuque County, Iowa is a mostly rural county with a population of about 99,000 residents. The majority of the population resides in the city of Dubuque, which has a population just under 60k residents. Since February 1951, records have been taken at the Dubuque Regional Airport, which is a small, 2-runway airport well south of the city surrounded by farmland. Prior to February 1951, records were taken in the city by the U.S. Army Signal Corps and, later, the U.S. Weather Bureau. The airport has an elevation of ~1,050 feet, while the city is located at ~640 feet, which introduces a non-climatic bias. Prior to 1873, records were taken by the Horr family in the city of Dubuque back to 1851. Prior to the move to the airport, the thermometer had a rooftop exposure. Since the shift to the airport, temperatures have been collected at ~5 feet above ground. At a standard lapse rate of 3.5F/1000 feet, this elevation gain would be projected to decrease mean temperature by about 1.4F. Comparative data from the city and airport sites show the move resulted in a drop in temperature of about 2.0F, mostly due to the elevation change, but also the move from the city to a rural site and the shift away from a rooftop exposure. While the mean difference was 2.0F, the data do show a wide variation ranging from 1.0F in November to 3.2F in May. However, there does not appear to be any significant seasonal variation. The difference appears to be normally distributed around the mean with no obvious seasonal effect. Jan-52 Feb-51 Mar-51 Apr-51 May-51 Jun-51 Jul-51 Aug-51 Sep-51 Oct-51 Nov-51 Dec-51 City 20.7 22 29.4 44.9 63.6 65.7 71.8 69.5 60.9 52.9 29.3 22.2 46.075 Airport 19 20.6 27.1 43.4 60.4 63.7 69.8 67.9 58.3 50.6 28.3 19.4 44.0416667 Difference 1.7 1.4 2.3 1.5 3.2 2 2 1.6 2.6 2.3 1 2.8 2.03333333 It is possible the difference may have been somewhat less in the 19th century, when Dubuque was very small; however, it is important to note that most of this difference is likely attributable to the change in elevation. In order to create a coherent dataset, the mean of all years prior to 1951 were reduced by 2.0F. The mean for 1951 was reduced by 0.2F [2F divided by 12, since January data was observed at the city office]. Additionally, prior to 1874, data was obtained by the mean of 7 am, 2 pm, and 9 pm readings [consistent with the Smithsonian Institution approach]. From prior experience, this produces a small warming bias (maybe 0.5F or so). The warming bias is most pronounced from about May to July, when the morning reading is well after sunrise. Recall, these predate daylight saving time. In fact, they predate standardized time zones. So, the 7 am observation would actually have been taken some time after 8 am CDT. This also justifies continuation of the larger setback all the way to 1851, even if there was minimal UHI. The raw annual data is given below. Annual Average Temperatures in Dubuque, Iowa (1851–2024) YEAR | ANNUAL TEMPERATURE (°F) -----|----------------------- 1851 | 48.8 1852 | 48.9 1853 | 50.7 1854 | 48.2 1855 | 45.3 1856 | 44.9 1857 | 48.4 1858 | 48.0 1859 | 48.0 1860 | 49.7 1861 | 46.6 1862 | 48.0 1863 | 48.9 1864 | 48.3 1865 | 47.1 1866 | 46.1 1867 | 49.5 1868 | 48.5 1869 | 48.5 1870 | 45.6 1871 | 45.6 1872 | 45.6 1873 | 45.6 1874 | 48.9 1875 | 43.7 1876 | 47.6 1877 | 49.9 1878 | 51.2 1879 | 48.8 1880 | 49.4 1881 | 49.1 1882 | 48.3 1883 | 45.5 1884 | 47.3 1885 | 45.2 1886 | 47.3 1887 | 47.4 1888 | 45.5 1889 | 48.7 1890 | 48.5 1891 | 46.3 1892 | 47.5 1893 | 46.6 1894 | 50.6 1895 | 48.6 1896 | 49.6 1897 | 48.0 1898 | 48.1 1899 | 48.0 1900 | 49.4 1901 | 48.7 1902 | 48.1 1903 | 47.4 1904 | 46.3 1905 | 47.6 1906 | 48.7 1907 | 47.2 1908 | 49.2 1909 | 47.5 1910 | 48.6 1911 | 49.5 1912 | 46.2 1913 | 49.9 1914 | 49.1 1915 | 48.1 1916 | 47.8 1917 | 44.5 1918 | 48.6 1919 | 48.5 1920 | 47.8 1921 | 51.8 1922 | 49.7 1923 | 48.6 1924 | 45.9 1925 | 48.2 1926 | 47.1 1927 | 48.6 1928 | 49.0 1929 | 46.0 1930 | 49.4 1931 | 53.3 1932 | 48.6 1933 | 50.2 1934 | 50.8 1935 | 48.3 1936 | 48.0 1937 | 47.6 1938 | 51.1 1939 | 51.2 1940 | 48.1 1941 | 51.4 1942 | 49.1 1943 | 47.8 1944 | 49.5 1945 | 47.7 1946 | 51.0 1947 | 48.9 1948 | 49.3 1949 | 50.0 1950 | 46.6 1951 | 43.9 1952 | 47.4 1953 | 48.3 1954 | 48.1 1955 | 47.3 1956 | 47.2 1957 | 46.6 1958 | 45.7 1959 | 45.4 1960 | 45.4 1961 | 46.3 1962 | 46.2 1963 | 47.5 1964 | 47.5 1965 | 46.0 1966 | 45.8 1967 | 45.5 1968 | 46.8 1969 | 45.4 1970 | 46.3 1971 | 46.6 1972 | 44.5 1973 | 48.4 1974 | 46.0 1975 | 46.3 1976 | 45.4 1977 | 46.5 1978 | 44.4 1979 | 44.6 1980 | 47.3 1981 | 48.7 1982 | 46.6 1983 | 47.5 1984 | 47.4 1985 | 45.1 1986 | 48.8 1987 | 47.7 1988 | 47.4 1989 | 45.4 1990 | 48.5 1991 | 48.2 1992 | 46.6 1993 | 46.0 1994 | 46.9 1995 | 46.3 1996 | 44.5 1997 | 46.0 1998 | 50.5 1999 | 48.7 2000 | 47.4 2001 | 48.1 2002 | 48.1 2003 | 46.5 2004 | 47.5 2005 | 48.3 2006 | 49.1 2007 | 47.8 2008 | 45.0 2009 | 45.6 2010 | 47.8 2011 | 47.6 2012 | 50.5 2013 | 45.2 2014 | 43.7 2015 | 48.0 2016 | 49.5 2017 | 47.1 2018 | 46.1 2019 | 43.3 2020 | 48.0 2021 | 49.0 2022 | 47.0 2023 | 50.1 2024 | 51.2 The adjusted yearly means are given below. Annual Average Temperatures in Dubuque, Iowa (1851–2024) YEAR | ANNUAL TEMPERATURE (°F) -----|----------------------- 1851 | 46.8 1852 | 44.9 1853 | 46.2 1854 | 48.7 1855 | 46.2 1856 | 43.3 1857 | 42.9 1858 | 46.4 1859 | 46.0 1860 | 47.7 1861 | 45.7 1862 | 44.6 1863 | 46.0 1864 | 44.9 1865 | 46.3 1866 | 43.8 1867 | 45.1 1868 | 44.1 1869 | 44.2 1870 | 47.5 1871 | 46.5 1872 | 43.6 1873 | 44.4 1874 | 46.9 1875 | 41.7 1876 | 45.6 1877 | 47.9 1878 | 49.2 1879 | 46.8 1880 | 47.4 1881 | 47.1 1882 | 46.3 1883 | 45.5 1884 | 45.3 1885 | 43.2 1886 | 45.3 1887 | 45.4 1888 | 43.5 1889 | 46.7 1890 | 46.5 1891 | 46.3 1892 | 44.6 1893 | 43.7 1894 | 48.6 1895 | 46.6 1896 | 47.6 1897 | 46.0 1898 | 46.1 1899 | 46.0 1900 | 47.4 1901 | 46.7 1902 | 46.1 1903 | 45.4 1904 | 44.3 1905 | 46.6 1906 | 47.6 1907 | 45.2 1908 | 47.2 1909 | 45.5 1910 | 46.6 1911 | 47.5 1912 | 44.2 1913 | 47.9 1914 | 47.1 1915 | 46.1 1916 | 45.8 1917 | 42.5 1918 | 46.6 1919 | 46.5 1920 | 45.8 1921 | 49.8 1922 | 47.7 1923 | 46.6 1924 | 43.9 1925 | 46.2 1926 | 45.1 1927 | 46.6 1928 | 47.0 1929 | 44.0 1930 | 47.4 1931 | 51.3 1932 | 46.6 1933 | 48.2 1934 | 48.8 1935 | 46.3 1936 | 46.0 1937 | 45.6 1938 | 49.1 1939 | 49.2 1940 | 46.1 1941 | 49.4 1942 | 47.1 1943 | 45.8 1944 | 47.5 1945 | 45.7 1946 | 47.9 1947 | 46.9 1948 | 47.3 1949 | 48.0 1950 | 44.6 1951 | 43.7 1952 | 47.4 1953 | 48.3 1954 | 48.1 1955 | 47.3 1956 | 47.2 1957 | 46.6 1958 | 45.7 1959 | 45.4 1960 | 45.4 1961 | 46.3 1962 | 46.2 1963 | 47.5 1964 | 47.5 1965 | 46.0 1966 | 45.8 1967 | 45.5 1968 | 46.8 1969 | 45.4 1970 | 46.3 1971 | 46.6 1972 | 44.5 1973 | 48.4 1974 | 46.0 1975 | 46.3 1976 | 45.4 1977 | 46.5 1978 | 44.4 1979 | 44.6 1980 | 47.3 1981 | 48.7 1982 | 46.6 1983 | 47.5 1984 | 47.4 1985 | 45.1 1986 | 48.8 1987 | 47.7 1988 | 47.4 1989 | 45.4 1990 | 48.5 1991 | 48.2 1992 | 46.6 1993 | 46.0 1994 | 46.9 1995 | 46.3 1996 | 44.5 1997 | 46.0 1998 | 50.5 1999 | 48.7 2000 | 47.4 2001 | 48.1 2002 | 48.1 2003 | 46.5 2004 | 47.5 2005 | 48.3 2006 | 49.1 2007 | 47.8 2008 | 45.0 2009 | 45.6 2010 | 47.8 2011 | 47.6 2012 | 50.5 2013 | 45.2 2014 | 43.7 2015 | 48.0 2016 | 49.5 2017 | 47.1 2018 | 46.1 2019 | 43.3 2020 | 48.3 2021 | 49.0 2022 | 47.0 2023 | 50.1 2024 | 51.2
-
-
Here is the same dataset sorted by percentage of normal snowfall. A few comments... most of the zeros are locations that receive little, if any, snowfall. The exception is Concordia, KS, which averages 19.0" through April 3, but has received only a trace. Eureka and Fresno, in California, are shown as 0 here, but they don't average any snowfall during the year [so it's really an undefined value]. Bakersfield, California apparently averages 0.1" per year, so that is a true 0% [although not particularly significant]. Savannah, Georgia averages 0 snowfall, but has received 1.1" this winter, so I have displayed its percentage of normal as "infinite." This would also be the case for New Orleans and a few locations in northern Florida, but they don't regularly report seasonal snowfall and therefore are not included. Edit: The Concordia, KS result appears to be due to missing snowfall reports this winter. The Climate Report does reflect these values, but it looks like snowfall wasn't observed. Most locations in Kansas, including nearby Topeka, were slightly above the normal snowfall. City Name State Percentage of Normal CONCORDIA KS 0.00 JACKSON/THOMPSON MS 0.00 DESERT ROCK-MERCURY NV NV 0.00 Waco TX 0.00 MERIDIAN/KEY FIELD MS 0.00 LAS VEGAS/MCCARRAN NV 0.00 CORPUS CHRISTI TX 0.00 BAKERSFIELD/MEADOWS CA 0.00 FRESNO AIR TERMINAL CA 0.00 EUREKA CA 0.00 LUBBOCK INTL ARPT TX 14.49 GRAND JUNCTION CO 16.57 ASHEVILLE_MUNICIPAL_(ASOS) NC 18.63 ALBUQUERQUE INTL NM 22.08 Moline IL 23.30 GREENVILLE/SPARTANB SC 28.21 ABILENE MUNICIPAL TX 28.57 CASPER/NATRONA INTL WY 30.94 MANSFIELD OH 31.66 CHARLOTTE/DOUGLAS_(ASOS) NC 34.29 PHILADELPHIA INTL PA 35.37 TOLEDO OH 35.54 SALT LAKE CITY INTL UT 36.71 ISLIP/MACARTHUR NY 37.26 SIOUX FALLS SD 39.71 DES MOINES IA 40.51 MOBRIDGE SD 40.78 DUBUQUE IA 42.54 HARTFORD/BRADLEY CT 42.72 PROVIDENCE/GREEN RI 43.21 WILLIAMSPORT PA 43.47 NEWARK INTL AIRPORT NJ 43.59 NEW YORK CITY NY 43.73 Blacksburg VA 44.03 PEORIA IL 44.19 MADISON WI 44.65 FORT WAYNE IN 44.85 RENO/CANNON INTL NV 44.88 Waterloo IA 45.48 ELKO NV 45.79 PIERRE SD 46.15 ROCKFORD IL 46.98 NEW YORK/JF KENNEDY NY 47.06 CHICAGO O HARE IL 47.06 WORCESTER (AMOS) MA 47.34 ROCHESTER MN 47.39 ROSWELL/INDUSTRIAL NM 47.92 MASON CITY IA 48.32 LINCOLN NE 49.40 WILMINGTON AIRPORT DE 49.75 NORTH PLATTE NE 49.81 BISMARCK ND 49.89 LA CROSSE WI 51.37 NEW YORK/LA GUARDIA NY 52.20 HARRISBURG PA PA 52.70 COLUMBUS OH 53.24 GRAND_FORKS ND 53.52 HURON SD 53.54 ROMEOVILLE/CHI IL 54.01 TRENTON/MERCER CO. NJ 54.20 ALLENTOWN-BETHLEHEM PA 54.27 SIOUX CITY IA 54.55 Bridgeport/Sikorsky CT 54.71 WINNEMUCCA MUNI NV 55.17 CONCORD MUNICIPAL NH 55.32 GLASGOW INTL ARPT MT 55.70 CLEVELAND OH 55.92 ABERDEEN SD 57.03 ROANOKE MUNICIPAL VA 57.14 FARGO ND 58.25 BOSTON/LOGAN INTL MA 58.54 SOUTH BEND IN 59.81 Minneapolis NWS MN 59.88 FLAGSTAFF (AMOS) AZ 60.26 MINNEAPOLIS MN 60.87 DETROIT/WAYNE MI 61.42 Rapid City SD 62.21 MILWAUKEE WI 64.26 WICHITA FALLS/SHEP TX 64.52 EAU CLAIRE WI 64.59 Omaha - Valley NE 64.92 WILKES-BARRE/SCRANT PA 64.94 ANCHORAGE AK AK 65.09 SISSETON SD 65.18 CHEYENNE/WARREN AFB WY 65.18 DULUTH MN 65.28 SPOKANE INTL ARPT WA 65.40 OKLAHOMA CITY(AWOS) OK 65.67 BALTIMORE/WASH INTL MD 65.80 YOUNGSTOWN OH 66.67 OMAHA/EPPLEY NE 66.67 SCOTTSBLUFF NE 67.12 Grand Forks NWS ND 68.11 SAGINAW MI 68.72 GREENSBORO/PIEDMONT_(ASOS) NC 69.01 SPRINGFIELD IL 69.91 Gray NWS ME 71.82 ST. CLOUD MN 71.85 ELY/YELLAND FLD NV 72.48 Lincoln NWS IL 73.58 WASHINGTON/DULLES VA 74.16 ALBANY COUNTY ARPT NY 74.39 NORFOLK NE 75.00 Akron / Canton OH 76.20 LANSING MI 77.25 BOISE MUNICIPAL ID 77.71 PITTSBURGH INTL PA 77.88 FLINT MI 78.24 BANGOR INTL ARPT ME 79.22 PORTLAND INTL JET ME 79.85 INDIANAPOLIS IN 80.71 WATERTOWN SD 80.77 ATLANTIC CITY INTL NJ 80.81 PENDLETON MUNICIPAL OR 80.89 GRAND ISLAND NE 81.06 INTERNTNL FALLS MN 82.58 BUFFALO INTL ARPT NY 82.66 GREEN BAY WI 83.33 COLUMBIA METRO SC 83.33 GRAND RAPIDS MI 83.82 HAVRE (AMOS) MT 84.11 DANVILLE REGIONAL VA 84.21 GREAT FALLS INTL MT 84.35 BRISTOL/TRI-CITY TN 86.81 RHINELANDER WI 86.99 ROCHESTER/MONROE CO NY 87.04 LANDER/HUNT FIELD WY 87.26 HASTINGS NE 87.87 MUSKEGON MI 88.81 DAYTON OH 89.07 CARIBOU MUNICIPAL ME 89.33 BURLINGTON INTL VT 89.54 SYRACUSE/HANCOCK NY 89.62 BECKLEY MEMORIAL WV 90.13 LEWISTON (AMOS) ID 91.34 WAUSAU WI 91.79 RALEIGH-DURHAM_(ASOS) NC 92.31 AMARILLO ARPT(AWOS) TX 94.58 Marquette MI 94.73 BINGHAMTON/BROOME NY 95.56 CHARLESTON/KANAWHA WV 95.82 ELKINS/RANDOLPH FLD WV 98.06 VALENTINE NE 98.29 ALPENA MI 100.42 ALAMOSA MUNI(AWOS) CO 102.08 BLUEFIELD/MERCER CO WV 102.65 DODGE CITY KS KS 102.70 HELENA REGIONAL MT 103.47 PADUCAH/BARKLEY KY 106.74 LYNCHBURG/P. GLENN VA 107.83 Fairbanks AK 108.35 WASHINGTON/NATIONAL VA 108.76 ERIE INTL AIRPORT PA 109.19 BOWLING GREEN KY 111.90 ST. LOUIS MO 112.73 COLUMBIA MO 113.41 CHATTANOOGA/LOVELL TN 113.89 BILLINGS/LOGAN INTL MT 115.40 GOODLAND KS 118.89 KANSAS CITY/INTL MO 122.22 JACKSON/J. CARROLL KY 124.68 PUEBLO MEMORIAL(AW) CO 125.30 CINCINNATI/COVINGTO KY 127.39 HOUGHTON LAKE MI 129.95 HUNTINGTON/TRI STAT WV 131.12 RICHMOND/BYRD FIELD VA 132.95 BIRMINGHAM MUNI AL 142.86 WICHITA KS 144.44 CLAYTON MUNI(AMOS) NM 152.66 LEXINGTON/BLUEGRASS KY 161.81 DALLAS/FT WORTH TX 162.50 KNOXVILLE MUNICIPAL TN 163.04 COLORADO SPRINGS CO 168.89 LOUISVILLE/STANDIFO KY 170.68 TOPEKA (TOP) KS 171.18 SAULT STE MARIE MI 175.38 EVANSVILLE IN 175.93 TUPELO/C.D. LEMONS MS 193.33 WALLOPS ISLAND STN VA 229.27 MEDFORD/JACKSON CO. OR 267.65 LITTLE ROCK/ADAMS AR 268.42 NORFOLK INTL ARPT VA 270.97 SALISBURY REGIONAL MD 273.08 WILMINGTON/NEW_HAN_(ASOS) NC 288.89 Memphis TN 289.29 NORTH LITTLE ROCK AR 300.00 MEMPHIS INTL ARPT TN 337.04 AUGUSTA/BUSH FIELD GA 337.50 CHARLESTOWN MUNI SC 833.33 MOBILE/BATES FIELD AL 3750.00 SAVANNAH MUNICIPAL GA Infinite
-
Oh, that's brilliant. I didn't know they had these maps. I downloaded the data in a .csv format. City Name State Seasonal Snowfall Departure CASPER/NATRONA INTL WY -41.3 WORCESTER (AMOS) MA -37.6 FLAGSTAFF (AMOS) AZ -33.7 MANSFIELD OH -32.6 SALT LAKE CITY INTL UT -31.2 CONCORD MUNICIPAL NH -29.4 HARTFORD/BRADLEY CT -29.1 DULUTH MN -28.3 MADISON WI -27.4 CLEVELAND OH -27.2 Moline IL -27.0 ROCHESTER MN -26.2 ANCHORAGE AK AK -25.9 SOUTH BEND IN -25.6 SIOUX FALLS SD -24.6 DUBUQUE IA -23.5 TOLEDO OH -23.4 BISMARCK ND -23.2 Gray NWS ME -22.6 YOUNGSTOWN OH -21.9 MASON CITY IA -21.5 LA CROSSE WI -21.3 GRAND_FORKS ND -21.1 DES MOINES IA -21.0 ELKO NV -20.6 PROVIDENCE/GREEN RI -20.5 Waterloo IA -20.5 Minneapolis NWS MN -20.1 FARGO ND -20.0 BOSTON/LOGAN INTL MA -19.9 WILLIAMSPORT PA -19.9 CHICAGO O HARE IL -19.8 ISLIP/MACARTHUR NY -19.7 ROCKFORD IL -19.3 CONCORDIA KS -19.0 MINNEAPOLIS MN -18.9 HURON SD -18.4 EAU CLAIRE WI -18.2 FORT WAYNE IN -18.2 NEWARK INTL AIRPORT NJ -17.6 PIERRE SD -17.5 CHEYENNE/WARREN AFB WY -17.2 DETROIT/WAYNE MI -16.9 ABERDEEN SD -16.8 MILWAUKEE WI -16.8 GLASGOW INTL ARPT MT -16.7 MOBRIDGE SD -16.7 NEW YORK CITY NY -16.6 BUFFALO INTL ARPT NY -16.2 Rapid City SD -16.1 WILKES-BARRE/SCRANT PA -15.6 SIOUX CITY IA -15.5 SPOKANE INTL ARPT WA -15.5 ALLENTOWN-BETHLEHEM PA -15.0 ROMEOVILLE/CHI IL -14.9 Bridgeport/Sikorsky CT -14.9 BANGOR INTL ARPT ME -14.9 ALBANY COUNTY ARPT NY -14.8 PHILADELPHIA INTL PA -14.8 Grand Forks NWS ND -14.7 SAGINAW MI -14.7 PEORIA IL -14.4 NEW YORK/LA GUARDIA NY -14.1 GRAND JUNCTION CO -14.1 HARRISBURG PA PA -14.0 Blacksburg VA -13.6 NEW YORK/JF KENNEDY NY -13.5 PORTLAND INTL JET ME -13.4 NORTH PLATTE NE -13.3 ELY/YELLAND FLD NV -13.1 COLUMBUS OH -13.0 SYRACUSE/HANCOCK NY -13.0 ROCHESTER/MONROE CO NY -12.9 LINCOLN NE -12.6 GRAND RAPIDS MI -12.3 ST. CLOUD MN -12.3 SCOTTSBLUFF NE -12.2 TRENTON/MERCER CO. NJ -12.0 CARIBOU MUNICIPAL ME -11.8 INTERNTNL FALLS MN -11.6 RENO/CANNON INTL NV -11.3 LANSING MI -11.1 Akron / Canton OH -10.9 FLINT MI -10.9 SISSETON SD -10.9 Omaha - Valley NE -10.7 WILMINGTON AIRPORT DE -10.1 MUSKEGON MI -9.6 PITTSBURGH INTL PA -9.6 Marquette MI -9.5 RHINELANDER WI -9.2 WINNEMUCCA MUNI NV -9.1 BURLINGTON INTL VT -8.8 GREAT FALLS INTL MT -8.7 LANDER/HUNT FIELD WY -8.7 OMAHA/EPPLEY NE -8.7 GREEN BAY WI -8.6 ASHEVILLE_MUNICIPAL_(ASOS) NC -8.3 WATERTOWN SD -7.0 NORFOLK NE -7.0 BALTIMORE/WASH INTL MD -6.6 SPRINGFIELD IL -6.5 ROANOKE MUNICIPAL VA -6.3 HAVRE (AMOS) MT -6.1 ALBUQUERQUE INTL NM -6.0 LUBBOCK INTL ARPT TX -5.9 BECKLEY MEMORIAL WV -5.4 WASHINGTON/DULLES VA -5.4 Lincoln NWS IL -5.1 ROSWELL/INDUSTRIAL NM -5.0 GRAND ISLAND NE -5.0 INDIANAPOLIS IN -4.9 WAUSAU WI -4.8 BOISE MUNICIPAL ID -3.9 BINGHAMTON/BROOME NY -3.7 ATLANTIC CITY INTL NJ -3.3 HASTINGS NE -3.3 PENDLETON MUNICIPAL OR -3.0 GREENVILLE/SPARTANB SC -2.8 DAYTON OH -2.7 ABILENE MUNICIPAL TX -2.5 OKLAHOMA CITY(AWOS) OK -2.3 CHARLOTTE/DOUGLAS_(ASOS) NC -2.3 GREENSBORO/PIEDMONT_(ASOS) NC -2.2 ELKINS/RANDOLPH FLD WV -1.3 CHARLESTON/KANAWHA WV -1.3 BRISTOL/TRI-CITY TN -1.2 DANVILLE REGIONAL VA -1.2 WICHITA FALLS/SHEP TX -1.1 LEWISTON (AMOS) ID -1.1 JACKSON/THOMPSON MS -1.0 AMARILLO ARPT(AWOS) TX -0.9 DESERT ROCK-MERCURY NV NV -0.9 Waco TX -0.6 MERIDIAN/KEY FIELD MS -0.6 VALENTINE NE -0.5 RALEIGH-DURHAM_(ASOS) NC -0.4 LAS VEGAS/MCCARRAN NV -0.2 CORPUS CHRISTI TX -0.2 COLUMBIA METRO SC -0.2 BAKERSFIELD/MEADOWS CA -0.1 FRESNO AIR TERMINAL CA 0.0 EUREKA CA 0.0 ALPENA MI 0.3 ALAMOSA MUNI(AWOS) CO 0.5 CHATTANOOGA/LOVELL TN 0.5 DODGE CITY KS KS 0.5 BIRMINGHAM MUNI AL 0.6 PADUCAH/BARKLEY KY 0.6 LYNCHBURG/P. GLENN VA 0.9 BLUEFIELD/MERCER CO WV 0.9 DALLAS/FT WORTH TX 1.0 BOWLING GREEN KY 1.0 SAVANNAH MUNICIPAL GA 1.1 WASHINGTON/NATIONAL VA 1.2 HELENA REGIONAL MT 1.2 TUPELO/C.D. LEMONS MS 1.4 WILMINGTON/NEW_HAN_(ASOS) NC 1.7 AUGUSTA/BUSH FIELD GA 1.9 ST. LOUIS MO 2.1 COLUMBIA MO 2.2 CHARLESTOWN MUNI SC 2.2 KNOXVILLE MUNICIPAL TN 2.9 RICHMOND/BYRD FIELD VA 2.9 KANSAS CITY/INTL MO 4.0 GOODLAND KS 5.1 Fairbanks AK 5.1 Memphis TN 5.3 WICHITA KS 5.6 MEDFORD/JACKSON CO. OR 5.7 JACKSON/J. CARROLL KY 5.7 HUNTINGTON/TRI STAT WV 6.1 CINCINNATI/COVINGTO KY 6.3 MEMPHIS INTL ARPT TN 6.4 PUEBLO MEMORIAL(AW) CO 6.4 LITTLE ROCK/ADAMS AR 6.4 MOBILE/BATES FIELD AL 7.3 NORTH LITTLE ROCK AR 7.6 BILLINGS/LOGAN INTL MT 7.7 EVANSVILLE IN 8.2 LEXINGTON/BLUEGRASS KY 8.9 LOUISVILLE/STANDIFO KY 9.4 ERIE INTL AIRPORT PA 9.4 NORFOLK INTL ARPT VA 10.6 WALLOPS ISLAND STN VA 10.6 CLAYTON MUNI(AMOS) NM 10.9 TOPEKA (TOP) KS 12.1 SALISBURY REGIONAL MD 13.5 COLORADO SPRINGS CO 18.6 HOUGHTON LAKE MI 18.6 SAULT STE MARIE MI 85.4
-
The Philadelphia "normal" was based on the mean of 44 years. We had plenty of data then.
-
Chicago Weather Records Tracking
TheClimateChanger replied to Chicago Storm's topic in Lakes/Ohio Valley
Limiting the analysis to O'Hare records and including all the way back to 1958-59 [well before it became the official observation site], this would be the lowest tally on record at that location. The 10.4" figure for 1997-1998 is missing a number of days. Actual snowfall that winter was 29.6 inches. Interestingly, 3 of the 4 lowest seasonal totals since 1958-59 were the last three winters. -
Chicago Weather Records Tracking
TheClimateChanger replied to Chicago Storm's topic in Lakes/Ohio Valley
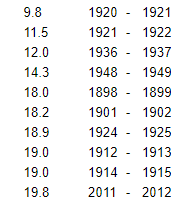
Haven't really been keeping up with this, but 2024-2025 still on pace for a top 5 finish. Current tally is 17.6 inches, giving a 0.4" cushion on current #5, a 0.6" cushion on #6 and 1.3" on #7. In any case, unless 2.2" falls, it will be the lowest official amount since 1948-49.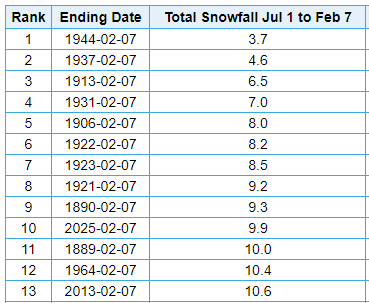
-
Not the same. Even in colonial times, they had fireplaces to keep warm. And it cost nothing to make a fire.

