jwilson
-
Posts
1,231 -
Joined
-
Last visited
Content Type
Profiles
Blogs
Forums
American Weather
Media Demo
Store
Gallery
Everything posted by jwilson
-
Western Pa / Pittsburgh area Winter Discussion ❄️☃️
jwilson replied to north pgh's topic in Upstate New York/Pennsylvania
Wow, the 12Z NAM doesn't back off. That's incredible. The last time I remember the NAM scoring a coup was 2016, when it was north of all of globals, then with 24-36 hours left, all the globals came north to the NAM. I'm not buying just yet, but I've got my wallet out. Even with the Ferrier correction on the 3K, Pittsburgh metro gets a foot. It shifts the jackpot from Harrisburg to Lock Haven, which isn't insignificant (about 70 miles). If PIT gets under the CCB as it forms along the axis, it could happen, but that's relying on a very specific feature. -
Western Pa / Pittsburgh area Winter Discussion ❄️☃️
jwilson replied to north pgh's topic in Upstate New York/Pennsylvania
Basically the "dry conveyor belt" as the low pressure center begins to mature and occlude, forming that traditional "comma" shape. You can look at a comma and see how there's a natural space between the head and the tail. -
Western Pa / Pittsburgh area Winter Discussion ❄️☃️
jwilson replied to north pgh's topic in Upstate New York/Pennsylvania
So I was checking out the 3K NAM at 6Z which is a pretty decent hit (visualized) for PIT. We wet bulb around 1 PM tomorrow and have decent lift in the DGZ for the first few hours. Then we wax and wane, transitioning to a loss of consistent lift there. Until ~05Z (which would be around midnight) when we hit maximum lift in the DGZ due to the CCB. So many acronyms, I'm sorry. Unfortunately, it doesn't last long, and the best rates appear to diminish quickly as the heaviest band moves hurriedly to the east. If you're a snow watcher, that means the best rates will be in the dark, though the onset of precip doesn't look bad. The heaviest stuff barely avoids PIT metro for a while and looks to bury Westmoreland/Armstrong/Indiana counties, for example. I suppose that's not unusual. There's also a time between 7 and 9 PM where PIT gets very close to sleeting due to southeasterlies above the surface, brought on by (I believe) extreme frontogenesis. This also kills the lift in the DGZ for a little so there might be a minor lull in snowfall rates. This is extreme over-analysis of one run, but it gives a bit more detail about one possibility as to what could occur. Glossary - DGZ - Dendritic Growth Zone (upper atmosphere where snowflake growth is achieved most efficiently; see graphic below) CCB - Cold Conveyor Belt (an aspect of "occlusion" that transports cool, moist air westward around the center of low pressure; "comma head") -
The GFS was the last one to hang onto SE PA, and with the 6Z it took that away to some degree. Seems Mt. Holly needs to adjust their forecasts badly. I still can't tell if Scranton or Harrisburg will jackpot. Maybe both?
-
Western Pa / Pittsburgh area Winter Discussion ❄️☃️
jwilson replied to north pgh's topic in Upstate New York/Pennsylvania
The 0Z NAM isn't really any further NW, and in fact keeps colder thermal profiles for places like Philly and NJ, but it creates a massive CCB that dumps snow over the entire middle of the state (which attempts to reach out here). Kind of a crazy look. I know the clown maps will be overdone, but I'll laugh at them anyway like a mad scientist. -
Haha, you're not alone so don't worry about it. I might chase this one, but I'm still hesitant with the eventual northward jog. I agree with others and think this is going to end up a heavy sleet storm, at least for a while, from my normal locale in Southeast Montco. This is the kind of storm I remember from childhood that was also a bit of a loser for my area and much better up in places like the Lehigh Valley. Maybe the confluence can win out, but I'm not super confident in that with the relatively marginal cold. 2009 this is not.
-
Does the GFS, et al. still have trouble parsing snowfall from sleet? In other words, do those clown maps take into account sleet accumulation, as well, or are they measuring strictly what it perceives as snow per local soundings? I would imagine the mesoscale models do a better job at handling that differentiation, but that's a hard guess on my part.
-
Western Pa / Pittsburgh area Winter Discussion ❄️☃️
jwilson replied to north pgh's topic in Upstate New York/Pennsylvania
I've seen the NAM overamped before, but this is taking it to another level. It is on its own so really it can't be trusted, especially with the GFS and Euro being as relatively consistent as they've been. I do think the GFS will jog a bit more northwest before the event. Enough to save a fringe job? I don't know. 3-6" might be a fine "catch all" and if it overperforms, so be it. -
Western Pa / Pittsburgh area Winter Discussion ❄️☃️
jwilson replied to north pgh's topic in Upstate New York/Pennsylvania
It's amazing to see how far apart the NAM and another meso model like the RGEM are in placement. I don't know that I've seen such a difference when considering the time frame. This is more instinct than anything, but I'm getting the sense this is modeled as an overperformer for certain eastern metro/urban areas. It is screaming sleet storm to me with a warm-water driven SE flow. Relatively marginal cold. This isn't like the cold air that preceded 2009 (low to mid 20s). Is the GFS too progressive? Now I don't know that things will shift as far west as the NAM likes, but as usual, a blend might be the best way to go. The Euro is kind of in the middle. It isn't great for our area, though. -
Isn't there a secondary in the Ohio Valley? The trend recently has been to kill it off quite quickly, but at least it used to be there. Also, this might of interest to you guys, but I had no idea there was an 18Z CMC? Is it of equivalent value? You can see the shift in the heaviest axis of precip from 12Z to 18Z, with the latter looking a lot more like the GFS. If this off, I guess we'd find out at 0Z. 12Z 18Z
-
Based on relatively recent history, that area of subsidence seems fairly consistent. I remember watching those bands just to the west of my house (Hatboro) and being dismayed at the near-miss. That was during the last few of these Miller-B hybrid systems. Maybe it's just coincidence. I don't know if there's a climatological or geographical reason for it to happen that way outside of elevation and/or distance from the ocean.
-
Western Pa / Pittsburgh area Winter Discussion ❄️☃️
jwilson replied to north pgh's topic in Upstate New York/Pennsylvania
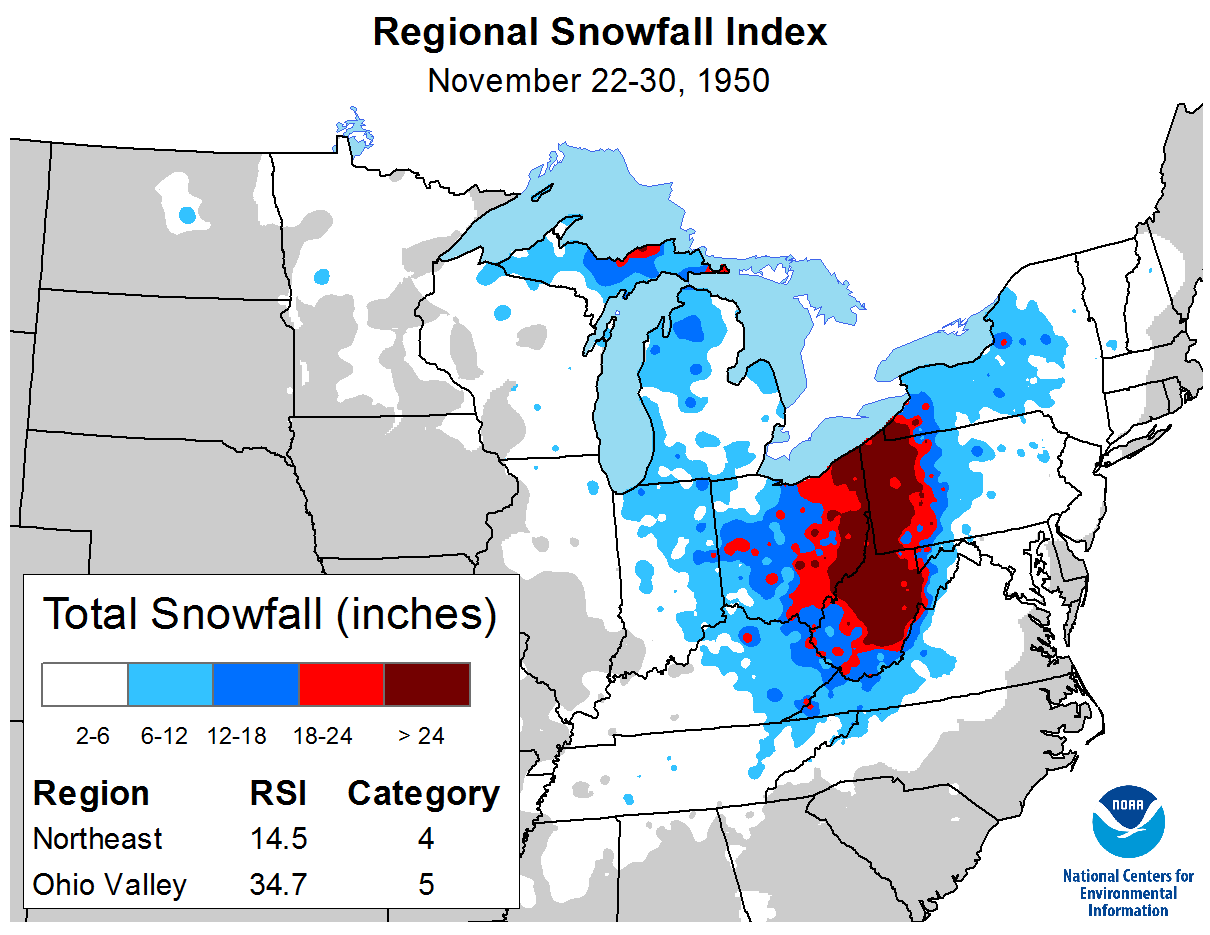
Appreciate the thoughts. I haven't lived here all my life, but in the time that I have, I can't remember Pittsburgh ever scoring significantly in a Miller B setup. For "significant" I consider 8" or more. I could certainly be wrong or misremembering, anyone care to fill in the gaps? Seems Pittsburgh metro, at least, does best in either big overrunning, Miller A events, or convoluted setups that aren't either traditional coastal "nor'easter" types. '93 was obviously unique and likely never equaled, and I don't know 1950 or 1890 well enough to define them. -
Western Pa / Pittsburgh area Winter Discussion ❄️☃️
jwilson replied to north pgh's topic in Upstate New York/Pennsylvania
I think the NAM is still too far out of its comfort range to be instructive. There's the rare occasion where it picks up on something, but usually you want to avoid the NAM until its under 48-60 hours. As you can witness on the NAM, the high pressure is bouncing all around, but I think it should be fairly locked in because of the overhead blocking (-NAO) and a ~50/50 low. The system that will eventually evolve into Wednesday's threat is just now hitting the west coast. The GFS at 12Z remains the most progressive of all the models. That solution creates such strong frontogenesis that you'll have winners under an INTENSE deform band with divergence elsewhere. The 12Z even screws much of Central PA that looked "safe" under other, previous solutions. Basically, you get a very narrow range of top snow depth instead of a widespread event. I'm not inclined to take the GFS at 100% right now. That said, the entire system is clearly vulnerable to disruptions, because it is early in the winter and we don't have a colder airmass established. The warm Atlantic waters are another wild card. It's also not near a true Miller A, which is what we really need to see for Pittsburgh to capitalize on these setups. Widespread overrunning snows. It's more like 75% Miller B and 25% Miller A. Those coastal transfers are tricky to time down. Too late and the mid-Atlantic misses out entirely. -
Western Pa / Pittsburgh area Winter Discussion ❄️☃️
jwilson replied to north pgh's topic in Upstate New York/Pennsylvania
Case in point: the EPS has a 60-80% chance of Pittsburgh metro seeing more than 3" of snow this week and a 30-40% chance of 6" or more with a mean through Friday of 5". Game isn't over. -
Western Pa / Pittsburgh area Winter Discussion ❄️☃️
jwilson replied to north pgh's topic in Upstate New York/Pennsylvania
There's still quite a few ensemble members of the GFS and Euro that swing a good bit of snow back across the entire state. Ridging out west, the digging s/w, or the high pressure can all influence the direction the low(s) move. The Canadian came right back to the same solution it had a couple days ago, however. It will be interesting to see if it remains consistent. It was curious to see the Euro come around to that same solution today while the GFS hints a bit more at it, but keeps the flow too progressive. Maybe the GFS is the new Dr. No. The GFS keeps it active through the period. The Euro looks like it transitions to a real +EPO signal around Christmas (not good). It will be curious to see what ends up winning out if the AO keeps tanking while we have less pacific ridging. Perhaps we get an "artificial" -EPO due to a shifting or splicing of the PV. -
The GFS also has Euro support (or is it vice versa?). Should be an interesting week ahead. The 0Z Canadian also had a system in this same timeframe, but the surface low tracked right over Philly. We'll see if the 12Z suite alters any details.
-
Western Pa / Pittsburgh area Winter Discussion ❄️☃️
jwilson replied to north pgh's topic in Upstate New York/Pennsylvania
Well, it's been quiet here. Rightfully so, I guess, because there isn't much going on in the interim. Long-term, the signals keep flipping back and forth, but a -NAO appears relatively likely. Perhaps in 48 hours we're back to a NINA look, I don't know, but it has been quite a while since we've seen any kind of true, even transient, -NAO block during the winter months. The last -NAO for December I can find is 2009 (we remember what happened then). From a "winter" perspective, 2010 was it, with negative values quite literally the entire year and into 2011. Columns after the year run from January to December. That was the end of our blocking winters. Since then, the only real blocking has come during the summer or fall months, and all winters have averaged well above positive. "A decade under the influence." This might all be for naught, but I figured since there isn't much going on, I'd try my hand at some analysis for the upcoming period, which looks like it could be surprisingly active. First is the Canadian for next Tuesday. After this weekend, which pretty much all models are visualizing a cutter, we head into next week that really looks more interesting. We see it is holding a rather large, singular piece of energy back into the southwest. This is usually a good sign for a big NE snowstorm. There's ridging along the west coast and, although the flow looks transient ahead, I think this is more a symptom of this s/w digging. This is the GFS at the same time: The GFS is much less organized. It is stringing out some of the same energy all over, while also holding a bigger piece back off the coast. It comes crashing in a few frames later: That's the remaining piece of energy coming into Seattle. Still, it keeps it separate and moves some smaller bits out ahead into the great lakes area. Very northern-stream dominant. At the same time, the Canadian keeps bowling: Now it's a closed-off ULL. Pretty much concentrating all the energy right there near the four corners. The Canadian then digs this all southward into the Gulf, dragging and phasing the northern stream energies into one significant trough. On the GFS, however: The American model keeps the streams separate. It has these two distinctive blocs, but it also has a piece of NS energy holding up in Canada. Basically, instead of how the Canadian crashes all this energy together into a cohesive system, the GFS times them apart and prevents things from ever morphing. It's a strung-out mess. See the final GFS look here: As I just said, the GFS is strung-out and tries to dig some of the energy south, but the northern stream is still keeping other bits of energy off the same conveyer belt. Eventually it does form a Miller A (of sorts) on its own, but because of the separation here, the cold air is also pulled away and the trailing system (seen here digging into TX) has no cold air to work with. What we get is a rain storm. Meanwhile, the Canadian: Puts a nice closed-off bowling ball right over the Jersey shore. Even the Canadian setup is kind of off-kilter - resulting in a double-barrel low of sorts - but it brings a lot of snow into the Mid-Atlantic. It isn't a great look for Pittsburgh because of the confluence, but if shifted just a little to the northwest, Pittsburgh would be in the game for the bigger totals. Meanwhile, this verbatim would jackpot areas around D.C., Philly, and New York, almost 11 years to the day after a very similar system did the same. The remaining question is - which of these models has support? As of the 12Z runs today, it looks like every model is kind of doing its own thing. There isn't a ton of agreement on the evolution of these pieces of energy. To be expected at this range and with this many moving pieces. Clearly it will take some time to lock in the results, but at least for now, we do have a period to watch upcoming. Whether anything results is pure speculation. Given how this winter was expected to develop as a STRONG NINA (now backing off that idea considerably, to the point where the Nina may be collapsing imminently), I think this is about as positive as we could have hoped. -
I can't necessarily speak for the Philly area, but I know in the western part of the state we have had two Top-10 coldest Novembers in the last three years ('18 - 8th, and '19 - 10th). For the actual winter months, I'll have to go out further than Top-10. The most recent notable record is February 2015 (second coldest ever), followed by January 2003 (11th) and December 2010 (12th) . February of '07 and '14, December of '00 and '05, and January months of '03, '04, and '09 are all contemporary records. However, all of those months are way down the lists in the teens or even twenties. March is barely represented. 2014 is it on the "top" list, and it is way down there (19th). In the Top-18 for cold March, the most recent is March of 1984. Seems March hasn't been all that cold in a long time. Daily and yearly records are harder to find. 1994 is the most recent cold day. Seems the 80s were kinda cold, overall. If we consider certain elements to be cyclical, maybe things will shift back the other direction eventually. Or maybe climate change will prevent that and things are forever different and unpredictable. That analysis goes above my pay grade. TL;DR: One Top-10 in the last 20+ years: February of 2015 (for actual winter, anyway).
-
Western Pa / Pittsburgh area Winter Discussion ❄️☃️
jwilson replied to north pgh's topic in Upstate New York/Pennsylvania
The CMC quickly abandoned this look, waiting until the storm was off Maine's coast to wrap it up. The Euro shows a prototypical Miller A path from the Gulf, through Alabama/Georgia, and then setting it up off the Delmarva. The GFS has a very similar setup, a bit more convoluted, but there's no "snow side" or cold sector. It's all rain and shears off south of our area. Lack of cold air definitely is one concern. Seems this one might be an inland NE special. Really, I think 2010 was the last of this kind of storm. Pittsburgh is still long overdue for an 8"+ event. -
Western Pa / Pittsburgh area Winter Discussion ❄️☃️
jwilson replied to north pgh's topic in Upstate New York/Pennsylvania
I have friends in Mercer county that got well over a foot (perhaps upwards of 16-18"). That's crazy. Goes without saying but in areas with lake effect enhancement and/or elevation, this event pushed towards overperformance. -
Western Pa / Pittsburgh area Winter Discussion ❄️☃️
jwilson replied to north pgh's topic in Upstate New York/Pennsylvania
I measured a little over 3" a couple hours ago. The snow was extremely fine down here most of the day, but this last push may get us upwards of 5" or so. No complaints about this event on December 1st. Let's hope it is a sign of things to come the rest of the winter and not the exception. Heck, if we were to hit 5" officially, this storm alone would be more snow than we've gotten in 4 of the last 6 Decembers. -
Western Pa / Pittsburgh area Winter Discussion ❄️☃️
jwilson replied to north pgh's topic in Upstate New York/Pennsylvania
Looks like it should be snowing here, but it's just virga. Column looks mostly saturated so I guess the precip is still too light. -
Western Pa / Pittsburgh area Winter Discussion ❄️☃️
jwilson replied to north pgh's topic in Upstate New York/Pennsylvania
RGEM nails the AGH snow-hole, or inverted bullseye. Lock it in, boys! Also, cut the amounts by 25-50%.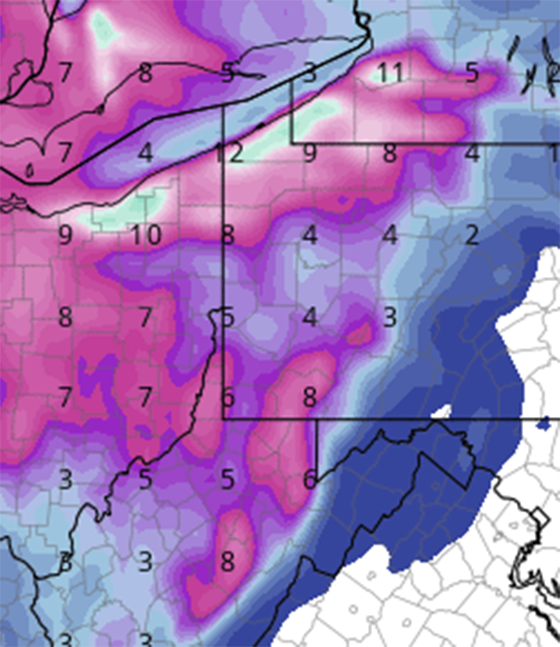
-
Western Pa / Pittsburgh area Winter Discussion ❄️☃️
jwilson replied to north pgh's topic in Upstate New York/Pennsylvania
Other than '17-'18 (13.3"), we've had a brutal run for December snow over the last six years. If this season unfolds as expected, any snow early is worthwhile, even needed. This won't be the blockbuster we'd all hope for, but perhaps we can muster a minor event out of it for the first accumulation. -
Western Pa / Pittsburgh area Winter Discussion ❄️☃️
jwilson replied to north pgh's topic in Upstate New York/Pennsylvania
That snowfall map above looks quite familiar...