jwilson
-
Posts
1,231 -
Joined
-
Last visited
About jwilson

- Birthday 01/31/1986
-
Had some pea-size hail here. Nothing extraordinary, but it was quite heavy in two spurts. Shows up quite well on radar, too.
-
Pittsburgh/Western PA Winter 2024-2025 Thread
jwilson replied to Rd9108's topic in Upstate New York/Pennsylvania
Pittsburgh snow totals tend to be quite a localized thing. Since we don't often get even-spread synoptic stuff, the banding results in widely varying totals across the area. I know those of us in the south almost always get less than the official measurement location and places in the North Hills. A result of the microclimates. For that reason, I'd say the actual total isn't that important. Places that met or exceeded 30" this winter would be considered a win given the historical precedence combined with expectations. It's also a big improvement over the last two years which probably makes it feel snowier. -
Pittsburgh/Western PA Winter 2024-2025 Thread
jwilson replied to Rd9108's topic in Upstate New York/Pennsylvania
Not a lot of support from the ensembles, and right now it's the only model with this solution. It's also shown a larger magnitude storm many times this winter in the mid-range. None have amplified as advertised. If we're under 72 hours and have some consistency, then I might get interested. -
How many fingers and toes does it have?
-
Pittsburgh/Western PA Winter 2024-2025 Thread
jwilson replied to Rd9108's topic in Upstate New York/Pennsylvania
Odds of another synoptic snow event are gradually dwindling, especially as temps look to warm over the next couple weeks. If there's any snow left in this winter, it's probably the stuff we're seeing today: snow showers after a passing cold front. Doesn't amount to much. I put the over/under of winter at 30" and that's about where the official number sits now. -
Pittsburgh/Western PA Winter 2024-2025 Thread
jwilson replied to Rd9108's topic in Upstate New York/Pennsylvania
Really hard to find info on that January 3, 1994, storm. I found a couple small clips on YouTube, including one from the Weather Channel that says Waynesburg measured 33" of snow - which seems insane - yet the storm isn't rated on the NESIS scale at all. All I can think is the storm must have been quite localized, or Pittsburgh doesn't rate on NESIS. It's strange. I guess it was quite a minimal impact on all the main coastal cities so it dodges a rating and much historical acclaim. I would love to see the orientation of that heavy snow axis because places were supposedly registering 4-6" an hour rates according to those clips. I did hit 4"/hour rates during the 2020 storm, but it only lasted about 20 minutes. -
Pittsburgh/Western PA Winter 2024-2025 Thread
jwilson replied to Rd9108's topic in Upstate New York/Pennsylvania
'94 I was in Philly, so I don't remember a storm of any significance then. 2020 was technically double-digits, as you all pointed out. I forgot and double-checked my notes, and we hit 10.5" locally. True that qualifies, it was kind of a freak thing and quite localized because of the CCB. 2018 I was in Morgantown and I didn't get anywhere near what Pittsburgh did for that event? I don't even remember it at all. Biggest storm I had that winter was 3" locally. Let me add: those others storms I mentioned were all closer to two feet than simply double-digits, so I think my bar is probably a little higher than normal! -
Pittsburgh/Western PA Winter 2024-2025 Thread
jwilson replied to Rd9108's topic in Upstate New York/Pennsylvania
Haven't seen a double-digit synoptic event since 2016. I'm guessing next year it continues if we have another La Nina, which makes 10 years and probably the longest I've gone in my life without such an event. Growing up, I remember 1993, 1996, and 2003 most notably. Since then was 2009-10 and 2016. I'm starting to itch like an addict, lol. -
Pittsburgh/Western PA Winter 2024-2025 Thread
jwilson replied to Rd9108's topic in Upstate New York/Pennsylvania
Everyone can take a week off. Going to be quiet for a little. If another -EPO develops like the ensembles are showing, we're going to get more cold air in early March. Question is if anything becomes of that, but I think that regime prefers the cold & dry formulation we've seen already this winter. I'm still chasing a big storm. Little nuisance snows at this time of the year aren't of interest. They're fine in November and December when setting the holiday mood. -
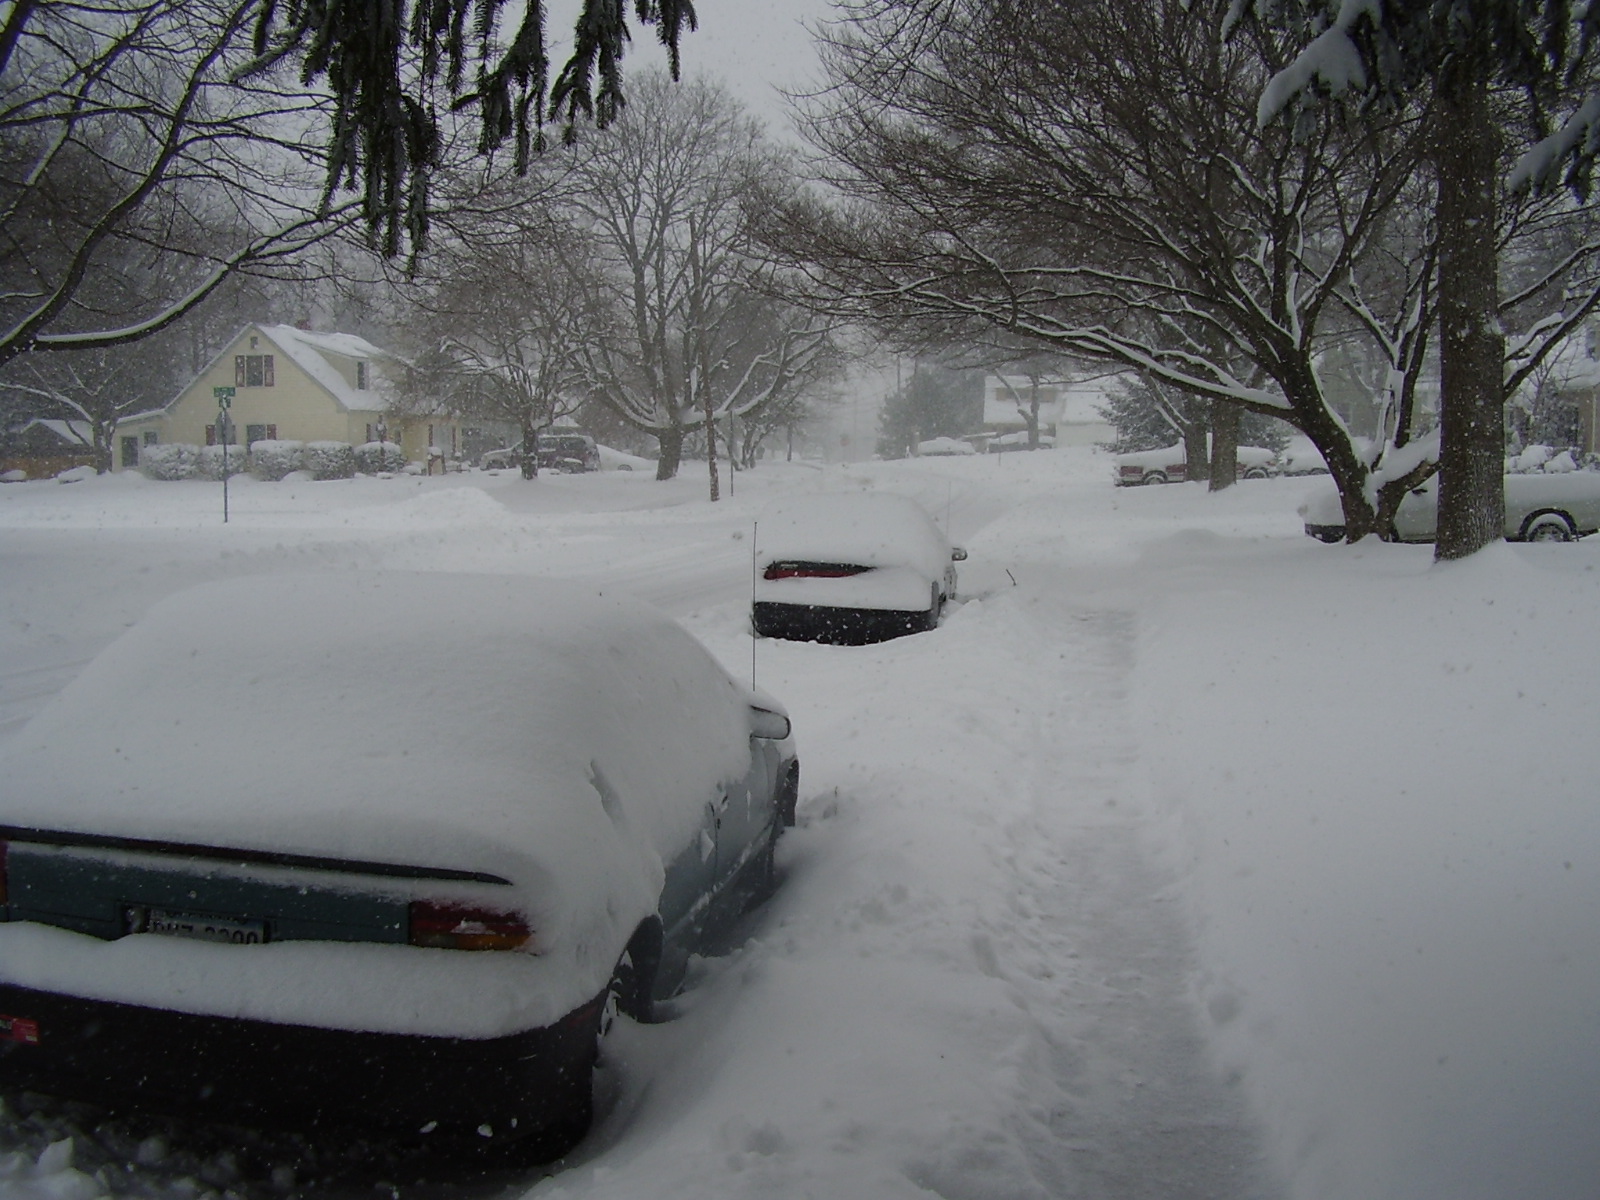
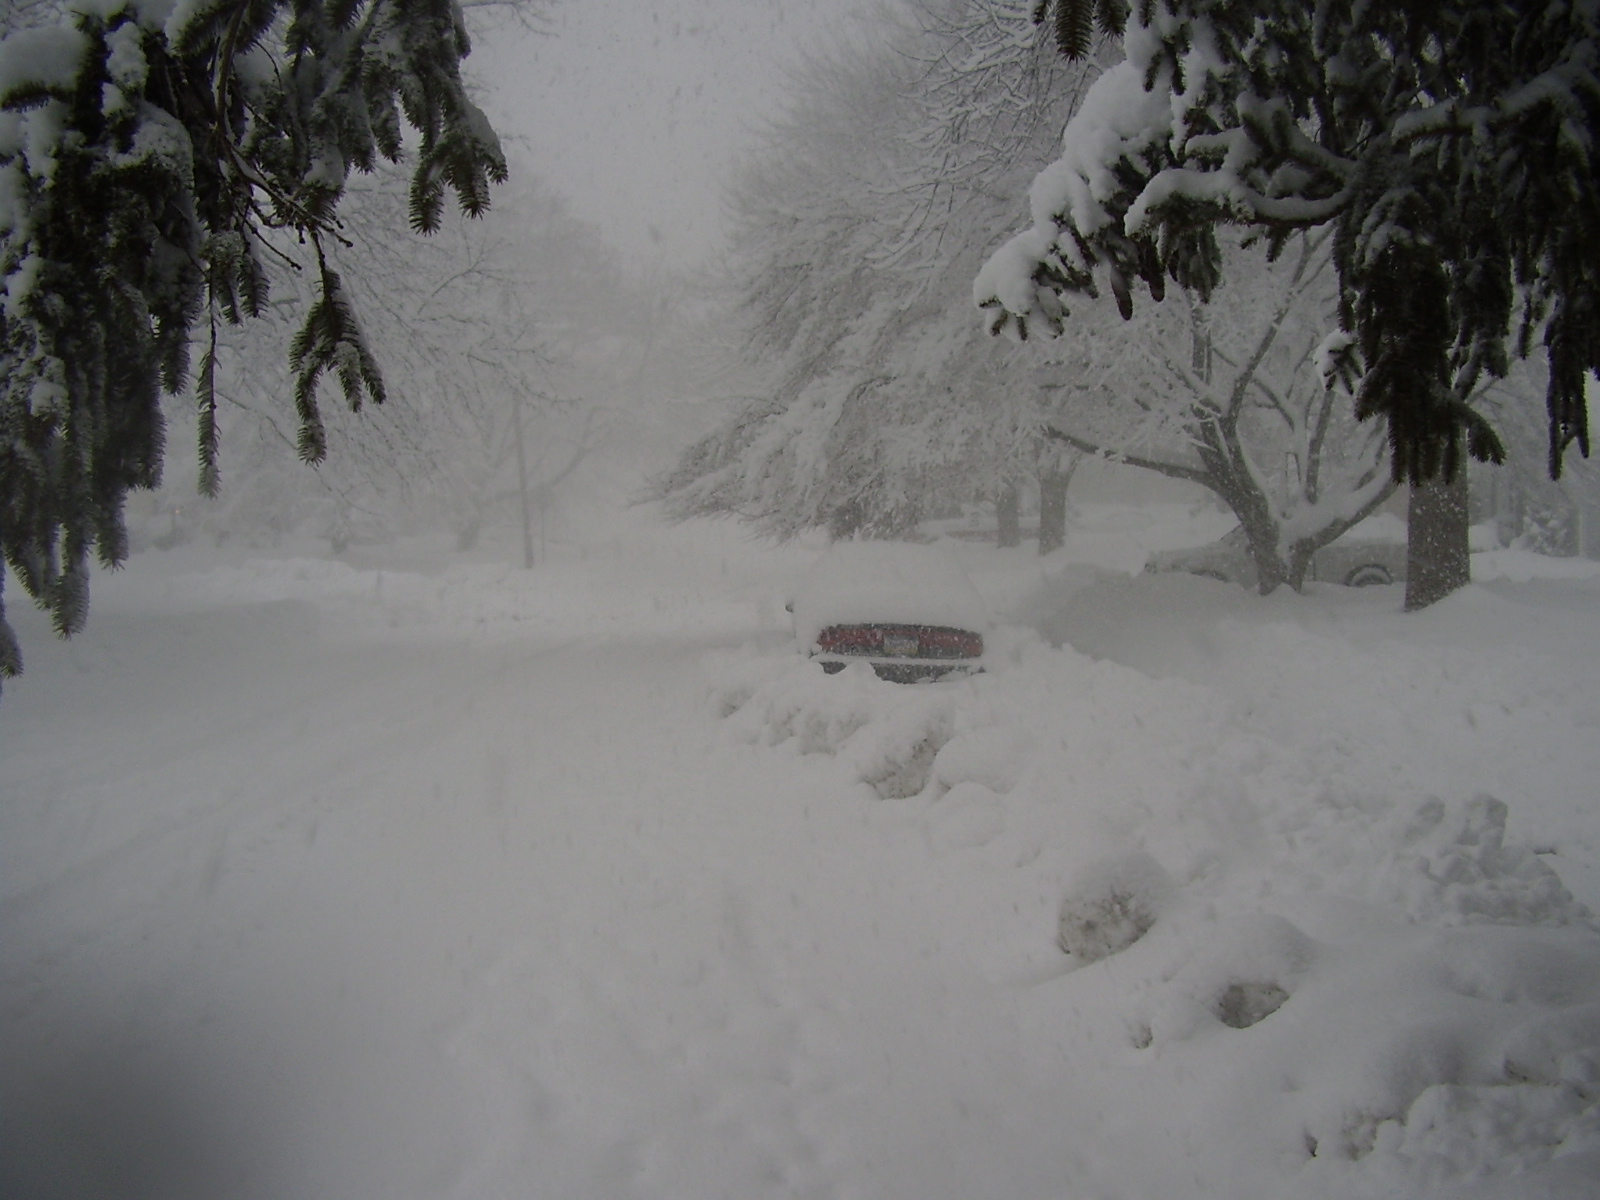
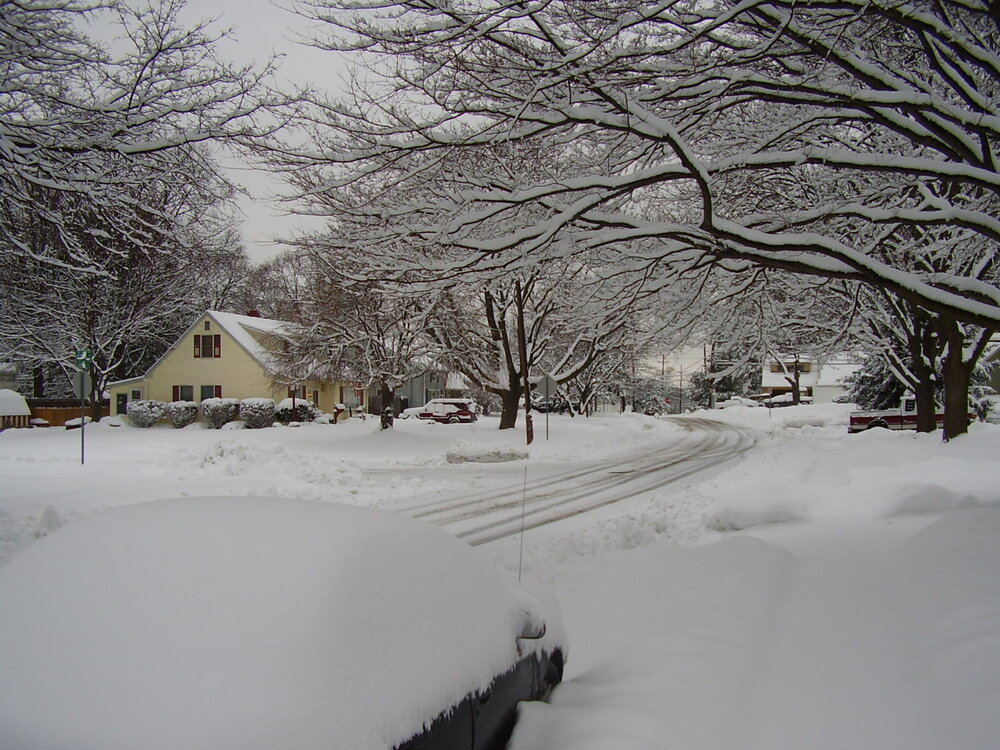
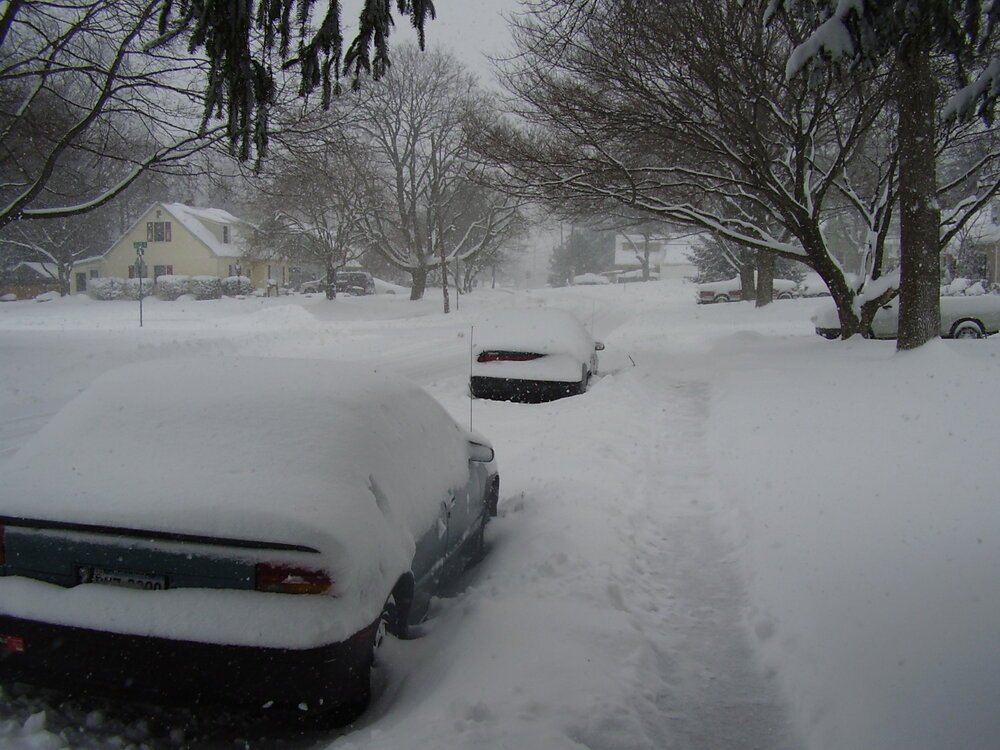
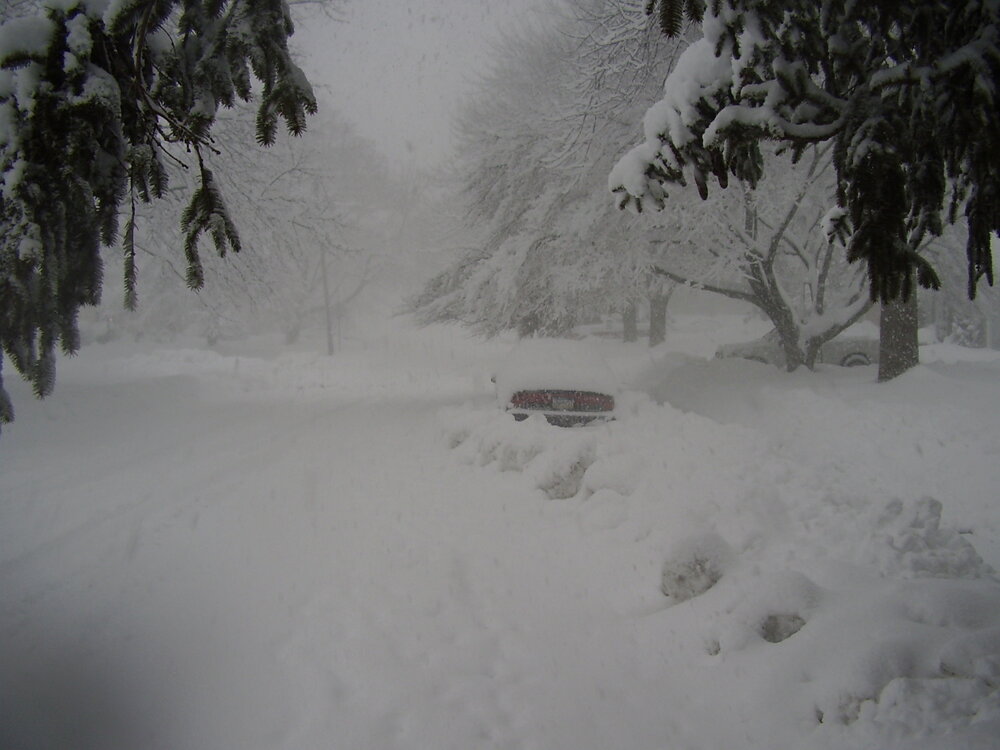
Yep, 9th-10th storm from that year. Third snow in a week. I was going through some old photos and found a bunch from that week, including some other analysis, etc. Here's your visibility progression for reference: Bottom picture is from the height of the storm. Same street, obviously, and you can see how low the visibility was during the heaviest snow. Middle pic is actually from the storm on the 6th, but I used it because it was more "normal" snow and the same general angle.
-
Missing those days...
-
Pittsburgh/Western PA Winter 2024-2025 Thread
jwilson replied to Rd9108's topic in Upstate New York/Pennsylvania
Models have intermittently teased a warm up, but with the 12Z suite, I'm not seeing anything extensive. GFS is most aggressive at the very end of its run in early March, but that's only three days or so. Seasonal trend has definitely been staggered and brief warmups followed by more seasonal cold. I guess if that continues, we wait on spring and have snow chances on occasion. -
I would think this winter failed because, in the beginning, it was primarily driven by a fairly significant -EPO phase. I don't think that's the best way to score a more typical east coast nor'easter, largely due to the position of the western ridge axis. It resulted in a numerical +PNA, which is exactly what we want, but I don't think that's the same as a +PNA that's driven more "organically," or at least coupled with an EPO that's more nuanced. The other problem was all high latitude blocking was transient. Any time the NAO or AO spiked negative, it would immediately retreat back into a positive phase. Basically, everything was relying on perfect timing to produce. Much of what was forcing storms under the Mason-Dixon wasn't primarily related to this blocking, either. It was a matter of the cold source TPV getting dumped into the CONUS with regularity because of the intense pacific flow. As others have mentioned, the speed of the pacific flow is what often gums up the works. It also seems to be reducing modeling accuracy, but that's my own speculative deduction (an educated guess). We can get these little events and cold under this regime, but like most Ninas, in general, you're talking about more cold and dry than cold and snow.
-
So when is the next warm-ENSO winter? lol
-
Pittsburgh/Western PA Winter 2024-2025 Thread
jwilson replied to Rd9108's topic in Upstate New York/Pennsylvania
Predictably, the mid-week storm is turning into another southern slider and missing PA. That's the seasonal norm. It was all too delicate and tenuous of a setup. Too many things to go wrong. It's a shame all the models at once locked onto a big solution because it's a massive tease, but I think that's the danger of model watching outside of a couple days lead. Also further demonstrates the tendencies of a cold-ENSO winter, and why the events in warm-ENSO winters are much more "stable" and easier to track. This isn't even 1996 anymore, and the increased speed of the northern jet is difficult to navigate.