

CentralNJSnowman
-
Posts
32 -
Joined
-
Last visited
About CentralNJSnowman

-
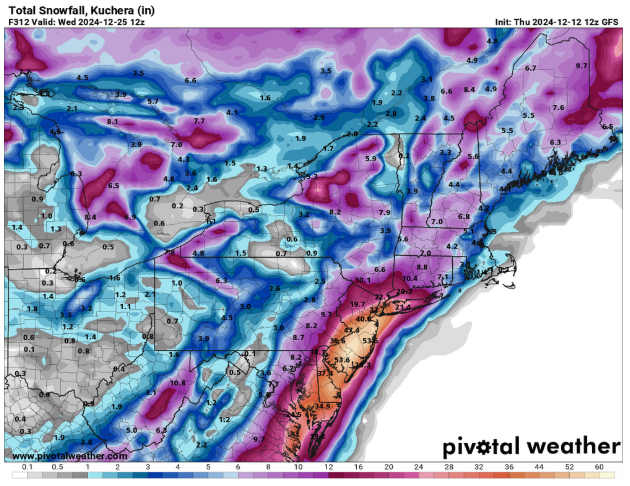
Even that run, showed the potential for a miss if it moved East at all. It was like 40" in Eastern NJ and maybe 10" in Western NJ from what I remember.
-
Just wanted to call out that if this does end up in the 2-6 inch range that wdrag is suggesting, then this is going to be an epically good forecasting job by him. He didn't get sucked in when all models were showing 12-36 inches, and he hasn't moved his forecast now that they're all showing the storm completely missing us. I'm not sure there's ANYONE else who falls into both of those groups. If he's right, it would also suggest to me that there's a long way to go in improving the models, and that maybe deterministic, physics-based models which try to forecast what WILL happen instead of a range of probabilities just aren't the right approach for medium-range forecasting.
-
Where would you say East Windsor is located within NJ?
-
I'm really skeptical of that one also...I was by the river in Jersey City, and we got 1/2" of slop as things were winding down. Everything else was rain.
-
I'm generally a big fan of your posts, but this sentence appears to represent a bit of a blind spot. We thought things were going to be idea in those other instances as well. IF things develop as currently forecasted, then the pattern may be ideal...but we've seen over and over that things often don't develop as forecasted. Until we're in relatively short range, it just doesn't seem as though the models can reliably forecast the pattern, any more than they can reliably forecast individual storms at long range.
-
Yesterday was a dud in Southern Middlesex County, NJ. I haven't been out but looks at most 1/2 inch of sleet, covered by a bunch of ice. That said, I thought Sacrus lived in the same town as me, and he said 1.5 inches of snow...so not sure why there's a discrepancy. Also worth noting that the next storm looks somewhat promising for a few inches here.
-
I know he said Valentines Day, but both the GFS and the CMC are showing that storm starting early on the 13th, and long gone by the 14th...so arguably only about seven and a half days away. Still long range...but not AS long.
-
Yes, I remember this run very well... But there are two big differences: The global models have all been somewhat in agreement on the period from Feb 6-13 The screenshot I attached lasted for literally one model run. But all of the models have now been showing a consistent procession of waves in more or less the same place for the past few days of model runs I have no idea whether any of these will lead to substantial snow, but I like our odds a lot better than at any other time this winter.
-
Not sure what you mean about the CMC. It seems to have all the same waves (more or less). Just has the first couple without the front-end snow and the third one missing just south of us. I'm actually amazed that all of the models have been showing fairly similar things consistently, run after run for the past 3 days in the 7-14 day range. Whether this all ends up giving us much snow has been inconsistent, but big picture I don't think I've ever seen them this consistent at this range.
-
Kalshi.com
-
I would think that depends why one is asking the question of 'How does this winter compare to normal?' If you're taking it as a given that the underlying averages are very different than they used to be, and you're interested in knowing how this winter compares to the current underlying averages, I think you'd limit the comparison to the past 12-15 years. While that doesn't give a great sample size, your assumptions essentially mean that anything further back than that is irrelevant. If you're trying to understand how this winter supports or refutes the idea that the underlying averages are changing, then you'd want to compare it to a much longer historical benchmark.
-
Nothing sticking for a while yet in monroe (next to manalapan)
-
Seems like logging in gave me the ability to choose to continue with the browser
-
Problem is on both Safari and Chrome I can see the option to 'Continue on Safari' or 'Continue on Chrome'...but it's always partially covered by an ad, so there's no way to click it (and no obvious way to close the ad).
-
Same problem for me. It's horrible and I haven't been able to solve it.

