Danny8
-
Posts
44 -
Joined
-
Last visited
Content Type
Profiles
Blogs
Forums
American Weather
Media Demo
Store
Gallery
Everything posted by Danny8
-
Go to the NWS Chicago site (https://www.weather.gov/lot/). Click on "Climate and Past Weather", and you can search those things in the NowData tab. Select the "Monthly summarized data" product. Monthly Mean Max Temperature for CHICAGO OHARE INTL AP, IL Click column heading to sort ascending, click again to sort descending. Year Jan Feb Mar Apr May Jun Jul Aug Sep Oct Nov Dec Annual Mean 31.6 35.9 47.2 59.0 70.3 80.4 84.3 82.6 76.0 63.0 48.7 36.8 59.6 1995 30.3 33.9 49.2 54.6 68.7 83.7 88.0 87.7 73.5 63.0 40.9 33.6 58.9 1996 31.3 33.9 40.2 55.4 64.4 78.0 80.1 82.1 73.3 62.2 39.8 33.5 56.2 1997 27.8 35.1 46.2 55.5 63.9 79.3 83.1 78.2 74.2 63.8 42.5 36.1 57.1 1998 35.3 45.0 45.6 58.7 75.4 79.5 84.1 82.5 78.3 64.3 52.4 42.7 62.0 1999 29.9 42.1 44.4 58.4 72.4 80.4 88.3 79.3 75.7 63.7 55.6 37.7 60.7 2000 32.1 42.2 54.6 57.6 72.1 76.8 79.8 81.8 74.6 66.1 43.8 24.4 58.8 2001 30.8 34.0 42.7 64.2 70.2 77.5 85.0 81.7 71.0 60.3 57.4 40.2 59.6 2002 38.5 40.2 43.6 58.9 65.2 81.1 86.6 82.8 78.9 57.5 44.8 36.9 59.6 2003 28.3 32.3 46.5 58.7 66.0 76.7 82.9 82.8 73.7 62.4 49.5 38.6 58.2 2004 27.4 35.8 49.3 61.4 70.9 77.3 80.5 77.0 78.4 63.0 50.3 35.8 58.9 2005 31.2 38.9 43.9 63.4 67.8 85.2 86.4 84.0 80.1 64.3 51.4 29.4 60.5 2006 42.0 36.3 46.7 64.1 69.7 78.8 85.7 83.0 71.1 57.5 50.2 40.5 60.5 2007 33.8 24.4 51.3 56.5 75.5 81.6 83.5 83.2 79.2 68.1 47.0 34.1 59.9 2008 32.0 29.7 42.5 59.8 66.2 80.9 83.8 81.8 75.2 61.6 46.3 31.5 57.6 2009 23.9 36.9 48.7 57.0 70.6 77.0 78.4 79.1 74.3 55.2 53.1 32.3 57.2 2010 27.4 32.3 50.4 65.5 71.2 80.2 87.1 85.7 74.2 66.8 50.8 29.0 60.0 2011 26.7 32.7 43.8 56.1 67.8 79.4 88.5 82.5 69.9 65.2 52.4 41.8 58.9 2012 38.5 40.2 63.3 59.8 76.5 85.5 91.5 84.0 74.5 60.5 49.0 42.5 63.8 2013 35.3 33.1 39.6 56.3 71.2 78.2 81.8 82.7 77.1 62.4 45.3 31.1 57.8 2014 24.6 25.7 40.9 59.2 71.0 81.0 79.8 82.1 73.7 60.6 41.4 36.9 56.4 2015 29.0 23.4 44.4 60.0 70.0 76.9 81.9 80.9 78.1 63.2 53.7 44.5 58.8 2016 31.7 37.2 51.5 57.4 70.1 81.9 84.4 84.3 77.7 65.8 55.3 31.1 60.7 2017 34.6 47.7 47.1 63.8 67.7 83.3 83.8 80.7 79.7 65.5 46.9 34.2 61.3 2018 31.9 38.0 44.7 50.0 76.4 80.4 85.1 84.8 77.5 60.7 39.7 39.7 59.1 2019 27.5 34.0 42.7 59.1 67.5 77.3 86.1 81.5 76.9 58.7 41.6 41.3 57.9 2020 35.8 37.3 50.9 58.0 69.1 84.0 88.3 86.4 74.6 60.9 55.7 39.3 61.7 2021 33.9 27.4 53.3 61.3 69.7 83.8 82.3 86.2 79.8 66.6 48.2 45.8 61.5 2022 28.6 35.3 49.1 55.1 72.2 82.6 83.5 83.0 76.0 63.9 51.7 35.7 59.7 2023 37.5 42.2 46.0 62.2 73.8 81.4 84.6 83.0 77.7 64.7 51.0 44.2 62.4 2024 30.7 49.2 52.9 61.6 75.2 83.6 83.8 83.8 80.3 70.1 52.3 38.4 63.5 Monthly Mean Min Temperature for CHICAGO OHARE INTL AP, IL Click column heading to sort ascending, click again to sort descending. Year Jan Feb Mar Apr May Jun Jul Aug Sep Oct Nov Dec Annual Mean 18.0 20.5 30.1 39.3 49.9 60.1 65.4 64.5 56.6 44.9 33.2 23.4 42.2 1995 17.7 19.0 31.2 37.4 48.8 60.9 67.2 70.3 51.5 44.4 24.6 19.0 41.0 1996 15.4 18.2 21.3 34.9 45.6 57.9 59.6 62.4 53.6 41.6 26.9 21.9 38.3 1997 10.8 22.8 29.5 34.9 43.6 57.3 63.3 60.8 54.1 42.5 30.2 26.8 39.7 1998 23.8 32.4 32.3 40.8 54.1 59.0 64.8 64.4 57.1 46.6 37.2 26.6 44.9 1999 15.3 25.9 26.8 40.8 50.9 60.3 68.4 61.3 51.1 42.0 34.5 22.0 41.6 2000 18.5 25.9 33.7 36.8 51.9 57.7 62.3 63.0 54.8 46.0 30.2 7.6 40.7 2001 18.3 18.2 25.6 40.7 49.8 57.3 64.1 64.7 52.8 43.9 39.0 26.5 41.7 2002 25.3 24.1 25.5 40.9 45.2 60.8 67.5 63.5 55.8 42.0 30.4 23.4 42.0 2003 14.3 14.9 26.9 37.9 46.5 54.2 61.8 64.4 53.0 41.2 34.2 24.6 39.5 2004 13.2 18.9 33.0 39.3 49.1 56.9 61.9 58.0 54.6 44.8 37.1 21.9 40.7 2005 17.8 26.0 26.2 39.7 46.4 63.1 64.7 64.5 58.7 46.0 32.6 17.3 41.9 2006 29.6 20.0 29.9 42.1 49.5 57.8 67.3 65.6 53.7 40.4 35.5 27.1 43.2 2007 21.9 11.5 33.6 37.0 52.0 61.1 63.9 66.4 57.0 49.9 31.7 21.6 42.3 2008 14.9 16.4 27.2 39.1 44.8 60.7 64.2 63.6 57.1 43.7 32.2 14.2 39.8 2009 7.8 19.6 30.5 37.5 49.1 58.1 60.4 61.8 56.4 42.5 37.6 20.6 40.2 2010 16.5 21.1 33.0 43.6 52.2 62.2 68.2 67.7 56.1 45.2 32.2 16.0 42.8 2011 14.5 19.6 28.8 39.3 48.0 59.5 69.5 64.4 54.4 44.6 37.4 28.6 42.4 2012 21.9 25.6 43.6 41.6 54.6 62.4 70.6 62.6 53.7 42.4 32.0 29.7 45.1 2013 17.9 19.1 25.6 37.5 50.7 58.9 64.5 63.3 57.3 43.8 29.6 15.6 40.3 2014 6.7 8.9 22.4 37.9 49.7 60.9 60.9 65.3 54.2 43.4 25.8 27.1 38.6 2015 15.5 5.7 26.3 38.8 50.7 57.8 62.7 62.6 59.8 46.2 35.5 33.5 41.3 2016 17.6 23.5 35.1 38.1 49.4 61.2 66.5 67.4 61.4 47.9 38.3 18.9 43.8 2017 23.0 28.4 31.8 43.7 48.0 61.6 65.5 62.2 59.1 49.7 32.5 20.1 43.8 2018 17.4 19.6 29.1 32.4 55.9 62.6 67.4 67.7 60.4 44.7 29.4 26.7 42.8 2019 14.5 17.8 25.9 40.3 48.5 58.2 68.2 64.3 61.9 43.1 27.9 26.6 41.4 2020 24.4 23.1 34.7 38.7 50.7 63.9 70.2 67.2 57.9 42.1 39.0 26.4 44.9 2021 24.4 13.0 35.2 42.5 50.8 64.8 66.5 68.1 60.7 52.7 32.5 30.2 45.1 2022 12.6 19.5 32.4 38.9 55.2 61.9 67.0 65.7 58.8 44.2 35.1 22.5 42.8 2023 27.1 25.5 31.6 41.3 51.0 60.2 66.7 65.5 61.2 49.4 34.7 33.8 45.7 2024 21.8 29.7 35.1 43.8 54.5 64.3 66.2 65.9 60.9 49.3 40.0 25.7 46.4 Monthly Total Snowfall for CHICAGO OHARE INTL AP, IL Click column heading to sort ascending, click again to sort descending. Year Jul Aug Sep Oct Nov Dec Jan Feb Mar Apr May Jun Season Mean T T T 0.2 1.9 7.4 12.5 10.0 4.6 1.2 T T 38.5 1994-1995 0.0 0.0 0.0 0.0 T 7.0 13.1 0.4 3.5 0.1 0.0 0.0 24.1 1995-1996 T 0.0 0.0 T 3.9 9.9 5.9 M M M T 0.0 M 1996-1997 M 0.0 0.0 0.0 M T M M M 1.7 0.0 T M 1997-1998 0.0 0.0 0.0 0.0 M 7.1 M 0.0 M M 0.0 T M 1998-1999 0.0 0.0 0.0 0.0 0.2 1.0 29.6 1.9 18.2 0.0 0.0 0.0 50.9 1999-2000 0.0 0.0 0.0 0.0 0.0 3.5 13.6 11.6 T 1.6 0.0 T 30.3 2000-2001 0.0 0.0 0.0 T 0.1 30.9 1.5 2.2 4.2 0.3 T T 39.2 2001-2002 T 0.0 0.0 T 0.0 1.6 15.5 1.8 11.2 1.0 0.0 T 31.1 2002-2003 0.0 0.0 0.0 0.0 4.7 8.0 4.3 1.5 7.1 3.0 0.0 0.0 28.6 2003-2004 T T 0.0 0.0 T 1.5 14.6 6.5 2.2 0.0 0.0 0.0 24.8 2004-2005 0.0 0.0 0.0 0.0 5.1 0.6 27.8 2.7 3.2 T T 0.0 39.4 2005-2006 0.0 0.0 0.0 T 1.9 10.4 5.5 2.5 5.7 T 0.0 T 26.0 2006-2007 0.0 0.0 T 0.3 0.4 5.8 3.5 20.3 2.3 3.0 0.0 0.0 35.6 2007-2008 0.0 0.0 0.0 0.0 0.3 17.6 12.7 21.8 7.9 T 0.0 0.0 60.3 2008-2009 0.0 T 0.0 T 0.6 21.9 21.5 4.5 2.1 2.1 0.0 0.0 52.7 2009-2010 0.0 0.0 0.0 T T 20.8 9.1 22.5 1.8 T 0.0 0.0 54.2 2010-2011 0.0 0.0 0.0 0.0 T 16.2 10.6 29.0 1.0 0.6 T T 57.4 2011-2012 0.0 0.0 0.0 0.0 T 1.7 12.2 5.6 0.3 0.0 T 0.0 19.8 2012-2013 0.0 0.0 0.0 0.0 T 0.9 2.6 16.1 10.4 0.1 0.0 T 30.1 2013-2014 0.0 0.0 0.0 T 0.9 14.2 33.7 19.5 12.3 1.4 0.0 0.0 82.0 2014-2015 0.0 0.0 0.0 0.1 2.8 T 13.9 26.8 7.1 T 0.0 T 50.7 2015-2016 0.0 T 0.0 0.0 11.2 4.5 6.3 5.5 2.6 1.1 0.0 0.0 31.2 2016-2017 0.0 0.0 0.0 0.0 T 17.7 0.6 T 7.8 0.0 0.0 T 26.1 2017-2018 T 0.0 0.0 T 0.1 5.3 4.6 20.3 2.6 3.2 0.0 0.0 36.1 2018-2019 0.0 0.0 0.0 T 12.7 1.4 18.2 9.0 0.3 7.9 T 0.0 49.5 2019-2020 0.0 0.0 0.0 4.6 3.7 2.0 7.8 8.8 3.2 4.7 0.0 0.0 34.8 2020-2021 T 0.0 0.0 T 0.7 2.8 21.9 21.6 1.8 T 0.0 0.0 48.8 2021-2022 0.0 0.0 0.0 0.0 T 1.9 13.9 12.8 3.8 0.4 0.0 T 32.8 2022-2023 T 0.0 0.0 T 1.1 3.2 9.9 3.7 1.8 0.5 0.0 0.0 20.2 2023-2024 0.0 0.0 0.0 0.9 1.8 1.2 16.1 1.2 1.0 T 0.0 T 22.2
-
Good call

-
Winter 2024-25 Medium/Long Range Discussion
Danny8 replied to michsnowfreak's topic in Lakes/Ohio Valley
The one 17th on this list? January 2-3, 1999 i mean https://www.weather.gov/dtx/dtwsnowstorm -
Winter 2024-25 Medium/Long Range Discussion
Danny8 replied to michsnowfreak's topic in Lakes/Ohio Valley
As a kid I think January 1999 is what sparked my love for winter after waiting so long for snow days. I was in Sterling Heights and I always felt like everything was missing us -
Does Grand Rapids just have a higher threshold for winter weather than Milwaukee or Detroit offices? For example the new cold warnings have different thresholds

-
Winter 2024-25 Medium/Long Range Discussion
Danny8 replied to michsnowfreak's topic in Lakes/Ohio Valley
At this point it feels like being in the top 25 coldest winters in the historical record would qualify as “harsh winter”, but we hit a top 25 warmest summer and it’s considered “who cares” by much of the board -
I'm near Grand Rapids for the Thanksgiving weekend and really cashing in on lake effect around here last night and all day today
-
First freeze at the lakefront Marquette station yesterday Nov 24th
-
If it makes you feel better im always entertained how long it takes Marquette to get it's first freeze. The city station on the water not the Marquette WSO. Has gone to November quite a few times the past few years, and they are still waiting on their first freeze this year
-
Huh I just realized I think I live by a bunch of horse chestnuts after looking them up. Always thought they were buckeye trees!
-
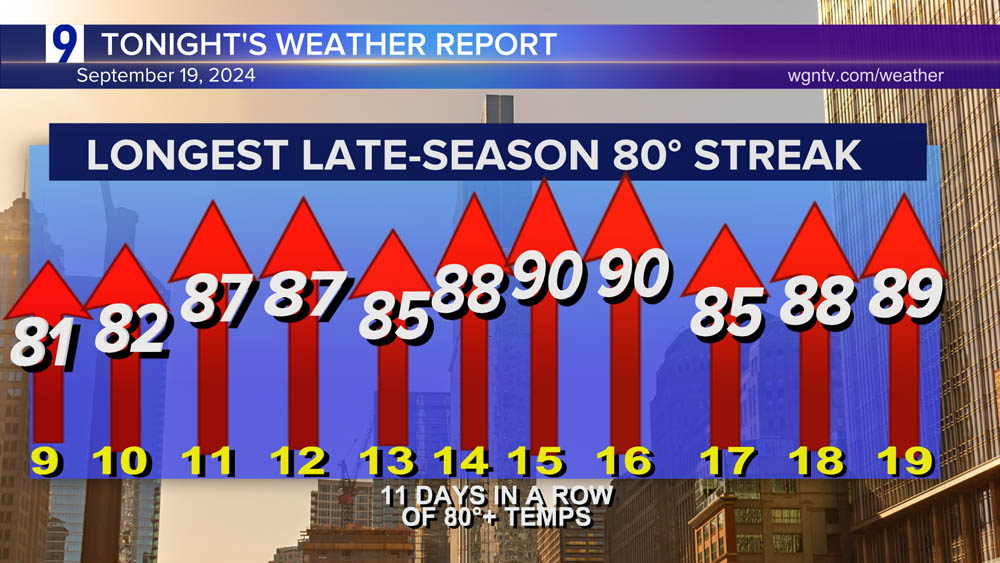
For Chicago Looks like Detroit is also at an 11-day streak over 80 but I’m not sure if that is the longest in September
-
Met summer in Grand Rapids ended with above normal temperatures and precipitation… so WAW summer (warm and wet)?
-
Summer 2024 Medium/Long Range Discussion
Danny8 replied to Chicago Storm's topic in Lakes/Ohio Valley
Is there an easy way to look up historical dew point data? Monthly and daily data? or is that something you have to back into with temp and humidity data. -
Very interesting analysis! Those 38 degree annual mean years in 1843 and 1875 are insane. Wouldn’t that technically qualify as like a subarctic climate??
-
For the US side of the eastern lakes it looks like Buffalo, Cleveland, and Detroit all finished in the top 10% of warmest Junes on record (going back to the 1870s)
-
Where do you find historical dew point data?
-
That is really interesting, good find!
-
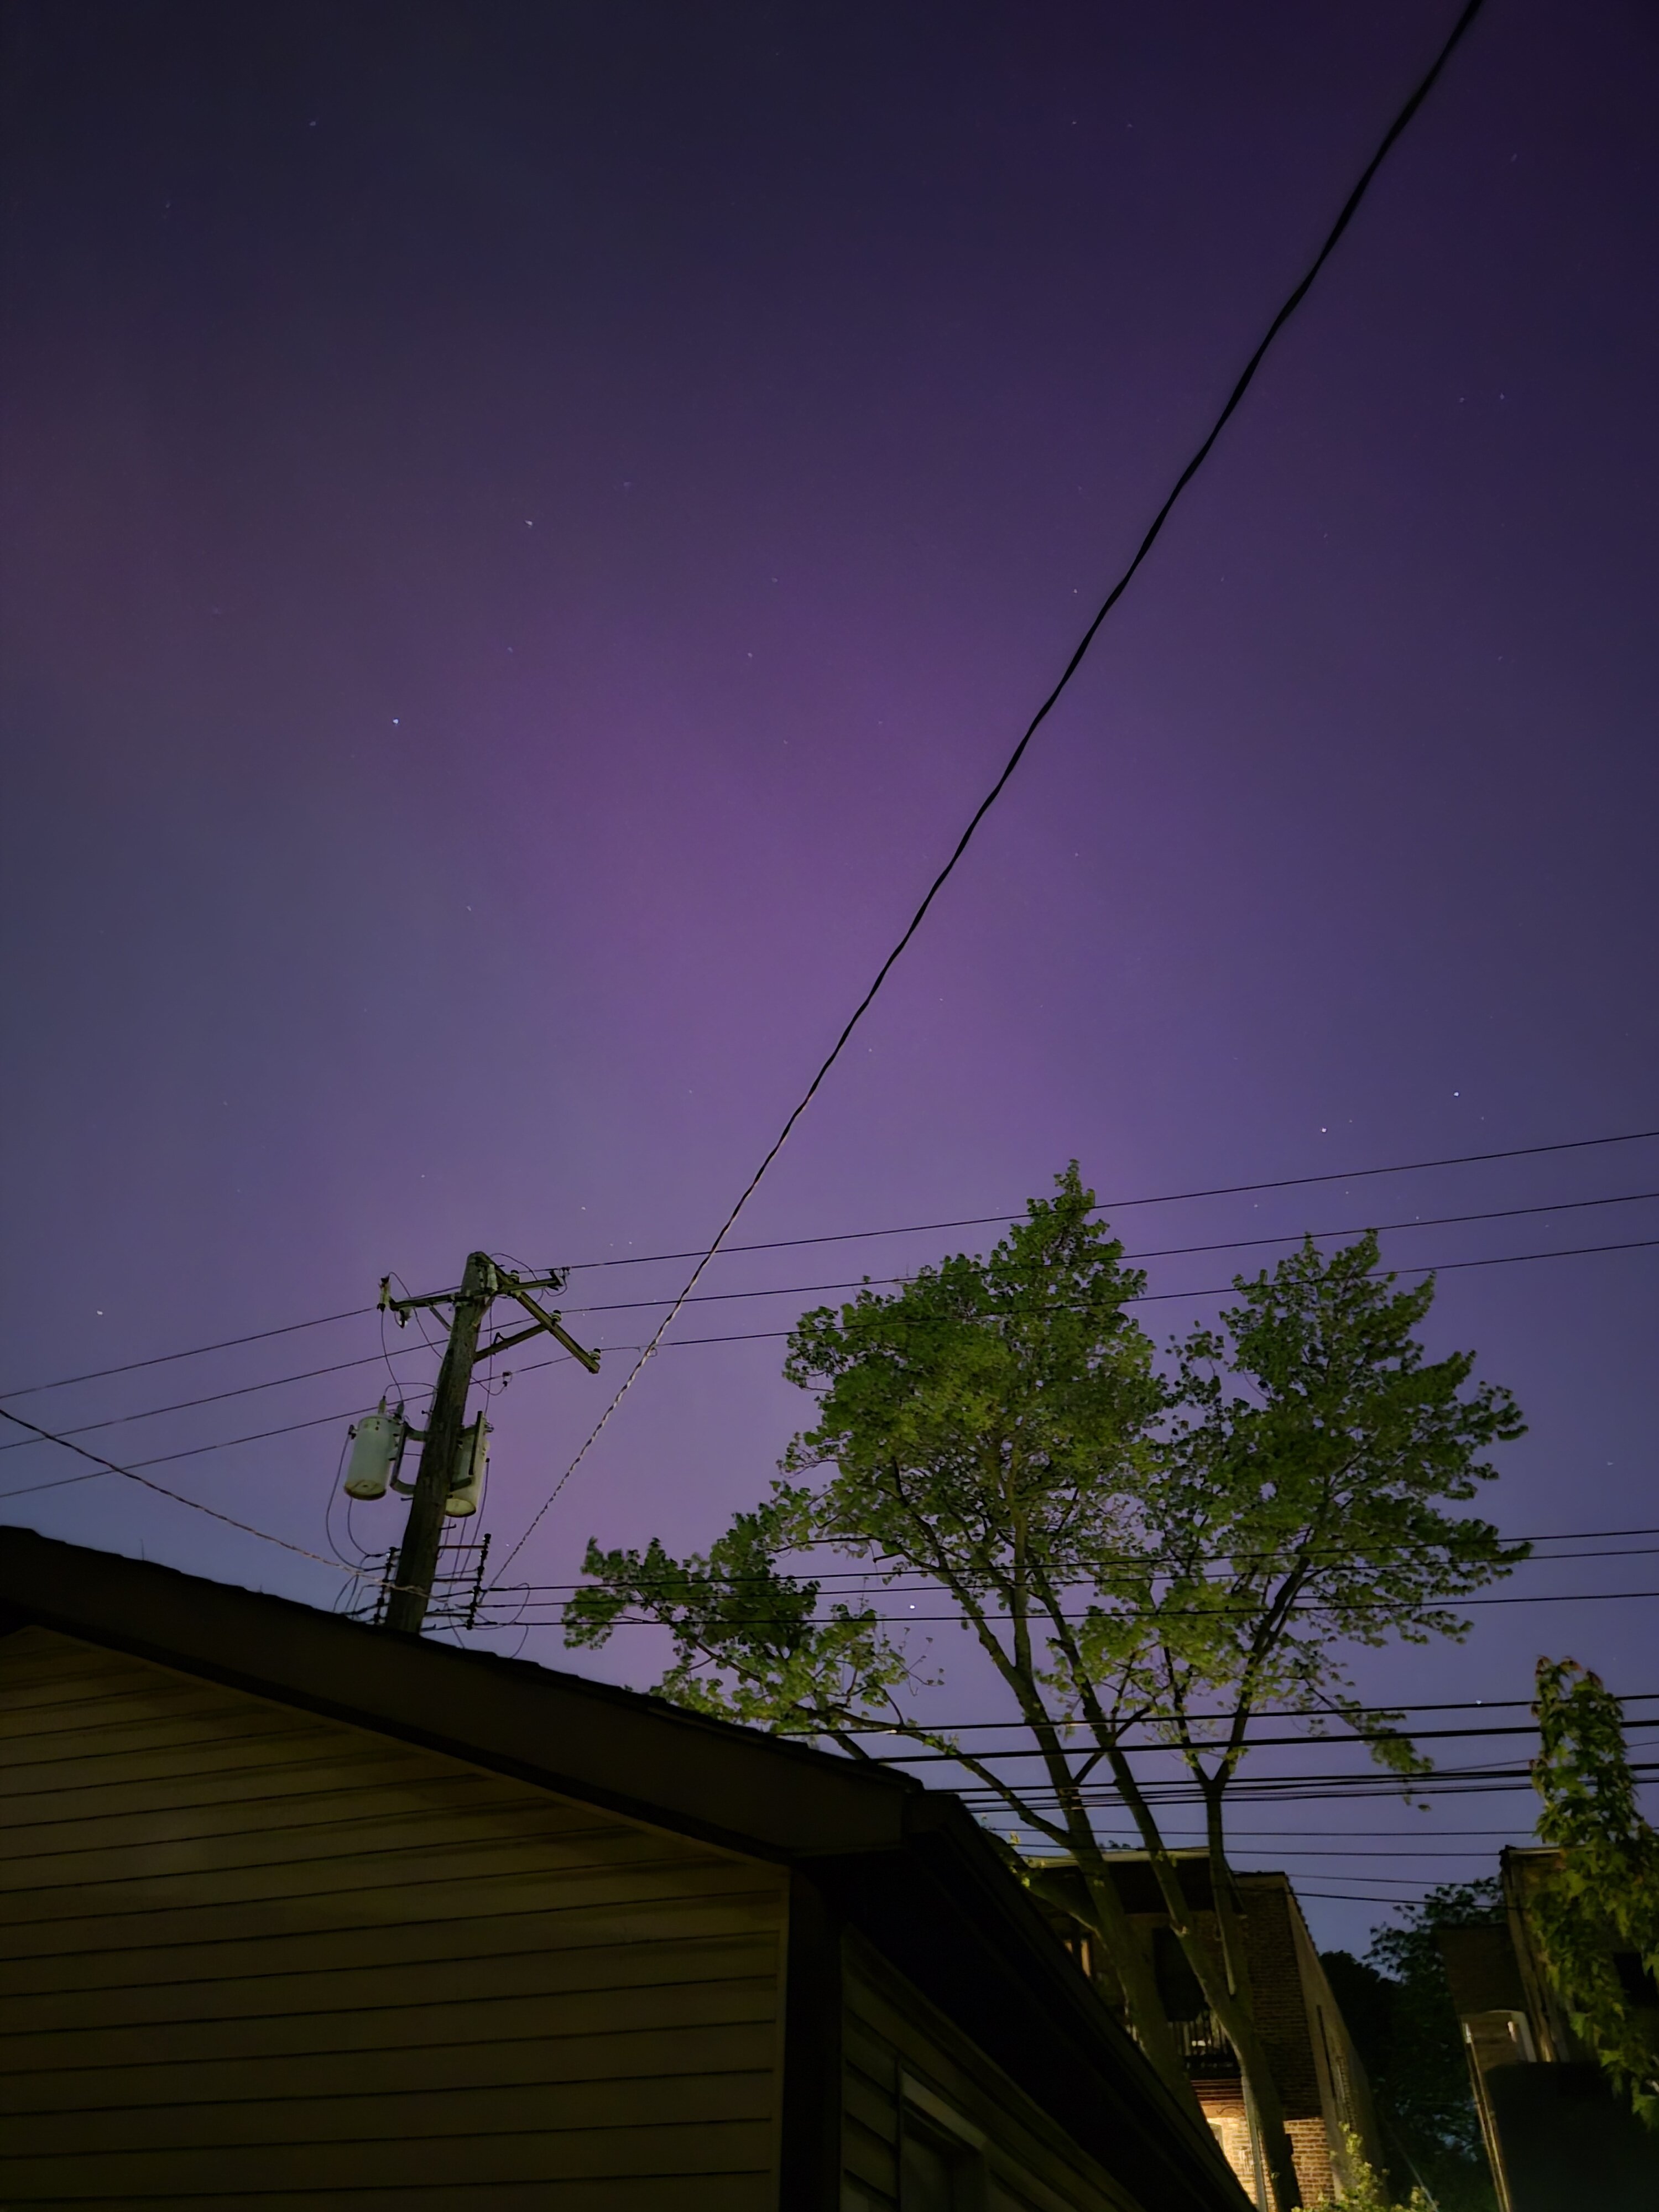
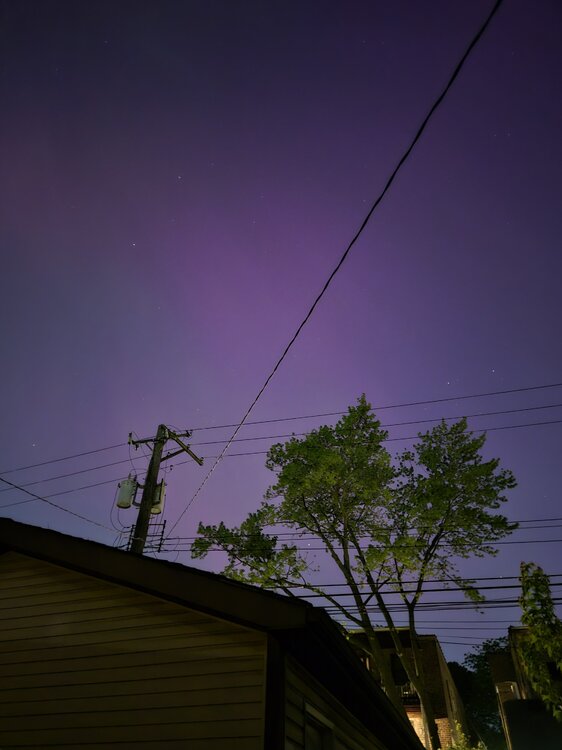
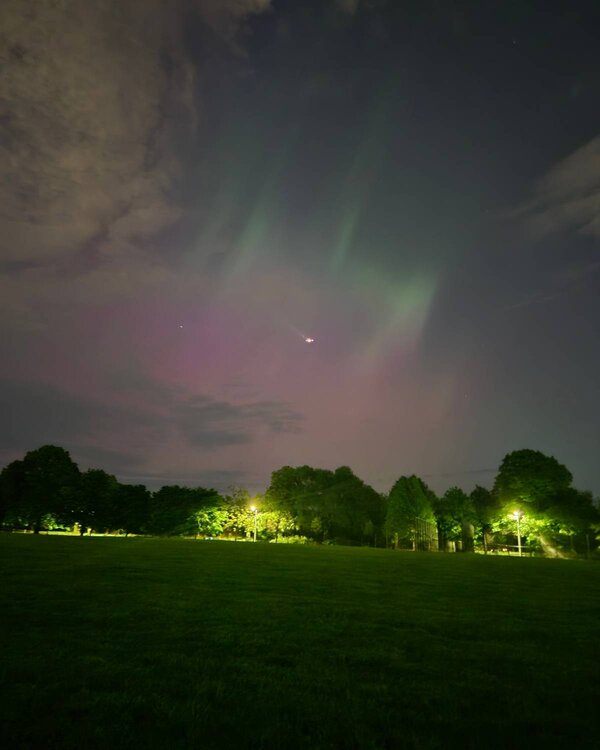
Wow they were even visible in Chicago! Didn't think I would ever see them outshine the light pollution and have them in my own backyard
-
So how are things looking in the UP @weatherbo and @wishforsnow? Any trails open at all?
-
Looking like a good thing I was in the UP mid-January this year. You'll have to give us a snowpack update in 10 days or so
-
Interesting! Definitely not the usual lake effect snow location, see it on the northwest shore of the lake
-
I think you have the date wrong? ORD was 91/59 on May 30th
-
Can confirm Thundersnow in Irving Park!
-
RECORD EVENT REPORTNATIONAL WEATHER SERVICE CHICAGO IL138 AM CDT FRI OCT 27 2023...RECORD HIGH MINIMUM TEMPERATURE SET AT CHICAGO-OHARE...A RECORD HIGH MINIMUM TEMPERATURE OF 65 WAS SET AT CHICAGO-OHARE YESTERDAY. THIS BEATS THE OLD RECORD OF 63 SET IN 1939.
-
I was wondering what was going on, Chicago was under Air Quality Alerts all last week and the AQI ended up I think staying below 100 each day. Then today nothing! (Until now)