csnavywx
-
Posts
5,506 -
Joined
-
Last visited
Content Type
Profiles
Blogs
Forums
American Weather
Media Demo
Store
Gallery
Everything posted by csnavywx
-
Lots of missing stations. Only the big ones leave a hole like this, in my experience.

-
Getting a lot of baroclinic help as it roars inland. Central pressure has been slow to rise relative to normal.
-
Still intense lightning activity in the western eyewall. Going to be a close shave for TLH.
-
Wavenumber 4 shape going on with the eyewall. Was probably there to an extent before but radar beam height getting low enough to pick up on it now.
-
Back down to closer to 250 strikes/3m. One of the most insane spikes of hurricane lightning eyewall activity I've seen though.
-
650. Peak? Last 10m have been insane. 2200 total.
-
Still spiking, 500+ strikes in last 3m.
-
I have >100 strikes a minute (426 strikes in last 3 min, 317 in 3-5m bin).
-
N/NW eyewall seems especially vicious. Clear overshooting tops on IR and lots of scalloping on reflectivity and on velocity products. Intense convection.
-
It's basically out of time here, but if this were still well out over water, then this is the kind of setup that could eventually result in an EWRC. The series of mesovort formations and mergers we've been getting usually precedes cocentric band formation -- so you could argue we're getting ready to enter the incipient phase of one.
-
Gorgeous breakdown of barotropic instability resulting in scalloping on the eyewall.
-
Some evidence on visible that there's still a bit of southeasterly shear undercutting the outflow layer. Will probably act as a bit of a braking mechanism until it starts getting some actual movement to the north and shear cuts to near zero.
-
Sometimes has more to do with the in-situ environment around the storm. If it's in a large, moist envelope with extra forcing mechanisms to help (like the entrance region on a jet or a nearby stalled front), then it's reasonable to expect more/more intense rain bands. Low wind shear environments also favor more/more intense rain bands as less dry air can be advected in to disrupt the vertical advection of moisture via areal convection.
-
Yeah, I've observed this kind of effect before, where new data points show up on a chart that don't seem to even fit within the existing PDF. I made that remark about the '21 Northwest heatwave. You could make the very same case right now over the Sahara Desert. "Climate flickering" so to speak. As far as Svalbard is concerned, is it the "emergence" of a new PDF? Are the tails or skew just changing shape? Does it just mean revert? Can't know for sure without additional years of data tacked on. One thing is for sure, the volatility seems to have suddenly increased in the past few years and that by itself isn't typically a great sign for the stability of any system. Once you "un-pin" volatility like that, future moves are usually outsized. In this particular case, we know the Atlantic Water Layer has been steadily shoaling up through the Eurasian side of the Arctic. I'm sure this little episode isn't going to help that.
-
Very 2016'esque looking pack too. A broken mess. 2012's pack was pretty well consolidated at the end of the season which helped it reach its very low extent value.
-
Don't think it's a coincidence we started seeing a spike right after NAtl SSTs started surging. Svalbard sits right along a current that incorporates Atlantic water. I strongly suspect we'll see more deleterious effects once that Atlantic water layer shoals into the Arctic.
-
Still some vulnerable ice that can be melted in the Beaufort and ESS. Almost all of this was gone by this point in 2012. CAA and CAB are below 2012 levels at this point (area wise).
-
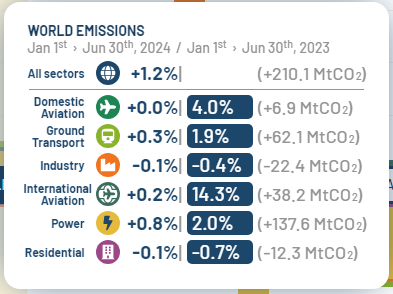
Carbon Monitor with similar numbers. Aviation starting to become a serious issue. Another year of massive growth.
-
CERES EEI finally flipped significantly negative in May on a monthly basis for the first time since Feb '16. We'll see if it's a blip or not, but EEI trends this year suggest we should finally see some more significant cooling in the next several months (thankfully). 12 mo. rolling average is still around +1W/m2, which is still pretty high considering just how ridiculously hot the last year has been (+1.6C above preindustrial). Kind of sinks the entire 1.5C/2C argument when you're still running positive even after a jump in temps like that.
-
The way August is starting, it has a chance to be a record too. Have to think it finally comes to an end in Sep, though. Last Sep was nuclear.
-
I think this year proves a) how important even a short period of preconditioning in late May-mid June is and b) how with even favorable conditions for most of the melt season, it's getting to the point where even that's not enough. Just repeatedly ingesting these overheated continental airmasses is enough to whittle the remaining pack down.
-
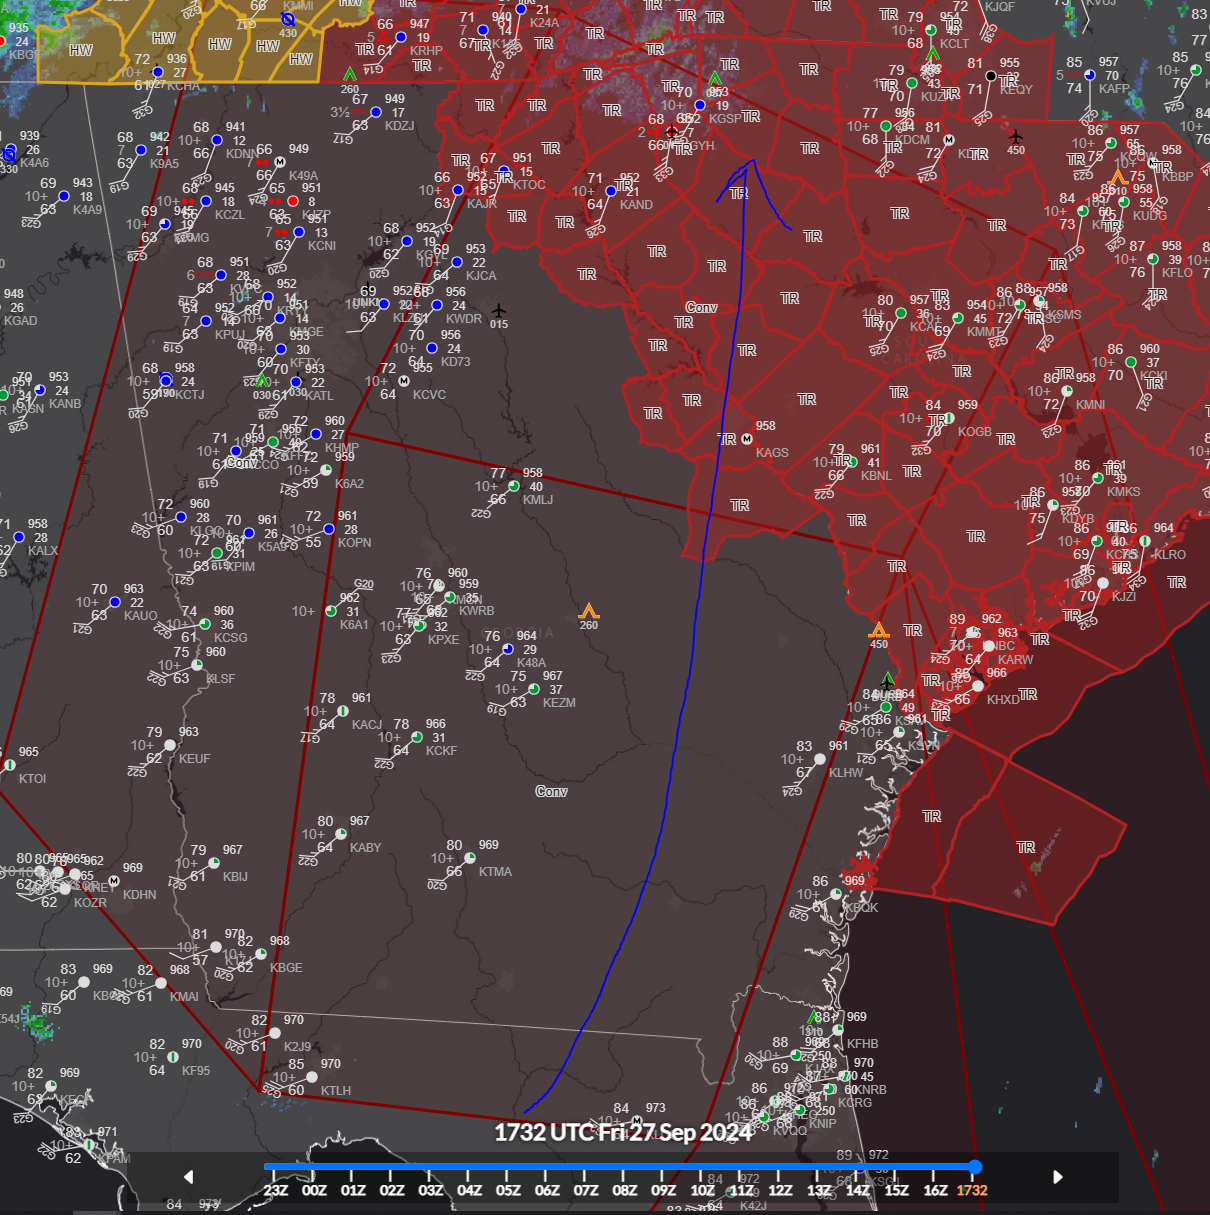
She's still tilted slightly N/NE looking at the radar velocity tilts. Given a westerly shear vector though, that should not take long to fix. Low level center should finish doing a little counterclockwise loop in the next few hours, align and spin up, barring some big dry air ingestion.
-
Out saying that the ice is recovering and it was the highest extent in 20 years, how all "global warmers" were wrong. Exactly the same shit as '16, right before Antarctic sea ice collapsed.
-
I don't want to hear a *peep* about Martz, to be frank. His failed predictions continue to pile up, including sea ice *just this spring*. Always a reliable fade. They always get loudest right before they disappear.
-
Some of the immediate spike is prob due to SSW over the S. Pole recently. I would expect that effect to fade back slowly over the next couple of weeks. Very interested to see how the current marine heatwaves in the NPac and NATL evolve into Sep though.