

ORH_wxman
-
Posts
90,902 -
Joined
-
Last visited
Content Type
Profiles
Blogs
Forums
American Weather
Media Demo
Store
Gallery
Everything posted by ORH_wxman
-
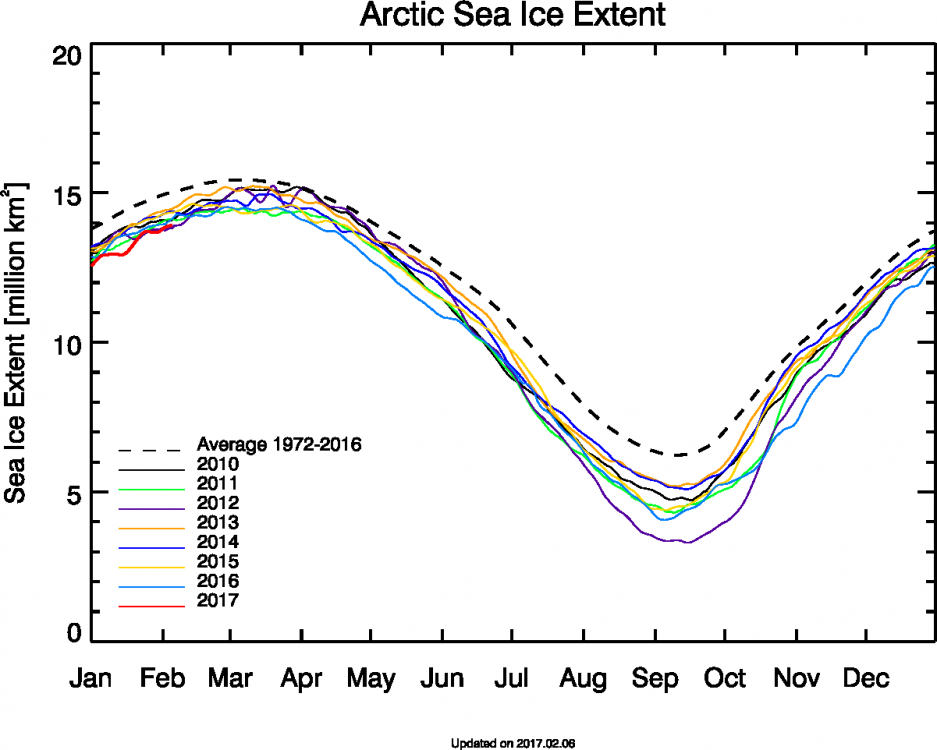
2016-2017 has been quite unique in showing no negative feedback to low volume during the summer. If you look at all the other low volume years, you see a pretty solid recovery in anomaly after the summer months. We'll see if there's any more recovery in March or April...if there isn't, then this year would be the first legit threat to 2012's min since it happened.
-
Too early to make any calls about max extent:
-
I do not agree with the graph that shows very little variability in the sea ice in the 1930s-1950s period. I had already made a post on this further back in the thread, but there is literature that supports higher variability in the sea ice during that time...there's compelling evidence that we had minimums similar to the 1980s and at least early 1990s for many of those years. We will never know for sure though...we have poor data in the Beaufort region from that period. That said, I disagree with blizzard1024 that the warmth now is similar to the 1940s...we've surpassed it recently...it was more similar to the warmth about 15 years ago in the arctic. There may be some localized regions (particularly in the North Atlantic sectors) where the 1940s had similar warmth to today, but not the arctic region as a whole.
-
He has started posting them in the New England forum too occasionally...might have to delete his account.
-
Yeah, in all my reading, I've never come across any big correlations for ENSO to sea ice. There's been some regional effects at times as you noted. There was a paper I also read a while back that linked increased subsurface flow from the Bering sea into the Chukchi during El Nino events which may produce lower sea ice in that region...but the overall effect on the arctic as a whole is pretty weak.
-
He's right, here is very little evidence of these "tipping points" that cause "runaway" melting. This is probably even more true for southern ice. In the Arctic, where ice is thicker, a big volume loss event like 2007 can cause a step-down, but that isn't possible in Antarctic sea ice since most of the ice there melts out every year. And even as the Arctic has gone to a higher percentage of first year ice since 2007, we've seen very little correlation from year to year of values. The Tietsche et al 2011 paper went into depth on this issue when there was a lot of speculation about ice free arctics by 2014 or 2015 due to "runaway melting" after the 2007 min. The paper concluded that you wouldn't see this due to negative feedback in the form of volume regeneration in winter months. This is exactly what we have seen and why those early ice free predictions busted and haven't really come close. They said you needed to blunt the volume regeneration in the form of much much warmer winter temps...and we actually saw a glimpse of this last winter. It was so warm that it probably helped in not allowing some first year ice to survive the past summer that might have normally done so...so we had a pretty low minimum despite the summer weather not being all that hostile. So once we get winter temps regularly surpassing last winter, then there is more physical mechanism for ice free Arctic at the min. The southern sea ice is less well understood and is pretty sensitive to surface wind. The huge Weddell sea polynya was actually a regular feature in the 1970s and has reappeared smaller a few times in the 1980s too. But this recent occurance is the biggest since then. Gordon et al 2007 hypothesizes that the southern annular mode contributed to it in the past. http://journals.ametsoc.org/doi/abs/10.1175/JCLI4046.1
-
We have garbage data from the North American side in the mid-20th century....ironically the best data on the Asian side of the pole for sea ice back then. The Mahoney et al paper is probably the most robust in the literature for sea ice records...but of course it only covers about 3/4th of the arctic region that would lose ice when we're comparing to the 1980s/1990s...we don't have good Beaufort Sea ice data: Then of course you can go on temperatures....the late 1930s through the early 1950s had temperatures very comparable to the 1980s...and at least into the early 1990s. We'll never know for certain because we don't have a full dataset. But I think there is absolutely some compelling evidence that sea ice had years comparable to the 1980s/1990s back in the mid-20th century.
-
Nikolai, cut the sh** if you want your visit to last more than a few days.
-
Fastest rebound/gain on record in September and then the slowest Oct on record...really bizarre autumn so far.
-
This September has seen the largest increase from the minimum on record with still 3 days to go in the month. It is also in contention for the largest net gain of ice in the month (Sept 1st to Sept 30th). So this has definitely been a pretty remarkable refreeze thus far. Should be a very warm autumn with all the latent heat release going on.
-
The distinction between 2007 and 2016 for extent is really not meaningful. This year was definitely worse for area and it is worse for volume.
-
Yeah it is interesting they mention the upper ocean heat...I wonder if the exceptionally strong El Nino made it worse this summer than recent years.
-
The powerful August storms could have certainly contributed. It is hard to get a feel for how much though without better data on subsurface water temps under the ice. If the August storms were a major factor, then I may have been too hasty in dismissing the weather as a non-factor.
-
Now that we've reached the min it looks like on all metrics, time for a quick review. I posted predictions for CT SIA on June 30th this year like I've been doing since 2013. For the first time, this year fell outside the 5-95% confidence intervals. A 5% result would have been a min of 2.58 million sq km on CT SIA, and we finished down near 2.42 million sq km which was actually closer to 2012 (the lowest year) than 2011 (2nd lowest). I'll get back to this in a minute. For extent, it is a bit harder, but loosely converting area to extent made the low of roughly 4.1 million sq km (on NSIDC...a bit lower on jaxa around 4.02) a result that would occur about 20-25% of the time given the information we had on 6/30. So the extent was low, but not well outside of the typical confidence intervals. Getting back to the extreme area result....the first culprit you would look at is the weather. However, the weather wasn't hostile to the ice in July/August this summer. There were a few hostile periods, but they were largely transient and we would have needed to see off-the-charts extreme. So weather isn't really a valid explanation. That leaves two other variables that may have played a large factor....bottom melt and reduced ice thickness from an exceptionally warm January-May period. PIOMAS didn't really have exceptionally thin ice, though the CAB region close to the pole was a bit thin and this is actually where a lot of the area damage occurred as we had a big fragmented pool of floes that was the major contributor of the area loss in August. Cryosat2 was a bit thinner here as well. But we've had very thin ice here before too that experienced summer weather worse than 2016 and yet we didn't see this. In 2013, the ice was significantly thinner in much of the CAB region near the pole, though it did have weather more favorable for ice retention than 2016 did. But still, that leads me to believe we may have had more bottom melt too this season. We don't have a lot of reliable data on this. Some scattered buoys is about it. There is some literature that suggests stronger El Ninos causes an influx of warmer waters at depth into the arctic ocean, but it's not very robust. At any rate, it will be interesting to gather more data as it become available in the early winter with cryosat2. I think a combination of exceptional warmth in spring and above average bottom melt likely contributed to the extreme result. Something like this may have to be taken into account in the future when making predictions.
-
Yeah jaxa had another 78k increase last night...so I think we can call it on jaxa as we are now about 180k above the min...esp given the rate of ice growth seems to be accelerating in the CAB.
-
It makes sense anecdotelly, but the lower mins haven't shown to be any earlier than higher mins thus far if we're using empirical evidence. 2007 was actually one of the later mins on record. 2011 was a bit early, but 2012 was pretty late. I think perhaps the open water this season getting fairly close to the pole but still surrounded by a lot of ice on most sides in the CAB helped cause the early min....assuming we've actually reached the min. The smaller finger of open water there was more vulnerable to closing up quickly once we lost insolation. The higher res U Bremen AMSR2 min occurred even earlier than Jaxa so far...it had a min on 9/1.
-
9/7 would be the earliest extent min on record for Jaxa. I'll have to see what the earliest is for NSIDC.
-
We're taking geoengineering projects.
-
And how do you know it would stop? Climate systems have inertia. How do you know what the effects would be? Our understanding of feedbacks is not precise at all What if you started a cooling process and weren't able to stop it where you wanted and it ran a degree of cooling? That's pretty dangerous stuff. Rapid cooling is probably more dangerous than current warming.
-
On Jaxa which is lower than other datasets since they changed their land mask. I think NSIDC, U Bremen, Hamburg, etc will stay above 4...no guarantee tho. I agree with winter that geoengineering is very dangerous given how much we still do not understand about the feedbacks in the climate as it is.
-
If we get another winter like we just did then it would be a lot more possible. This year was very difficult despite the early low extent and premature proclamations of a record being likely because average thickness was too high. But we will be going into this winter with fairly low volume so if it torches again and there's also good Fram export then that would load the dice for 2017. But if winter is a few degrees colder than last year then we'd probably have to rely on exceptional weather to gun for the record.
-
The trash is negligible to sea level rise. It takes 360 billion tons to raise SL by 1 millimeter...the total amount of trash is almost certainly less than that as the amount per year that ends up in oceans is usually measured in the low millions of tons.
-
I think this year looks worse on the Pacific side assuming the whole ESS arm melts out. 2012 did have a "base" of multi-year ice still left on the PAC/Beaufort side of the CAB that was larger than this year's. Luckily in the winter of 2012-2013, that chunk got pushed westward and helped out with the rebound in 2013/2014 in volume when those summers were cold enough to keep that base of MYI in place. Then 2015 came and melted out most of it in the Beaufort during the torch that summer...and this year, we're seeing the effects of that (along with a warm winter) with the ice melting out fairly easily on the PAC side despite avoiding a nasty dipole. I am a bit surprised at how much ice survived in the Laptev sector given how the ice didn't hold out very well in the ESS....usually the ESS holds out better than the Laptev sector.
-
Definitely slower than the 80N graph tho. So I would guess that were still a good 20 years away from expecting regular ice free arctics at the min. Though the first occurrence would obviously happen sooner during a year when all the stars lined correctly. Though of course this is assuming that 2C figure I said earlier was correct and assuming the rate of warming did not increase or decrease....which is a lot of assumptions.
-
What is the rate of cooling for the entire basin? 80N is really narrow region. It needs to cover the large region of where FYI regenerates volume.
