

ORH_wxman
-
Posts
90,902 -
Joined
-
Last visited
Content Type
Profiles
Blogs
Forums
American Weather
Media Demo
Store
Gallery
Everything posted by ORH_wxman
-
2012 likely already has lower volume now than 2017 (they were basically tied in the mid-month PIOMAS update) and the area at this point as measured by NSIDC SSMI/S (CT SIA by proxy) was significantly lower in 2012 which suggested a lot more melt ponding than this year. We will need a pretty incredible weather pattern to finish lower than 2012 IMHO. It's not impossible, but I'd put the chances as very unlikely.
-
It means 2016 was 330k lower than 2017...you can kind of tell just looking at the years. All the negative years are the bad ones like 2007, 2010, 2012, 2016....and the ones positive or higher than this year are the better ice retention years like 2014, 2013, 2009, etc. This year has kind of an in-between vibe to me...like a 2008 or maybe 2015 (talking area...because 2015 was low extent, but very compacted so the area actually wasn't that low in the post-2007 context).
-
With a couple days left before the June 30th prediction point, here's where we stand on area: 2016: -330k 2015: +30k 2014: +110k 2013: +280k 2012: -700k 2011: -320k 2010: -650k 2009: +640k 2008: +130k 2007: -160k
-
FWIW, the outliers for post June 30th losses since 2007 are 3.70 million sq km in 2010 and 4.51 million sq km in 2016. That's still a pretty wide range that has to be taken into account in the uncertainty.
-
Agreed...the last two years especially make the more recent trend more noticeable. The 2010-2014 (sans 2012) stretch was kind of middle of the pack but we've seen pretty good losses the past couple years and when you start adding in 2012, 2008, and 2009, it might be a newer normal. We'll have to see, but it's becoming harder to envision losses that are closer to 3.5 million sq km after June 30th versus 4 million sq km in the post 2007 years (average since 2007 has been 4.1 million sq km versus 3.56 from 1996-2006 or 3.73 if we include 1979-2006) I'll probably adjust my forecast this year to assume losses closer to the 2007-2016 average post-June 30th.
-
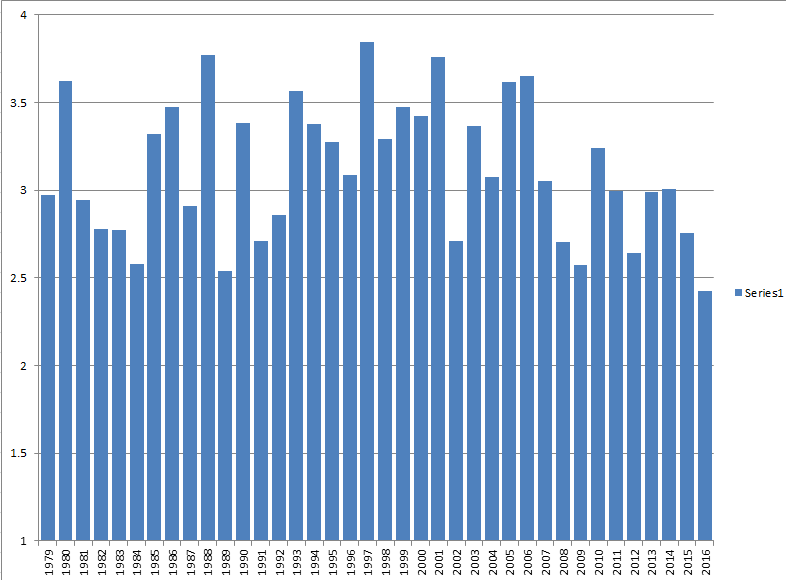
Wipneus has finally started giving some NSIDC updates again, so we can compare to past years on CT SIA....the following shows where other year's are in relation to this year (i.e., 2016 was 240k lower than this year on this date) 2016: -240k 2015: +200k 2014: +240k 2013: +520k 2012: -590k 2011: +10k 2010: -620k 2009: +780k 2008: +150k 2007: -130k You can see the closest match right now is 2011, though 2011 saw nuclear drops in the final 4 days of June, so it will be tough to keep up with that year for June 30th readings (which aren't available until July 1st). Traditionally, I have used the end of June's value to predict the final outcome of CT SIA with moderate success...though last year was a huge miss outside of the 5% confidence intervals. It was the largest loss of area after June 30th in the data base including 2012. So we'll see how well it does this year. As a reminder, here are the minimums on CT SIA (or the NSDIC equivalent) each year since 2007: 2007: 2.919 2008: 3.003 2009: 3.424 2010: 3.072 2011: 2.904 2012: 2.234 2013: 3.554 2014: 3.483 2015: 3.094 2016: 2.427 You can actually see how using past years to predict what 2016 would be all fell outside of what actually happened....the graph below shows what 2016 "would have" finished with if it followed that year...I plotted the actual result of 2016 on the end to show how it was lower than previous variations of area loss after June 30th. The closest result would have been following the losses after June 30th in 1989...but that still would have produced a value of 2.53 million sq km. Previously, there had been no trend in area loss after June 30th, which made the prediction somewhat reliable. But we'll have to see if 2016 is the start of a downward trend or if it was an outlier.
-
The last two winters have definitely been poorer for first year ice with much warmer conditions than the previous 3 winters...though the thermodynamic thickening curve would still have the FYI achieving most of its possible thickness even in those warmer winters...we probably need another 2C or so to really start seriously denting the FYI thickness. I do wish we had better subsurface data on the SSTs up there, because I'm wondering if last year's El Nino played a role in the rapid melt during the 2nd half of the summer by increasing the flow of warm subsurface into the pacific side of the arctic...since last year didn't really have favorable melt weather outside of a very intense dipole for about 2 weeks in August.
-
Agreed with that. The very low volume at the start of the season will make it easier to get into the top 3-5 lowest seasons even if the weather remains kind of mundane, but 2012 is so far ahead of the others that we'll need some pretty big melt weather to catch it.
-
There's actually a pretty good dipole pattern that gets going later this week, but it doesn't look like it will last more than a few days....but I also recall that July 2015 didn't initially look like it was going to last, but it was able to for most of the month. We'll have to see.
-
The rapid regression of PIOMAS seems to suggest that it might have been a little low in May versus reality. Hard to say for sure. We'll see what it does in the next couple weeks.
-
The area losses look like they are mostly coming from Hudson Bay and perhaps the Kara. The Kara is more meaningful, but Hudson bay can deceive us sometimes in both directions...the main basin looks pretty high concentration to me right now. Of course, we don't have SSMI/S area data right now...that's really the most important one for predictive purposes because unlike AMSR2 data, it is sensitive to melt ponding.
-
That's kind of weird. I know the winters there have gotten quite a bit colder in the past decade or two vs the 1990s (we've seen the whole autumn snow cover feedback on the Siberian high)...but it was the opposite in the warm season. I wonder why it would start cooling.
-
Yeah it looks like the only time a drop that high occurred in the record was between 1957 and 1958.
-
Out of curiosity, I plotted the May average temperature for the Siberian region....and it definitely is more of a 1990s profile (and 1980s/1970s for that matter)...so the flukish reversion to a cold May explained the big snow cover anomaly there.
-
I'd say looking at the data that you have to go back to 1996 to get snow cover this widespread on the Siberian coast into mid June. Thanks for the link...I assume you are talking about the level of "blueish" tint to the ice pack between years? I haven't really used this product before, but it's pretty cool. I've mostly used the false color products from AMSR/AMSR2 over the years with the area data from SSMI/S of course since it's a continuous dataset.
-
Do you have a link to the daily plots? Are those the ones from jaxa?
-
It looks like the high snow cover anomaly on the land in Siberia is maybe having an impact on the melt on that side of the ice pack too....maybe this is just "if there's high snow cover on land there then there's probably also high snow cover on the ice there" type argument too...but I'd think the wind off the land there would be much colder coming off a deeper/anomalous snow cover than when it's bare ground and more melted than usual which has been the norm for the past decade...I think this was the first positive May snow cover anomaly since 2004 and the highest since 1996.
-
We need to get bigger area drops soon to stay competitive with the lower years.
-
Of course there will be ice left in September. May was far too cold to entertain going something like 2.5 million sq km lower than 2012's extent minimum even with the volume starting as low as it did. If the weather's bad enough in June/July/August though, we could still beat 2012.
-
Looking at the differences between 2016 and 2017 on Cryosat2, we can try and find areas that might be more or less likely to melt out. I think there's a good chance that we have a more intact arm of ice that extends into the ESS this year vs last year. In contrast the ice is thinner in the Laptev this year, so the melt could go further poleward on that side. Keep in mind this is from April as cryosat2 stops taking measurements as meltponding starts in May.
-
It has to get going pretty quick if 2012 wants to be in the discussion. We'll want to see a pretty widespread warm pattern sustain over more than just the Chukchi/Beaufort...preferably over the Eurasian side too to get the melt ponding feedback going.
-
The lowest concentrations in 2016 at this point was showing up mostly in the Atlantic/Eurasian sector...and it's been really cold this year so far there, so it's probably not showing much melt ponding yet. We'll see how much that matters in the next few weeks...the warmth in the Beaufort/Chukchi could help 2017 play catchup a bit.
-
Euro ensembles want to establish a pretty good dipole pattern for the next 4-7 days...it would keep warm air flowing into the Pacific side of the arctic. That has been the warmest region so far this month...the Eurasian/Atlantic side has been in the deep freeze. But the thinnest ice is from Beaufort to Chukchi and that's where the warmth has been so we'll have to see if that ends up jump-starting things soon. We have some catching up to do in the Beaufort....you can also see how slow the Atlantic sector is this year with the cold spring.
-
You can't be serious about geoengineering. The arctic basin is still a huge area even if it's smaller than the U.S. A more important development is the cold weather that has been over most of the basin this month...particularly the Asian/Eurasian side as that side is typically the first to experience melt ponds and the cold weather is delaying the start of melt pond season there. That could put a dent in chances at a new record this year despite the record low volume entering this season. The chukchi is a bit above normal though, and that is the thinnest ice, so we'll see if that offsets it some, but the cold is forecast to remain quite stubborn for at least another week over the ESS/Laptev/Kara.
-
Looks like 850 temps reached -46C up in that region, that is pretty ridiculous even for there.