ORH_wxman
-
Posts
90,902 -
Joined
-
Last visited
Content Type
Profiles
Blogs
Forums
American Weather
Media Demo
Store
Gallery
Everything posted by ORH_wxman
-
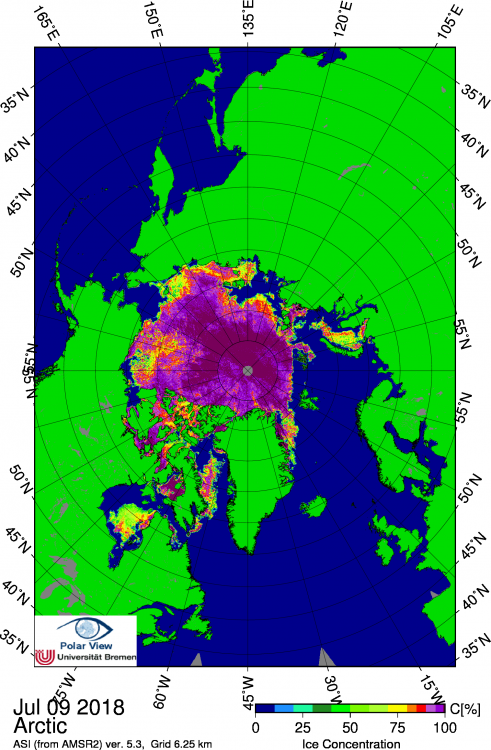
I think we will speed up extent loss quickly....because look at Hudson Bay, Kara, and Baffin Bay....they have high extent for this time of the year, but they (esp Kara and Hudson) are very low concentration. So it will all go "poof" pretty soon and you'll see some big extent losses because of that. That said, for the main ice pack in the arctic basin, the weather will remain quite favorable for ice retention, so after Hudson/Baffin/Kara melt out, we will probably see another slowdown.
-
That means that snow is likely accumulating on the ice pack too...that's going to slow down melt further. The rest of Hudson Bay is finally going and same with Baffin and Kara so the extent loss should be decent over the next week...but I'd expect area loss to slow....we had seen a big jolt in area loss with that brief but intense torch at the end of last week.
-
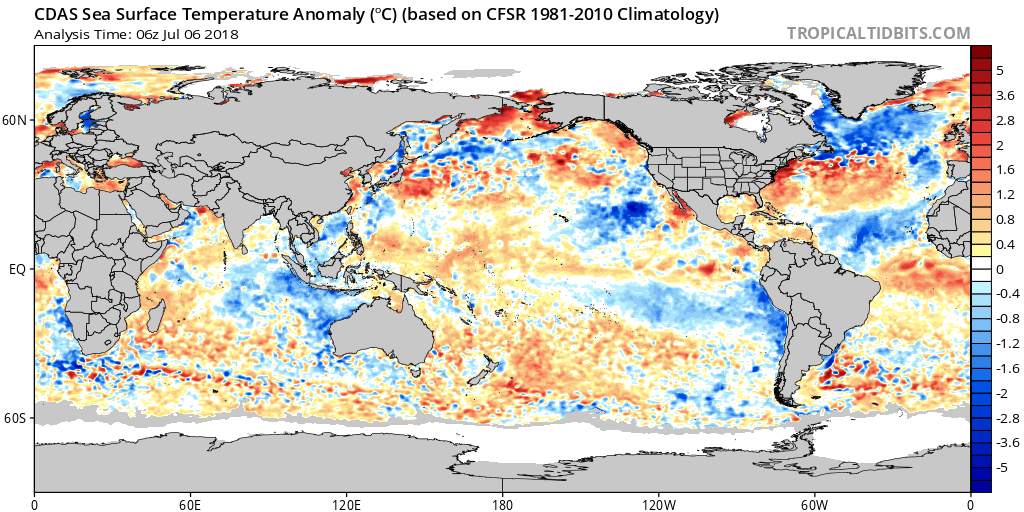
We've been speculating on here for some time...but I can't help but think the big change in SSTA pattern in the North Atlantic south of Greenland starting in late spring of 2013 is definitely linked to the different summers we've been seeing since then. Seems like too much of a coincidence...I'm not sure how much is chicken/egg....but we do know that feedback loops will develop with persistent SSTA patterns...so if there's isnt' a very large atmospheric force to overcome the status quo, then we keep seeing a reversion back to the +NAO/+AO type pattern. I thought this year might be a little different because we saw some impressive blocking up there in March and then into spring time we saw more bouts of good blocking. We hadn't seen any sustained blocking in the cold season like we saw in March since winter of '12-'13....so it was definitely a change. But it flipped a switch again once we got near June. But that negative SSTA in the N ATL has been pretty persistent for 5 years now...maybe some brief interludes in 2016 I recall and late last summer. I remember back during the big dipole years of 2010-2012, it was bright red up in that region.
-
Yeah this is about as massive as a vortex as you'll see in the arctic during the summer. The only variable factor working strongly against the ice over the next 2 weeks is the furnace the ESS sees over the next 2 days before the vortex takes over.
-
PIOMAS just came out and 2018 volume is currently 6th lowest....ahead of 2010, 2011, 2012, 2016, and 2017....slightly below 2013. These are obviously a bit different rankings than the extent/area numbers since it is also taking thickness into account...esp the multi-year ice and there is less of the thicker MYI these days.
-
Keep the conspiracy crap out of this thread....this is for arctic sea ice.
-
That's a bad look for anyone hoping we get a monstrous 2nd half melt pattern.
-
My prediction for final sea ice area minimum is 3.30 million sq km +/- 200k. Below is a histogram of results taking each year's melt from here on out and subtracting that amount from 2018's area on June 30th....as you can see, the highest melt from June 30th onward was in 2016 (which produces the lowest potential result). If we matched that, we would see an area minimum of 2.91 million sq km. That would be 5th lowest on record. Every other result gives us an area over 3.0 million sq km. I had previously taken the 1979-2010 average because area loss from June 30th onward had seen no trend...but recent years like 2016 and even 2017 (which had large area loss after June 30th) have put the trend line slightly negative...so I've started using the post-2007 area loss average to augment the prediction....hence the 3.30 million sq km prediction. The average of all years would produce a minimum of 3.59 million sq km...instead of just the post-2007 average of 3.30 million sq km. As for extent? Extent is much harder to predict....compaction can play a large role as we saw in 2015 when the area min was 3.1 million sq km but the extent min was down near 4.25 million sq km. The NSIDC September average is probably easier to predict. For the daily min extent on NSIDC, I'll predict a 4.75 million +/- 300k and for a monthly average, I'll predict 4.9 million +/- 300k. Knock about 200k off the daily number for the jaxa daily minimum extent since jaxa changed their algorithm back in 2014.
-
Keep this On topic. This isn't a politics forum.
-
Sea ice area is the highest value at the end of June since 2013. I'll have my prediction later for final extent and area once I crunch the numbers more...along with the histogram of possible area outcomes based on historical losses for each year since 1979. But as a prelim post, the chances of an area record low are basically zero and top 3 lowest is close to that. We just didn't get enough early melt ponding.
-
NSIDC area data looks to be "correcting" back to more normal numbers...we saw an increase of area of 471k after a drop of 750k yesterday...so it's a 2 day net drop of 279k which is 139k per day....much more normal for this time of the year. Still not totally sure if the data is good, but here's where we stand if it is: 2007: -412k 2008: -130k 2009: +388k 2010: -909k 2011: -579k 2012: -1.05 million 2013: +26k 2014: -141k 2015: -226k 2016: -587k 2017: -260k We're basically running neck and neck with 2013 still with two days remaining in the month.
-
The current SSMI/S satellite is beyond its lifespan so it needs maintenance more often now. There's no conspiracy to hide data. It wouldn't matter anyway...we have AMSR2 up there which is completely unrelated. So even if SSMI/S never came back or had "conspiracy" data, we would still easily track the ice sheet through AMSR2 to the minimum. AMSR2 is better anyway with the exception of June when the inferior SSMI/S sensor gets fooled more easily by melt ponds so it allows us to predict better...once in July and August, we start looking more at AMSR2 (which is tracked by sites like JAXA and U Bremen)
-
Today's data is def contaminated...it's showing a loss of 750k, lol...but yesterday's was not that weird...we've seen 250k drops before many years (not every year though)...esp when you consider that more than half of that was from the Hudson/Baffin alone which were running pretty high. Today's data is no good though, so the outage is definitely here. We'll just have to see how long it lasts. Hopefully we're back up in 2-3 days. The concentration map got all mucked up in the CAB and CAA, so it's clear they are doing something with it.
-
Yeah weird, I thought we'd stop getting data, but it's still flowing in. Melt picked up big time though....1 day loss was 256k (!!). Largest by far yet this season for area loss. 2007: -782k 2008: -308k 2009: +323k 2010: -1.08 million 2011: -449k 2012: -1.06 million 2013: +64k 2014: -216k 2015: -253k 2016: -714k 2017: -470k Obviously still a ton of work to do to be in contention for a top 5 year despite the big one day area loss.
-
I'm not sure exactly what they are doing but previously when SSMI/S has been out, the data didn't look suspicious when it came back online so I wouldn't be too worried. I'd expect a definite uptick in losses though if it's out for 3-4 days and then comes back because the weather is turning more hostile up there in the next day or two. The Chukchi/Beaufort region was by far the most vulnerable coming into the season with the later refreeze there this past winter...the ice was pretty thin. Esp the Chukchi. The huge stall there in June is going to protect the adjacent CAB that could have been taking on a very early assault had the Chukchi melted out very early.
-
I'm not that impressed either with the dipole that is forecasted for the rest of the week and maybe into early next week. It's going to help pick up the melt again but it's kind of an ugly dipole...low pressure still over Greenland and the high is centered more over the Beaufort/Chukchi rather than over the CAB and Greenland and it's not that strong. Usually like to see 1030+ or if not, a very strong gradient between Greenland and Siberian coast to sweep lots of warm air over the pack...but we don't really get either.
-
Yeah looks like we snuck in one more day of data....here's updated area numbers. The gap continues to widen as 2018 has basically stopped losing area for the past several days. 2007: -1.03 million sq km 2008: -228k 2009: +352k 2010: -915k 2011: -429k 2012: -1.05 million 2013: -77k 2014: -245k 2015: -295k 2016: -817k 2017: -483k Given how little melt 2018 has had recently and the fact it has a lot of area still in Hudson bay, I decided to filter out the peripheral seas. Even when I do that, 2018, is basically neck and neck with 2013 and 2014. It is 10k ahead of 2013 and a lowly 300 sq km ahead of 2014 when i eliminate Hudson, Baffin, Greenland, Othotsk, St. Lawrence, etc....and it is much further ahead of 2015 than above when I use that filter. 2015 still had a lot of ice in those peripheral seas too which was masking the central area deficiency a bit. It is hard to imagine a top 5 being really possible given that data...but I suppose we cannot completely rule it out if some crazy weather pattern locked in.
-
We will be without NSIDC data for a few days. Planned maintenance from 6/25-6/29.
-
The data is from NSIDC...it is sea ice area (not extent). Area from NSIDC (or anyone who uses SSMI/S) is a better predictor of final minimum extent at this point than extent itself is...and that is because the SSMI/S sensors are sensitive to melt ponding....and melt ponding in June is very crucial to the final minimum. So using the area data from that source is sort of like de facto real-time melt pond data. The ice sheet has gotten off to a very slow start with melt ponds which will make it difficult to reach extremely low extent and area in September....even if the weather turns more hostile. It is still probably theoretically possible to get a bottom 3 year, but we will have to see a very special pattern sustain itself for weeks to make up for the slow start.
-
We've made the comment before...but that North Atlantic cold pool really started becoming noticeable in spring 2013 and that was also the last time we saw sustained NAO blocking in the cold season. We've since seen shorter intervals occasionally (like Jan 2016 before the mid-Atlantic blizzard and this past March perhaps may have been the most impressive since 2013) but it's been hard to come by what we saw multiple times during winters between 2009-2013. Ive wondered if these were all related. I tend to lean in the direction of yes.
-
Paltry area melt continues for the time being in 2018....updated numbers: 2007: -988k 2008: -162k 2009: +439k 2010: -776k 2011: -401k 2012: -995k 2013: -29k 2014: -207k 2015: -268k 2016: -749k 2017: -363k
-
The model would suggest pretty flat trends in extent minimums out to the late 2020s before resuming a faster downward trend. It is definitely fairly impressive it predicted the current stall....we will just have to see if it is accurate in how long it lasts. It would suggest another decade of mostly the same.
-
Here's other years compared to 2018 now: 2007: -886k 2008: -77k 2009: +554k 2010: -599k 2011: -358k 2012: -908k 2013: +3k 2014: -125k 2015: -213k 2016: -666k 2017: -242k Only 2013 and 2009 have higher area than 2018 now in the post-2007 world, and 2013 is basically a dead heat...only 3k difference. I'm surprised 2014 has fallen lower than this year...though 2014 does finish the month slow. The forecast definitely calls for worsening weather for the ice in a few days, so we may pick up a little steam before June ends....finishing the month with less area than 2014 wouldn't be surprising given those two pieces of information. That said, we will need to see something pretty special to achieve a top 3 or even top 5 melt season.
-
I think that is Nikolai on that forum...who used to post on here. There's no empirical evidence whatsoever that the ice is in worse shape than 2012 was at this point.
-
Yeah I'd agree with that. It's not a real death ridge like we had at times during 2007, 2010, 2011, and 2012....or even July 2015. But it should accelerate the melt ponding more. The area loss has been really weak the last few days. We're falling way behind the big dog years now. I'm on my phone now, but probably tomorrow when back on my PC I will do another rundown on the numbers. I think we're around a million sq km behind a year like 2012 now.