ORH_wxman
-
Posts
90,902 -
Joined
-
Last visited
Content Type
Profiles
Blogs
Forums
American Weather
Media Demo
Store
Gallery
Everything posted by ORH_wxman
-
It was pretty obvious we weren't getting a 1995 minimum last year. The area data near the end of June did not support anything remotely close to that. I will post my prediction again this year. Here is last year's prediction: https://www.americanwx.com/bb/topic/48618-arctic-sea-ice-extent-area-and-volume/?do=findComment&comment=4953872
-
We'll have a better idea soon....the next 3 weeks will basically decide if a new record is possible in September. This is definitely our best shot since 2016....2016 just didn't quite have the melt ponding that 2012 did in June, so the momentum wasn't able to carry us to a new record. The last two years (2017 and 2018) haven't even been close. We knew those seasons would be pedestrian in the post-2007 sense by the end of June.
-
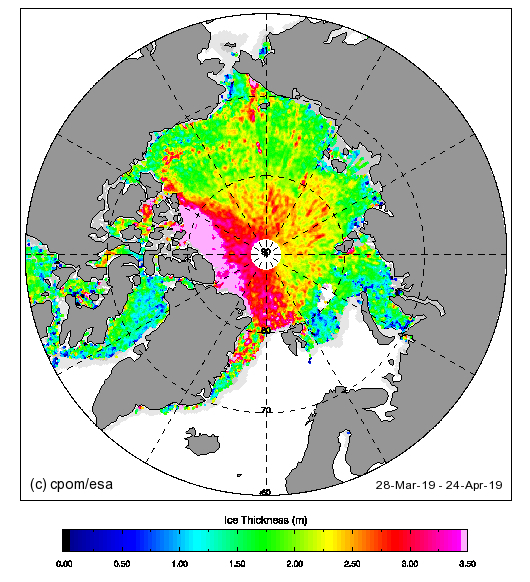
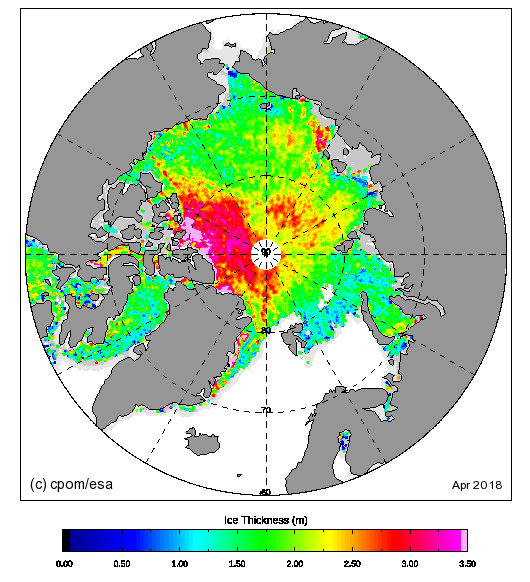
Looks like Cryosat2 is done scanning for the season....based on the prelim results this year, it looks like the Beaufort, Chukchi, and western ESS are thicker than last year, but the eastern ESS and parts of Laptev are thinner.
-
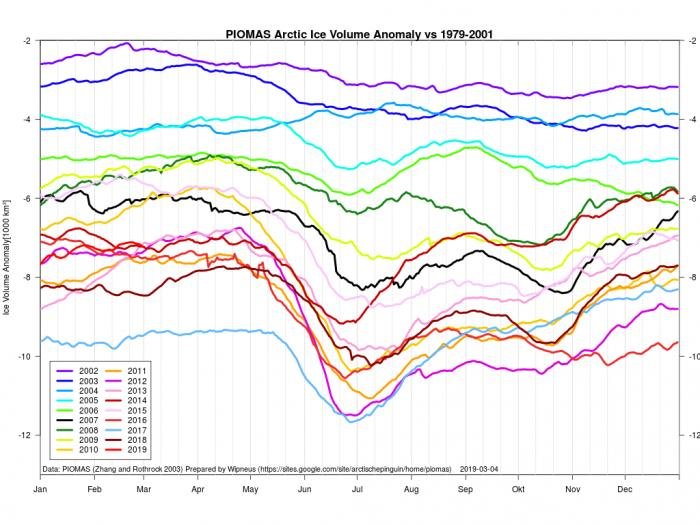
Still about another month to go before max volume....but February data is in and we're currently 7th lowest volume on record....between 2013 and 2014 right now. Spring volume is more predictive than extent/area this early, but it's still not nearly as good as area in the month of June. As an example, the highest volume since 2009 in spring was 2015 and that year had poor weather in summer bring it lower than many other years that were lower in the spring. We're not that far above 2012 either, and that year was by far the lowest on record by the time we got to September. Graph courtesy of user wipneus at arctic sea ice forum This is an anomaly graph, not a raw value graph
-
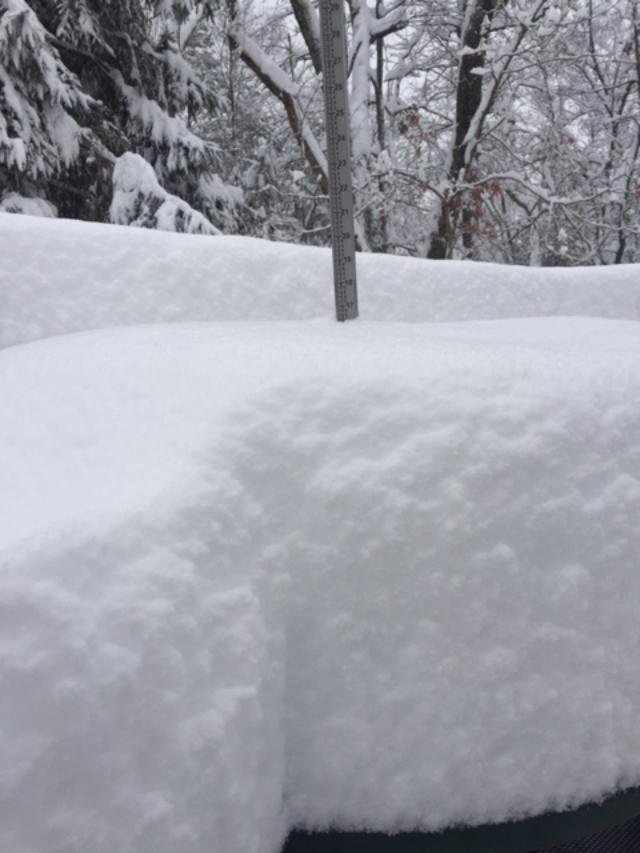
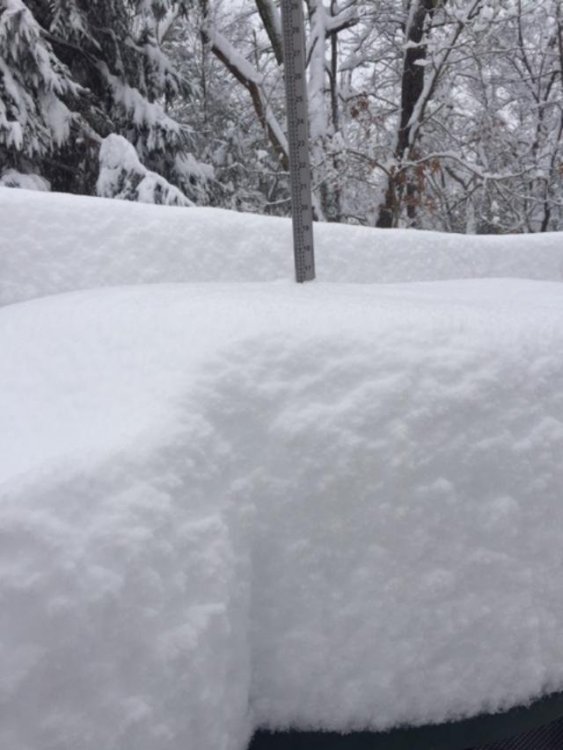
Yeah this stuff fell so fast and it also didn't have massive ratios....they were good, maybe 15 to 1, but not jspin or LES ratios. It really didn't compact until the snow was almost stopped...and even then, it took a good hour to really get noticeable. I had the snow stick stuck in the same spot the entire time once I went out to start cleaning up and it didn't dip below 16" until maybe 9-930am.
-
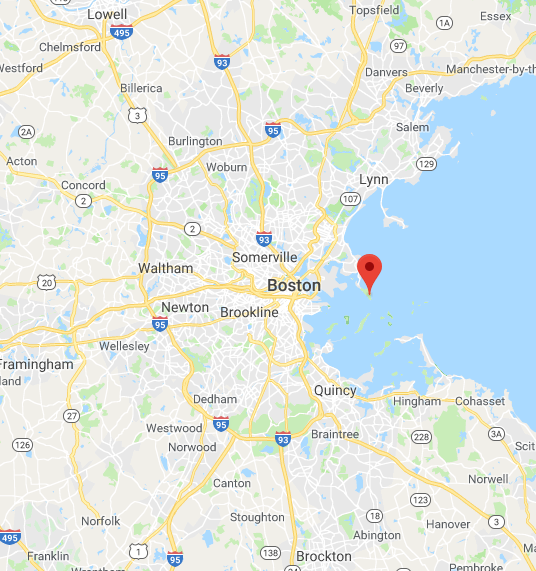
Right before this, it was also in Winthrop, but it was at least further north more on land and not at a treatment plant in the middle of the atlantic ocean.
-
Yeah and there's even spots in Cumberland that get over 500 feet I think....really variable town...but most live down in the 100-250 foot range
-
Did you tell them you are up on a 350 foot hill? That will matter too in a storm like this where you probably were closer to 30F instead of 31-32F like it might be down near the blackstone river.
-
Correct....
-
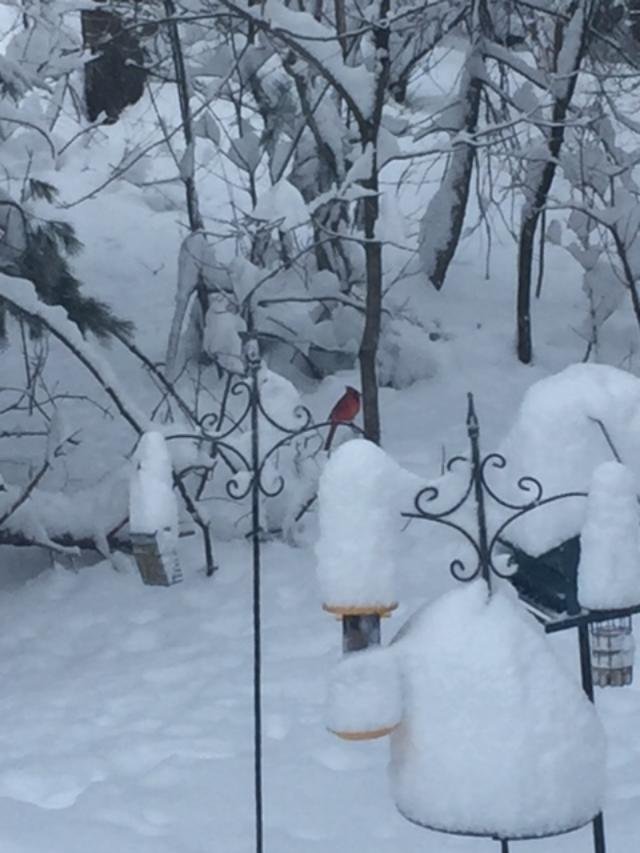
Red marks the spot....
-
This map looks very similar to a lot of short term mesoscale guidance yesterday....they did very well once inside of about 18 hours.
-
Almost 17 inches in Holliston


-
If you start on this page, I post a radar shot probably every 10-15 min for the next 3-4 pages. You can see the progression. https://www.americanwx.com/bb/topic/52144-the-little-storm-that-could-march-34/?page=13
-
Back edge is hauling along....prob through ORH before 12z.
-
BOS is in for a fun couple hours
-
Looks like the band is starting pivot now a bit
-
Scooter has mentioned they seem warm recently....I would say 34F is def a little suspicious given the snow rate right now and then looking at this mesonet map
-
You're def close to ground zero in Killingly area there...the absolute max may be a little further east or northeast, but man, you'll be close. It's been going to town there on radar with still a couple hours to go of really good stuff.
-
This is pretty amazing....not even in the best stuff yet, but its gotta be 2-3"/hr.
-
18 spot there? They have to be 10 already....
-
We'll have to see how much of that batch a little further west near LI is real vs a little extra bright banding because of sleet...but it may tickle those further west than the leading band near Ginxy:
-
Gotta be the most intense CCB fronto bands we've seen since Feb '13....its obviously a lot faster moving and doesn't cover as wide an area, but that's really impressive stuff.
-
We need Ginxy to give us an update....or that guy NECT in Windham county to his north....those are incredible echoes and they are snow...wonder if they are strutting 5/hr there:
-
Zoomed in
-
Here comes all hell about to break loose for central and eastern areas: