

ORH_wxman
-
Posts
90,902 -
Joined
-
Last visited
Content Type
Profiles
Blogs
Forums
American Weather
Media Demo
Store
Gallery
Everything posted by ORH_wxman
-
Yeah that's a safe assumption.
-
High dews and lots of SW flow killed the daytime heat there. Usually want more WNW or NW flow and lower dews to get those 91-93F+ readings.
-
It's inline with other obs though so that's why it isn't that weird. That's why we bother looking at MADIS.
-
lol at BED the last month or so.
-
And it also mattered when talking record highs. At least to us in here. It doesn't change anything on the macro scale. We're not saying it hasn't been hot. But you cannot ignore that data either.
-
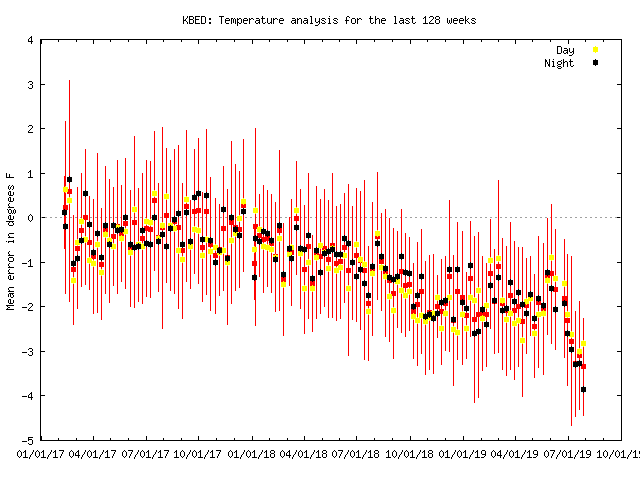
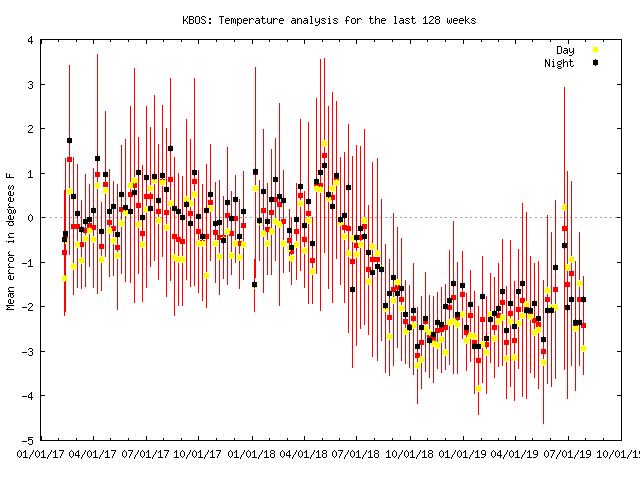
Yeah and they lost their cold bias low temp readings (due to ASOS being basically in a swamp) Wonder if there's some fresh blacktop nearby or piles of rocks, lol. Who knows. BOS and OWD don't look like gradual change based on new mesos coming online. Looks like something physical rather than a statistical artifact. Below is BOS for reference.
-
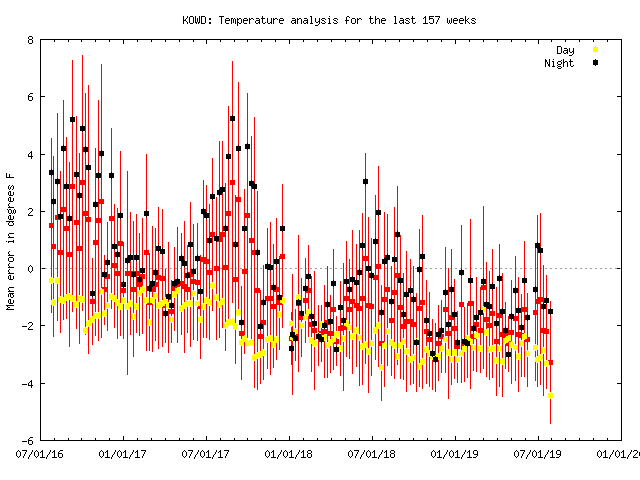
OWD had a pretty bad step change in late 2017 and the last datapoint in 2019 looks like another step change but we'd want to see a few more weeks worth to be sure
-
ORH isn't showing any recent drift aside from their mid-2017 blip.
-
That's kind of funny to read in light of the recent * at BOS.
-
Holy crap at 2001 at MWN, lol...sub-25F low.
-
Does the coop still use a non-ASOS thermometer. I'd hope it does.
-
Maybe...but both can still be true. It's not a either/or with these things. The break in ORH graph just looks really really weird and extremely unlikely to be explaned by a gradual warming trend. Maybe ORH had different pre-ASOS instrumentation than CON? Not sure how to look that up...but that could be another explanation.
-
Blue Hill has an ASOS....but I know they keep alternate records. I just don't know if they are easily available online.
-
CON didn't pull 30s in the 1980s either despite several big "low dew" years on the graph comparable to the 1970s. I wonder if subtle development in the area made them unable to radiate like they could even 10 years earlier. Rad sites are annoyingly fickle which is why a well-mixed site like ORH popped out to me. I also noticed CON had zero hours of sub-40 dews in 1993 and 1994 while ORH had logged a lot of hours (esp 1994) before going basically silent in 1995-onward.
-
1920s weren't nearly as dry as the 1930s? The '30s were pretty exceptional on both extremes...it had exceptionally cold temps and also exceptionally hot temps. The CONUS acted closer to a desert than at any other point.
-
Yes I know....dry = colder mins.
-
A place that is well-mixed and not prone to other factors like radiational cooling (esp with UHI development) such as ORH airport makes me a bit suspicious when I see such a clean break like that. It's not claiming that the ASOS is the only source of the trend...of course it isn't. From a pure mathematical standpoint, we're going to see higher dews as we warm....every full degree C rise produces 7% more water vapor. But in addition to the underlying trend, it's always fascinating to me to find where else certain statistical oddities may come from. That ORH graph is very unlikely to happen by pure chance....though unlikely doesn't mean impossible. In a warming world, we'd still expect cold Julys like 2000 and 2001 to have some sort of resemblance to early 1990s and 1980s cool Julys.
-
1930s were dry....dust bowl era....epic drought in middle of country so not really conductive to high dew airmasses. There's probably another anthropogenic trend in dewpoints that is unrelated to GHG warming....midwest/plains agriculture. We have far more corn acreage now than we did in the middle 20th century and it's a lot more productive and efficient. This will make airmases coming out of the plains more moist than previous years.
-
Interesting that ORH has a clean step break around the time ASOS went in (1995). Could just be coincidence but one wonders if there was some difference in instrumentation.
-
Well the area right along the Arctic Ocean isn't part of the region that has been bucking the trend. Maybe that's why? That's the area where permafrost is probably the deepest too. Its been more across the boreal forest region over the interior of Siberia. We also have to take into account the media too...we're probably more likely to hear of records in the media versus "flat trend in temperatures across the taiga!!"...doesn't quite have the same ring to it.
-
I've seen this phenomenon on the seasonal scale (winter comes to mind where our trend is flat the past 20+ years), but running the numbers on an annual basis doesn't really stick out. We're warming in SNE here around 0.2C per decade going back to the 1990s which isnt that different than the global trend. The largest area that seems to buck the global trend these days is Siberia which has large areas that haven't seen any warming at all in the past 20-30 years...largely driven by colder autumns and winters.
-
If it fits his narrative of how the climate should be, then it makes sense.
-
'07 and '08 were actually warmer than normal in ORH. Esp '08...'07 was near normal. But '09 was the 5th coldest summer at the airport site going back to 1948...including the coldest June/July couplet on record edging out 1982. Weve only had 2 below normal summers since then...2014 and 2017 and both were not by much.
-
On extent or area? I think 2007 both extent and area are very good chances to be surpassed by 2019...2016 has a good chance on extent but not as good for area. Prob like a 50/50 chance or less to pass 2016 area.
-
I agree with the low chance of beating 2012 at this point. I wanted to see a pretty good sized lead heading into late July/early August. I might go higher than 3% on extent but not by a lot. Maybe 10-20%. For area I probably wouldn't go higher though as we slightly trail 2012 in area.


