ORH_wxman
-
Posts
90,902 -
Joined
-
Last visited
Content Type
Profiles
Blogs
Forums
American Weather
Media Demo
Store
Gallery
Everything posted by ORH_wxman
-
We gotta remember this in winter when he switches to using ORH.
-
It's still there on both OP and ensembles.
-
Lol he just made it up.
-
Kevin was kind of spinning it too assuming I meant it had to be a cape tracker. I never even mentioned that. I just said, IJD is sneaky good in those CAD events to see when it's about to collapse for Kevin. Frequently he will go within an hour of IJD spiking 38 to 40.
-
Lol you know the type of storms I was talking about. Those triple pointers over SE MA that the primary tracks into Ny state...you spike to 36-38 eventually while it never makes freezing to your north until like 33-34F at FROPA. Or maybe it's just a straight track over ginxy. Worst ice storm of my life did that back in 2008.
-
IJD is secretly a good place to look when you know the CAD is breaking at the sfc around Kevin. They'll be 33F and rain while Kevin is like 28F and ZR/IP. Then all of the sudden IJD will spike to 38F and you know he's done within an hour and it's 33F and RA up on the massif while it rots in the 20s for another 3-5 hours up in interior MA.
-
Attribution Report for the July 2019 Heat in Europe
ORH_wxman replied to donsutherland1's topic in Climate Change
Oh I know why he's doing it. That was mostly irrelevant to my overall point though. I was actually talking about him doing that kind of stuff when he was still head of GISS and publishing papers. I was comparing him to Pielke jr in that often the rhetoric didn't match their peer reviewed literature. A lot of the climate science debate has become not very scientific at all and centers around blogs and also interwoven into politics about what "should be done" about it versus the actual numbers. It's understandable at times, but it also hurts the integrity of the science in those times the literature takes a back seat. Btw, I'm not in here to dispute the claim of heat wave attribution. Increased heat waves is one of the few attribution studies that have very high confidence in the science. -
Attribution Report for the July 2019 Heat in Europe
ORH_wxman replied to donsutherland1's topic in Climate Change
Pielke jr's rhetoric is probably fair to be called "impact skeptic"...but it obviously shouldn't be confused with his peer review literature. We could probably make a similar comparison to former head of GISS Dr James Hansen in the opposite direction...he often had very alarmist rhetoric that was fair game for subjective criticism but the literature he published was frequently more subdued than that. It seems to be an increasing issue in the science these days. Separating the twitter feeds, blogs, and press release articles from the actual literature is getting harder and harder to illustrate to the lesser informed public. -
Attribution Report for the July 2019 Heat in Europe
ORH_wxman replied to donsutherland1's topic in Climate Change
You cant look at raw data when it comes to temps...the data has problems that need to be adjusted to make the dataset homogenous. Biggest problem is TOBs (time of observation) adjustment. These are real...TOBs produces about a 0.3 to 0.5C warm bias on temps in the US (and some other sites in North America) in the early/mid 20th century...depending on exact dataset...it might be as low as 0.1 or 0.2 if you use a regional dataset like the southeast US. That's why if you look at the raw data, you'll find that the Arctic temps look similar to the 1930s and 1940s. There are other adjustments too like the change from the older Liquid MMTs to digital thermos. -
Attribution Report for the July 2019 Heat in Europe
ORH_wxman replied to donsutherland1's topic in Climate Change
Pielke has definitely been the subject of smears. It's pretty embarrassing for the scientific community actually given that a lot of his stuff is legit. Chris Landsea is another who got smeared a bit when he published important literature on hurricanes that proved the increase in the Atlantic was almost all due to observational limitations in the early/mid 20th century. Desmog blog ranks as a far leftward bias news site even though the factual reporting is high. So it is no surprise they would try and discredit or downplay anyone who has a milder view of climate change attribution studies like Pielke jr. -
1980s/early 1990s probably skewed some perception too for those of us that remember. They are truly putrid snow years that are unrivaled in the record...that period sticks out like a sore thumb. There were some pretty bad periods between the late 1920s and early 1950s but none of them could match that 1979-1980 though 1991-1992 stretch. So while the prolific snow producing storms since 2000 are certainly note-worthy, they are especially glaring when compared against the backdrop of the 1979-1992 period. It's like "let's take the most prolific 15 or so years and compare them against the worst 15 year stretch...I bet that might make people talk"...for our generation, say those born from the 1970s to early 1980s, we had both periods as really our only experience for SNE winter...and they essentially happened back to back save maybe a brief "shoulder period" in the mid to late 1990s. Its hard to really say what "normal" is too when it comes to New England snow climo. I can spit out the numbers of course...I know them all like the back of my hand....but it's the way we get to those numbers that is the question. We've had so many periods that were seemingly unmatched in the record. The late 1950s through early 1970s produced nary a below average snowfall season in SNE. Esp over the interior...the consistency was incredible. So was the cold. They were much snowier and colder winters than the previous 30 years. Now, after a long period of declining-in-frequency KU events from the 1970s through the 1990s, we all of the sudden see the massive reversal and now the winter spits out a 20" KU like Halloween candy being tossed out to trick our treaters. Btw, I do agree some of the individual storm numbers are somewhat inflated versus 30+ years ago due to measuring technique, but that only explains a smaller portion of the situation. Anyways, everyone is going to have theories and thoughts on the matter, but nothing will be better than another decade of data and then another decade after that to see what happens. I can guarantee none of the literature in the late 1990s and early 2000s saw the snow boon years coming in New England.
-
Agreed. The increased moisture just is not enough magnitude to explain it. We've had like a 4% increase in WV here since the 1980s. There are other factors...and granted, some could still be related to climate change, but perhaps not as directly.
-
Well that differential in SSTs was less in 2016...my comment was that why would we expect it to remain there? The gradient is all relative. Is there a reason to expect a hot spot in the central PAC that warms faster than the equatorial PAC on a magnitude that makes the 2016 super Niño less effective? (I.E do we expect the subtropical PAC to continue to warm wayyyy faster than ENSO like we saw between 2013 and 2016? No probably not. At least that is what most of the literature points to. Of course, we should keep in mind that the literature is not very accurate when it come to differential warming. It can do okay when it comes to the global trends but regional tends to get tougher. So maybe it's a new normal...but I am typically skeptical of claims like that and for good reason. They usually revert back closer to the global trendline. The exception may be the polar regions where ee expect some pretty enhanced trends...and even some wildly reversed trends at times like seen in Antarctica. But most of the earth in between seems to ebb and flow with the an underlying warming trend.
-
The lack of gradient between enso region and the rest of the PAC shouldn't be a new norm unless there is a distinct reason to believe that the rest of the PAC is going to have an underlying warming that is greater in magnitude than the ENSO region. The equatorial cold tongue has been an issue in observations vs climate models but the warm pool to the north of there that has set up off western Mexico and out into the central PAC is a newer phenomenon that is unlikely to remain there relative to the rest of the basin and vs ENSO region in the equatorial PAC. Of course, maybe it will remain...we don't know for sure...just like we didn't know for sure if the monster blocking of 2009-2013 would remain or the positive NAOs of the late 1990s. Odds are though it will pass onward to something different in a relative sense.
-
That tool on NSIDC uses the 5 day running mean instead of daily values.
-
IMS is a deferent source than JAXA or NSIDC and it looks like that graph doesn't have any data beyond late July.
-

-
Ill take this weather all summer. Maybe give one week of HHH for the beach/lake vacation.
-
The field as a whole tends to overreact to the most recent events. In the late 1990s and early 2000s, there was a lot of stuff coming out how global warming was causing more +AO/+NAO conditions due to the PJ retreating north and intensifying/enhancing the vortex near the pole. Then by about 2011, the reverse started showing up...Arctic amplification was causing huge NAO blocking and massive "warm Arctic, cold continent" winter patterns and prolonged PV invasions due to "wavy jet" theory. This persisted for a while and now we're starting to see some new narratives like the enhanced subtropical ridging due to Hadley cell expansion, etc. To me, it's mostly flavor of the month. It's not that the theories are wrong, it's just that each variable seems to get too much credit during the seasons where the effects are most noticeable.
-
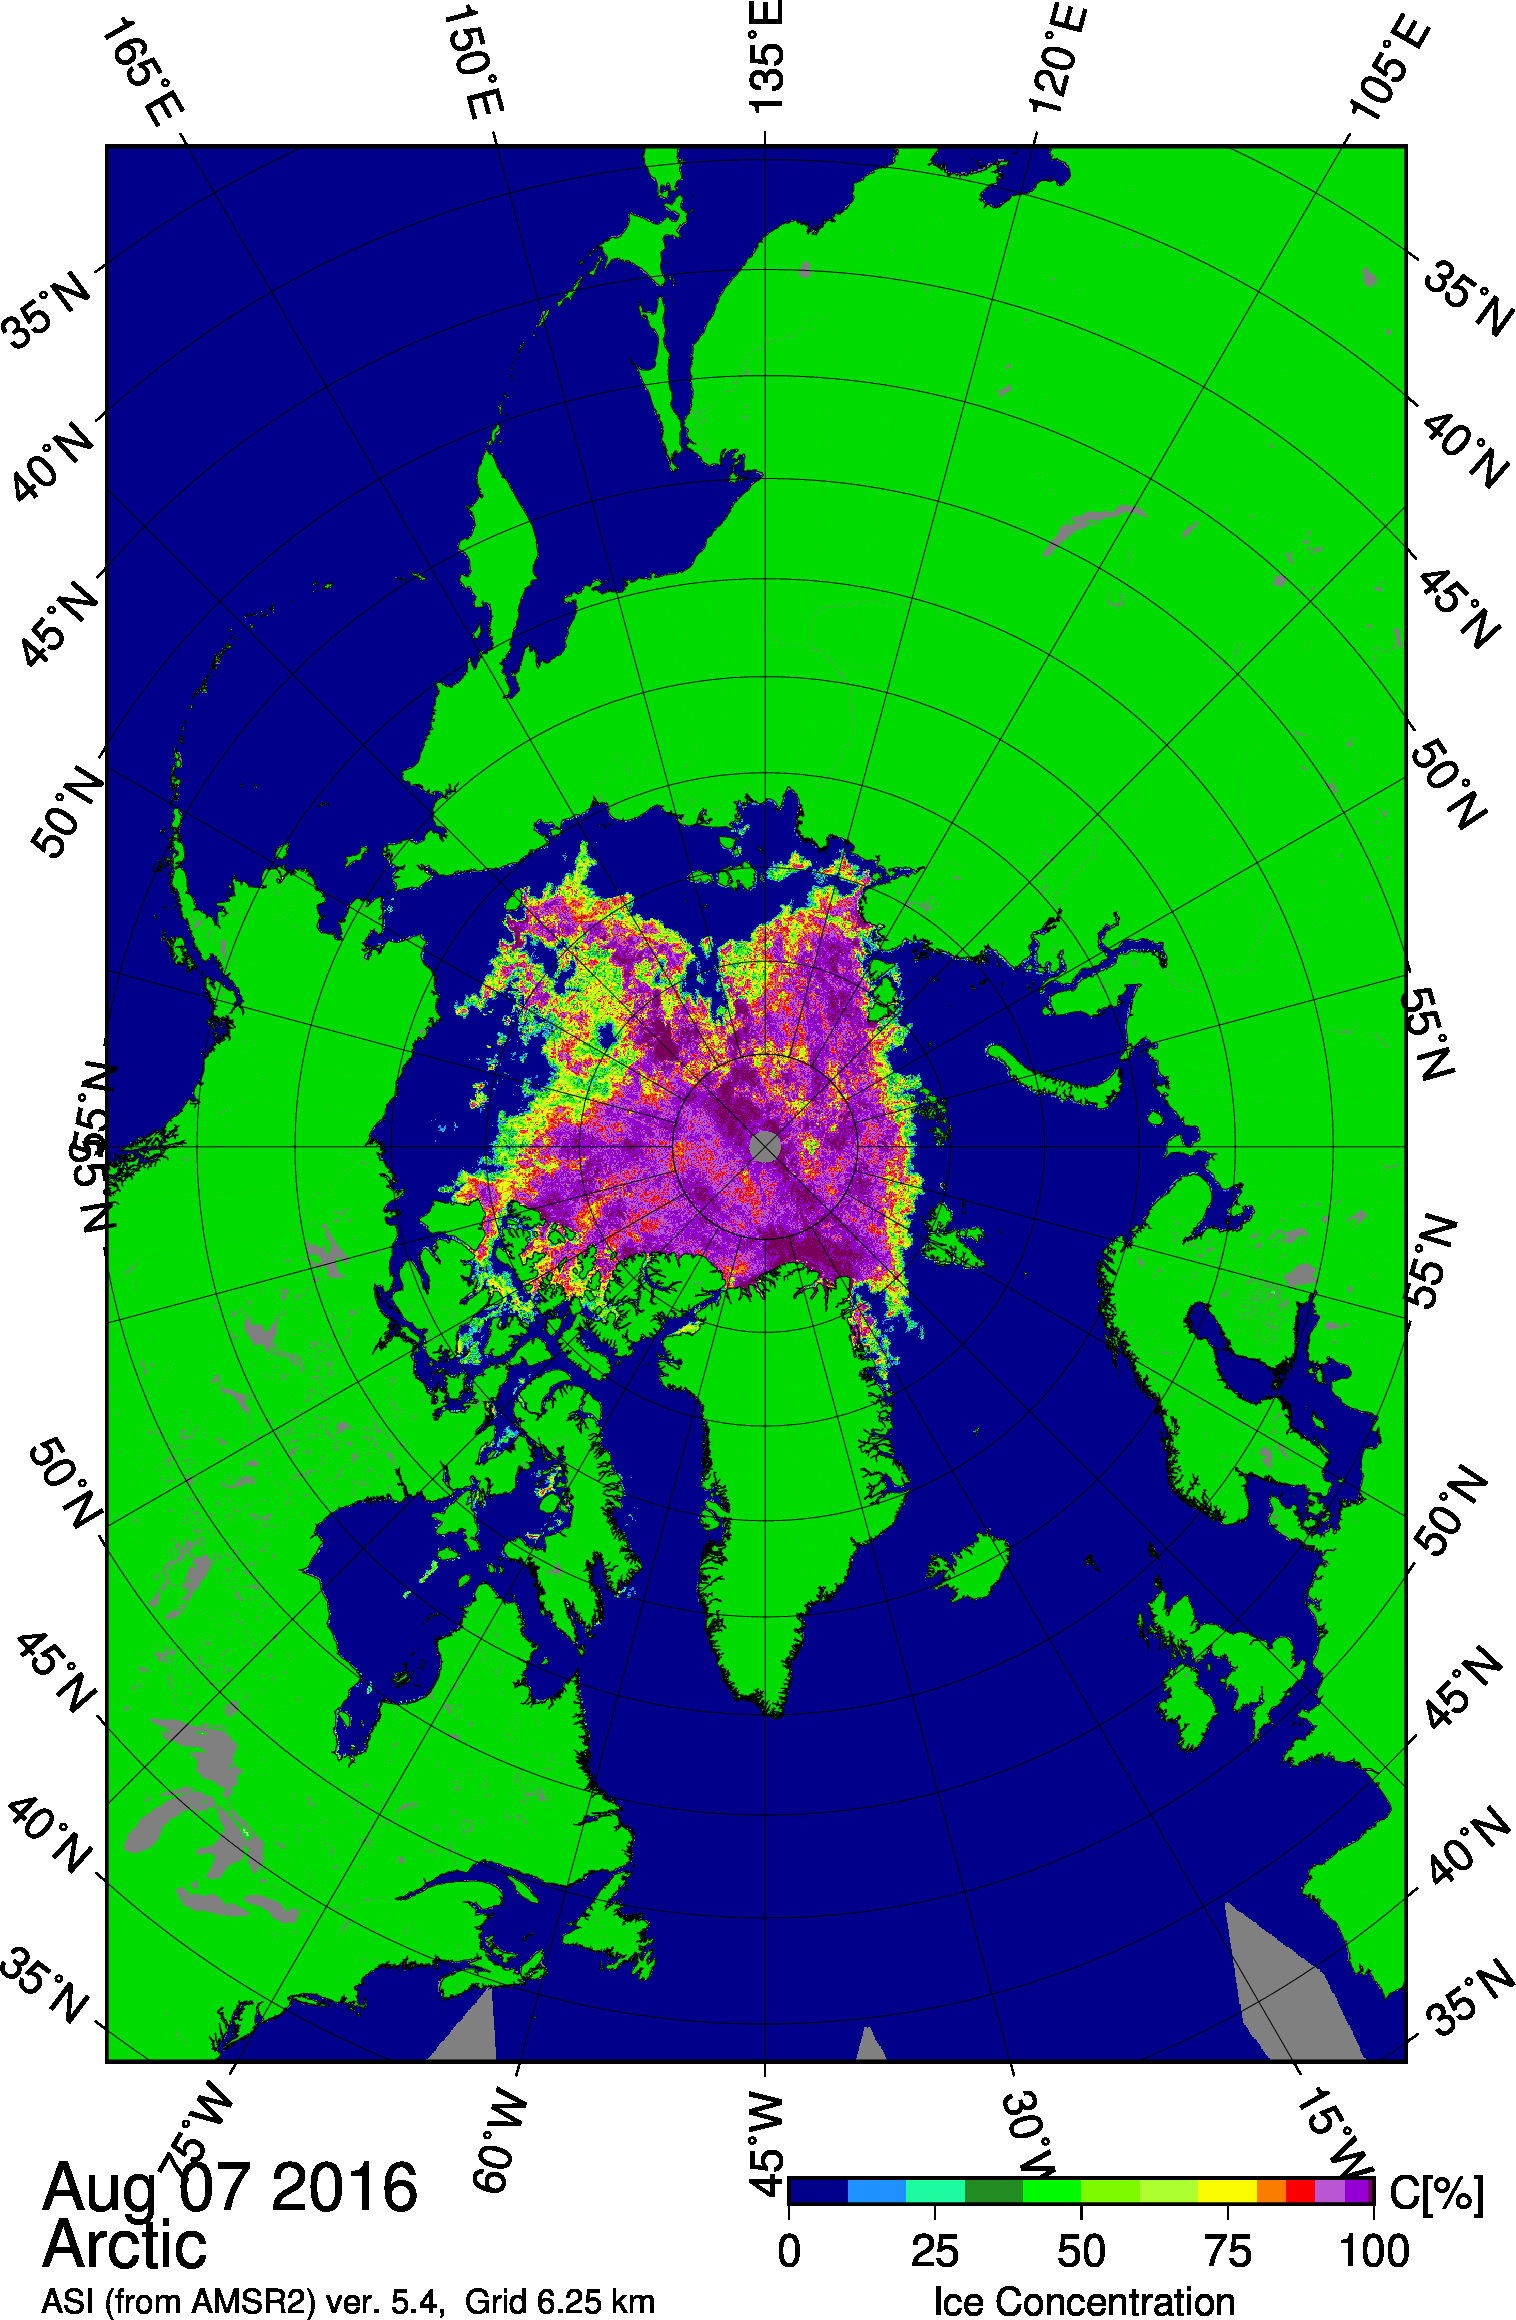
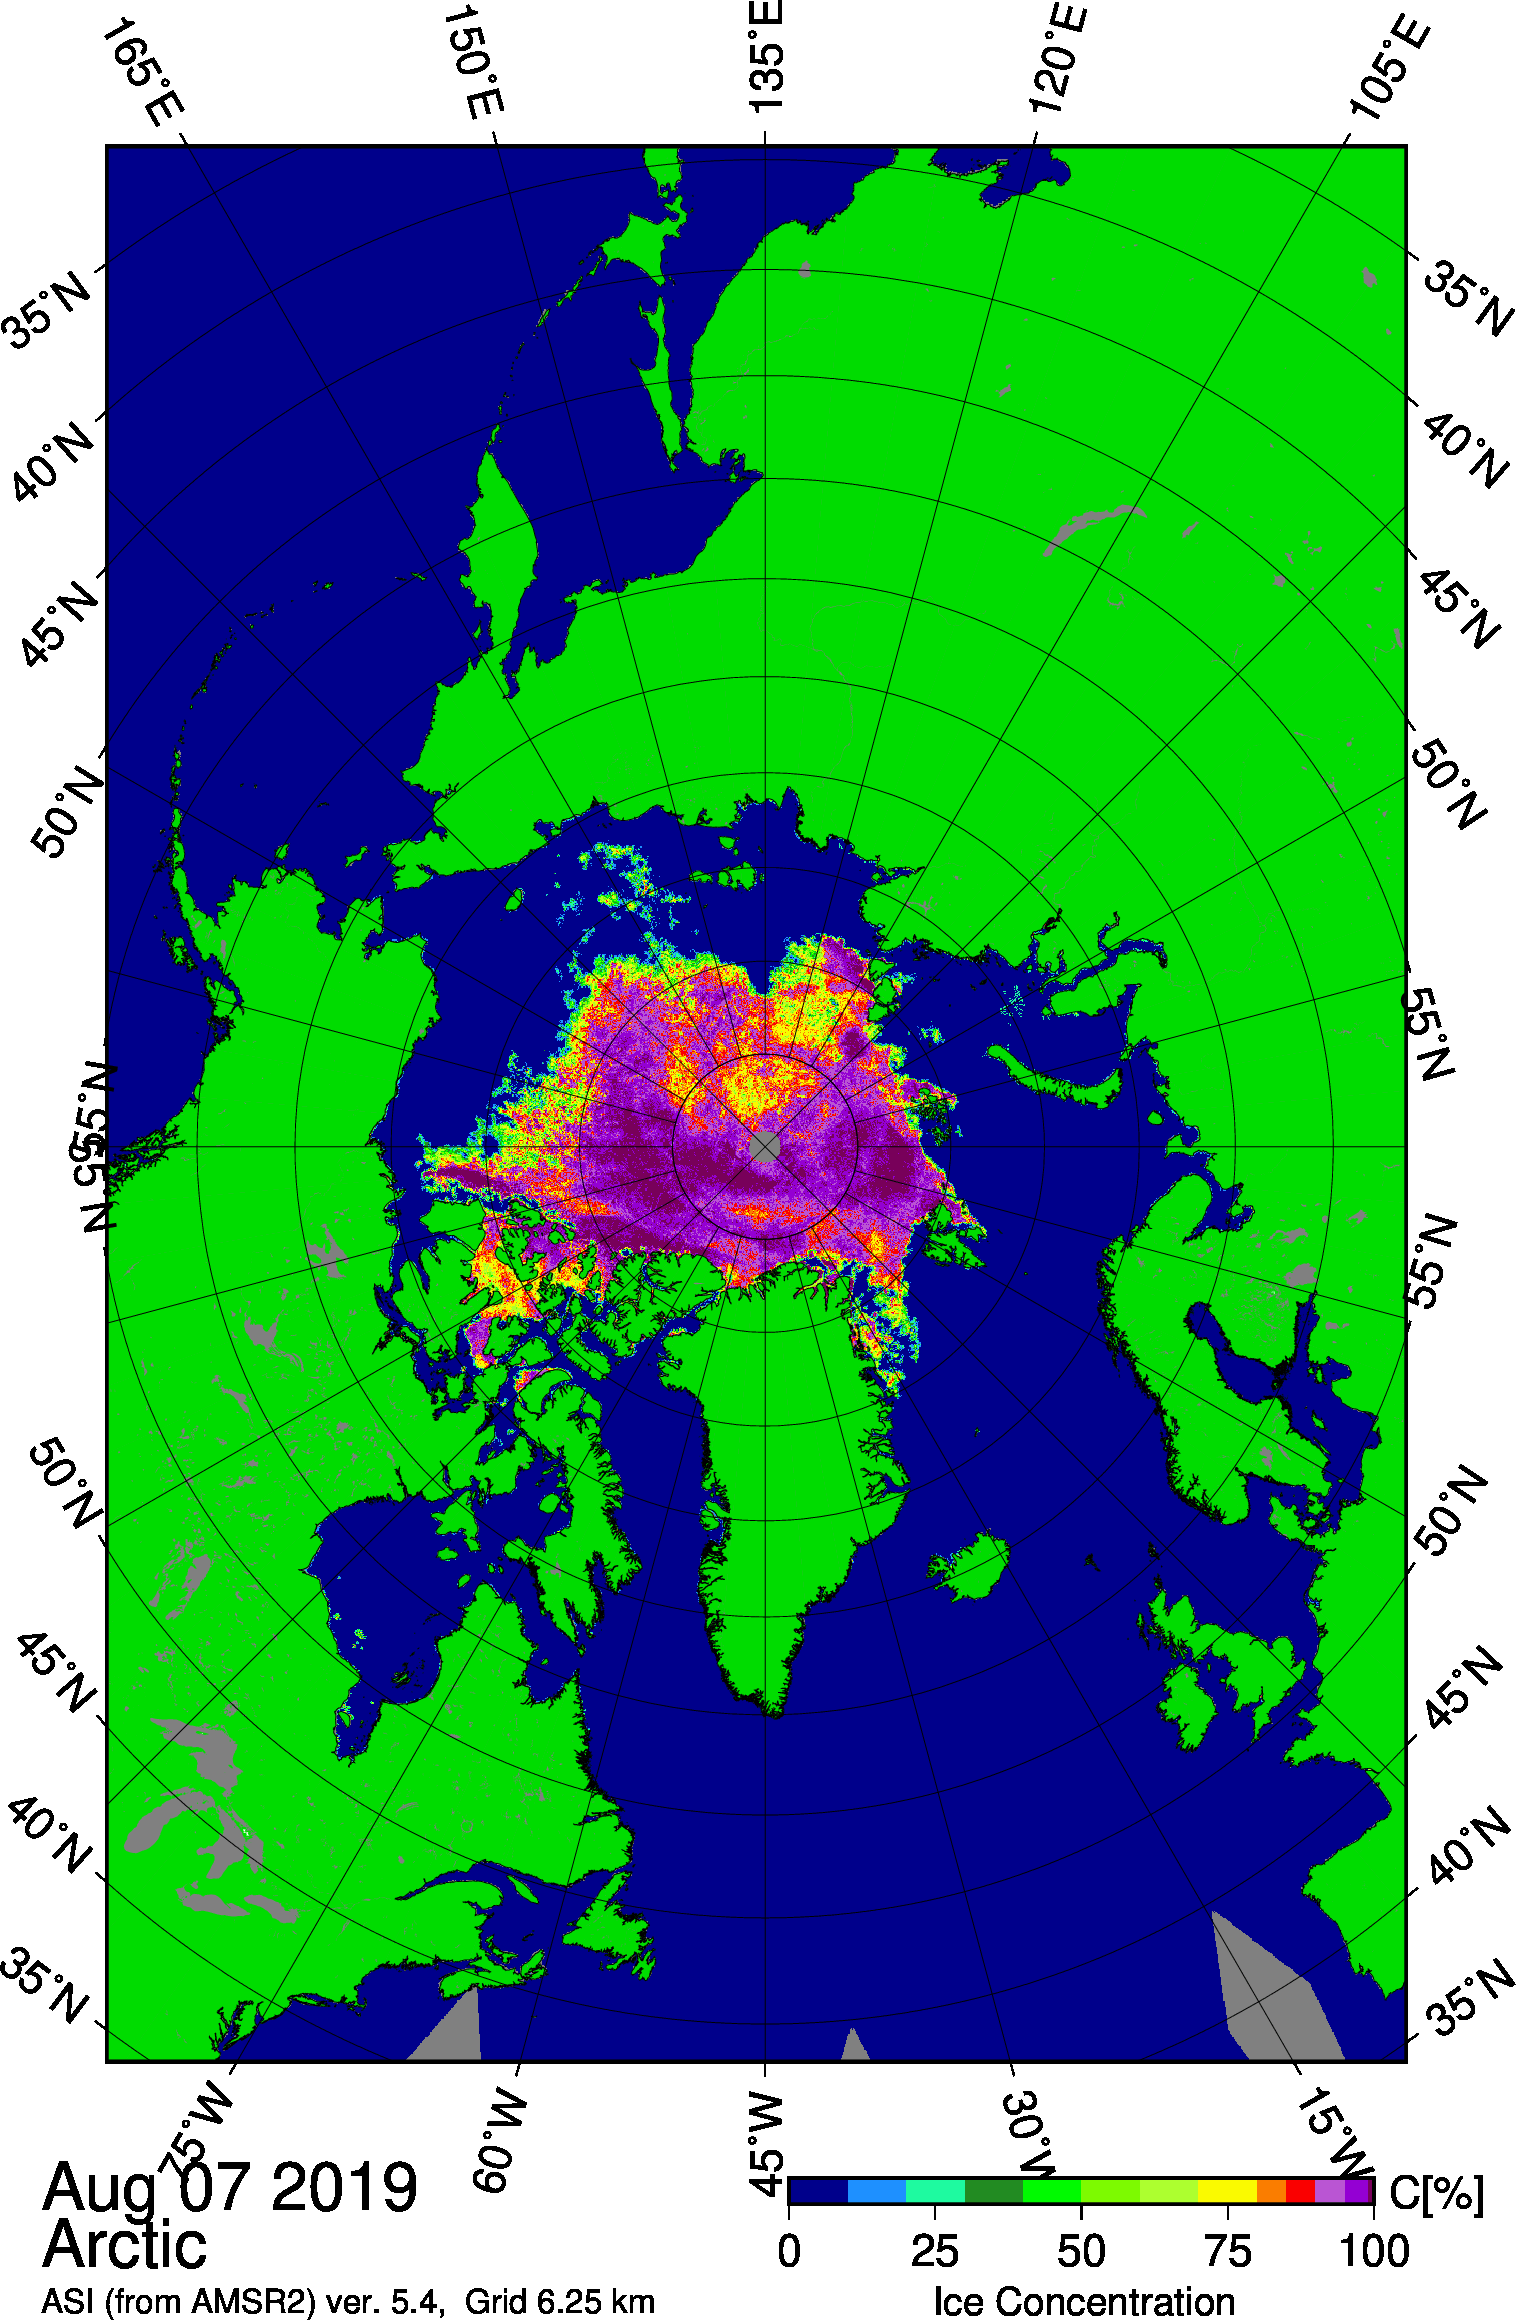
2016 looks like it had a lot more easy pickings after 8/10 for losses than this year. If parry stait melts out then that could add some to 2019 but 2016 looked easier:

-
Why do we think 2019 will act more like 2016 than 2012 after August 10th?
-
We've fallen 350k behind 2012 on area despite extent still being very close. We're probably going to need a big compaction pattern to keep extent in the running through the end of this month.
-
12z euro kind of extends the COC for most of next week. That would be pretty sweet.
-
2017 was decently snowy...though not excessive. But we haven't had a snowy Niño December since 2009. Were kind of due for one even though they are typically not favored. We've gone 3 horrendous Niño Decembers in a row since '09....maybe the excessive blocking we've seen recently will be able to manifest itself early this winter. That's typically a requirement for a snowy Niño December. In La Niña, we often can get away with less blocking in December. Not in El Niño. Of course, it could be warm neutral too. We'd be less reliant on blocking if it was but we'd still want to see it.
-
Seems like we're favorites for either warm-neutral or weak Niño. Obviously things can change but the subsurface doesn't look overly impressive and the model forecasts seem to agree.