ORH_wxman
-
Posts
90,902 -
Joined
-
Last visited
Content Type
Profiles
Blogs
Forums
American Weather
Media Demo
Store
Gallery
Everything posted by ORH_wxman
-
To get back on topic a bit...Monday actually might be the best day out of the COC intrusion. We get the retreating high up in Nova Scotia turning the flow more ENE....but still dry with the high really wedging down. So you're prob looking at temps near 70F with sunny skies over a lot of eastern MA/RI.
-
I mean, eventually it's not going to work for them....it's just funny how every year, there's always posts about how this is the year they don't turn on the jets late. That's the one advantage of not being a Patriots fan....I look at the fan base and team from a different perspective. Being a Cowboys fan....it also means I don't look at them through the prism of a division rival or even conference rival where hatred clouds judgement too. They are just sort of there existing in front of me every Sunday. But I always laugh at the panic.
-
We await the annual September Scooter meltdown in the Patriots thread every fall telling everyone how "this year is different"
-
Oh it almost certainly is....I don't think the instrumentation is off at a place like BTV. Occasionally a thermometer will go off its rocker, but it's really obvious when it does and usually gets corrected pretty quickly. Way more often, its a siting issue when stations start showing problematic temp obs. Sometimes the siting issue is temporary....piles of rocks at KCON, lol.....sometimes it might be more permanent like development around the airport. IAD Dulles is a good example of the latter....used to be out in the sticks and radiated like mad. Now they are in the middle of heavy development and don't come close to their former radiational glory days. Yeah I kind of lean with you on this. There's some evidence in the literature that the old passive stevenson screens with the liquid MMT produced warmer maxes and cooler mins than the newer digital thermometers at coops stations.
-
You're not kidding about MPV.....they have the same record length as ORH airport (ok, 1 year less...but basically the same) MPV has set 32 low minimums in winter (DJFM) vs ORH's 24 since the year 2000. Just for reference, BTV has set 15. They are more in line with CON and like CON, the BTV airport site started around 1940.
-
Seems like the rad spots really struggle more now in the winter. ORH has set 9 record low minimums in winter since 2000 versus CON with only 6. Using only the ASOS locations: CON: 14 record lows since 2000 ORH: 24 record lows since 2000 Period of record is similar...CON winters go back to 1939-1940 at the current location while ORH goes back to 1947-1948....so slightly longer record for CON but nowhere near long enough to explain the 10 extra records for ORH. I even double checked ORH records for the same dates as the January 1942 and Feb 1943 outbreaks and only 1 record low occurred at ORH after 2000 during those dates, so at most, I can only toss 1 record due to period of record differences. It is definitely harder to radiate at CON versus earlier....while ORH can still get record lows a bit more often because they do it on CAA type airmasses.
-
2019 ENSO
ORH_wxman replied to AfewUniversesBelowNormal's topic in Weather Forecasting and Discussion
Yep...there was plenty cold over the CONUS, just not for most of the posters in here....pretty classic gradient with SE ridge in the east actually.
-
Oh yeah...I wasn't implying that we're screwed because of it. Just a few short winters ago, we had our "Labrador visits Boston Harbor" storyline complete with sea ice that didn't melt until after the spring equinox and snow cover draping the buildings like "Day After Tomorrow" footage. And hell, even since that winter, we've had some pretty good stretches despite the +NAO. But I was mostly rolling my eyes at the "NAO flips positive as soon as summer is over" theme that has been present the past few years. At some point, it would be nice not to have to rely on the EPO/PNA region to bail us out as winter enthusiasts....even though it has bailed us out quite often recently.
-
We haven't had a full DJFM season average a -NAO since 2012-2013. 2017-2018 was the closest we came on the strength of a big -NAO March that season. But it still finished slightly positive. In fact, here's an amazing stat.....March 2018 is the only month out of any DJFM cold season that has averaged a -NAO since March 2013. January 2016 was just north of neutral as the closest runner up. January 2017 was also close (it actually averaged slightly negative on the Hurrell SLP method, but slightly positive on the Z500 CPC method). But that is pretty amazing. Out of the past 24 winter months, we could only get one of them to be decidedly negative on the NAO.
-
Friday-Monday is clothing-optional.
-
Our big blocking NAO from this warm season disappears faster than a hair follicle on Kevin's head as soon as October/November swing around.
-
Hopefully the Labor Day of Yore signal gets stronger on the ensembles....some hints there
-
Looks like an initial step up around 1995 which retreated briefly in the mid-2000s and then a monster step-increase after 2010...I think the next set of normals will help but it really won't be totally gone until the 2011-2040 normals come out. This matches from what I recall with MADIS too...MADIS really started hating BTV in the 2010s after not being bad in the 2000s.
-
That paper basically argues the opposite of tip's gradient "fast flow" theme. Kind of reinforces my statement earlier how there is a bit of "flavor of the month" syndrome in the literature. That paper was published right after the epic blocking of 2009-2011 where we had slow moving bombs.
-
I think the backloaded winters are more of a result to a shift of +PDO/Niño type PAC since 2011 rather than some permanent alteration of the polar jet. Before that, we couldn't buy a blockbuster Feb/Mar for like 7-8 seasons going back to the early 2000s. Instead, we had a lot of front-loaded big Decembers and Januarys in that 2003-2011 time period. I suspect this will shift back again once we have a more Niña/-PDO look again like we did in the late 2000s/early2010s. You may be right about the increased blockbuster storms though and the Gulf Stream anomaly since 1996 though. I'm not sure how accurate those maps are on a small scale like that, but certainly higher SSTs up against lower anomalies to the north would be a good breeding ground for cyclogenesis.
-
Well, it sounds like a subjective analysis then by you on other people's posting behavior. Not sure I can really help other than the below explanation: If you go back through the beginning of this thread and previous Arctic sea ice threads, you'll note that IMS hasn't been used. It's been consistently NSIDC and JAXA...sometimes U bremen and previously Cryosphere Today (now defunct..but they used NSIDC data). I don't know a ton about IMS but my little experience with it from sheer recollection back to the 2009-2013 days is that it seems to lag the other datasets significantly. It will "catch up" to them eventually if it looks like it is deviating on a trend line. That is my guess on what happens this year as well. We won't have to wait long to find out.
-
Here's some sources....the record we discuss isn't supposed to be about what it means longer term. Most of us know the longer term trend is down. But records are interesting to all of us in the weather community. Why do we sit around and track the thermometer at 101F on a hot summer day when the record is 102F? Does it really feel much different from 99F? Of course not, we're just tracking whether the record gets broken or not. FWIW, we've discussed when we think the first total melt out (definition below 1 million sq km of extent) will be in here: https://www.americanwx.com/bb/topic/40881-when-we-will-see-an-ice-free-arctic/ https://www.americanwx.com/bb/topic/46677-when-will-the-2012-arctic-ice-extent-minimum-record-be-broken/?page=3 It does not appear we will set a new record this year based on JAXA, ubremen, and NSIDC. We'll see about the IMS plot you reference but is suspect that will flatten out at some point. https://docs.google.com/viewer?a=v&pid=sites&srcid=ZGVmYXVsdGRvbWFpbnxhcmN0aXNjaGVwaW5ndWlufGd4OjU1OGIwZWI0NGI2ZDI5YTM https://seaice.uni-bremen.de/sea-ice-concentration/ https://ads.nipr.ac.jp/vishop.ver1/vishop-extent.html
-
Area and extent loss have slowed to a crawl the last couple days. We're now behind 2012 by about 300k on extent and 200k on area.
-
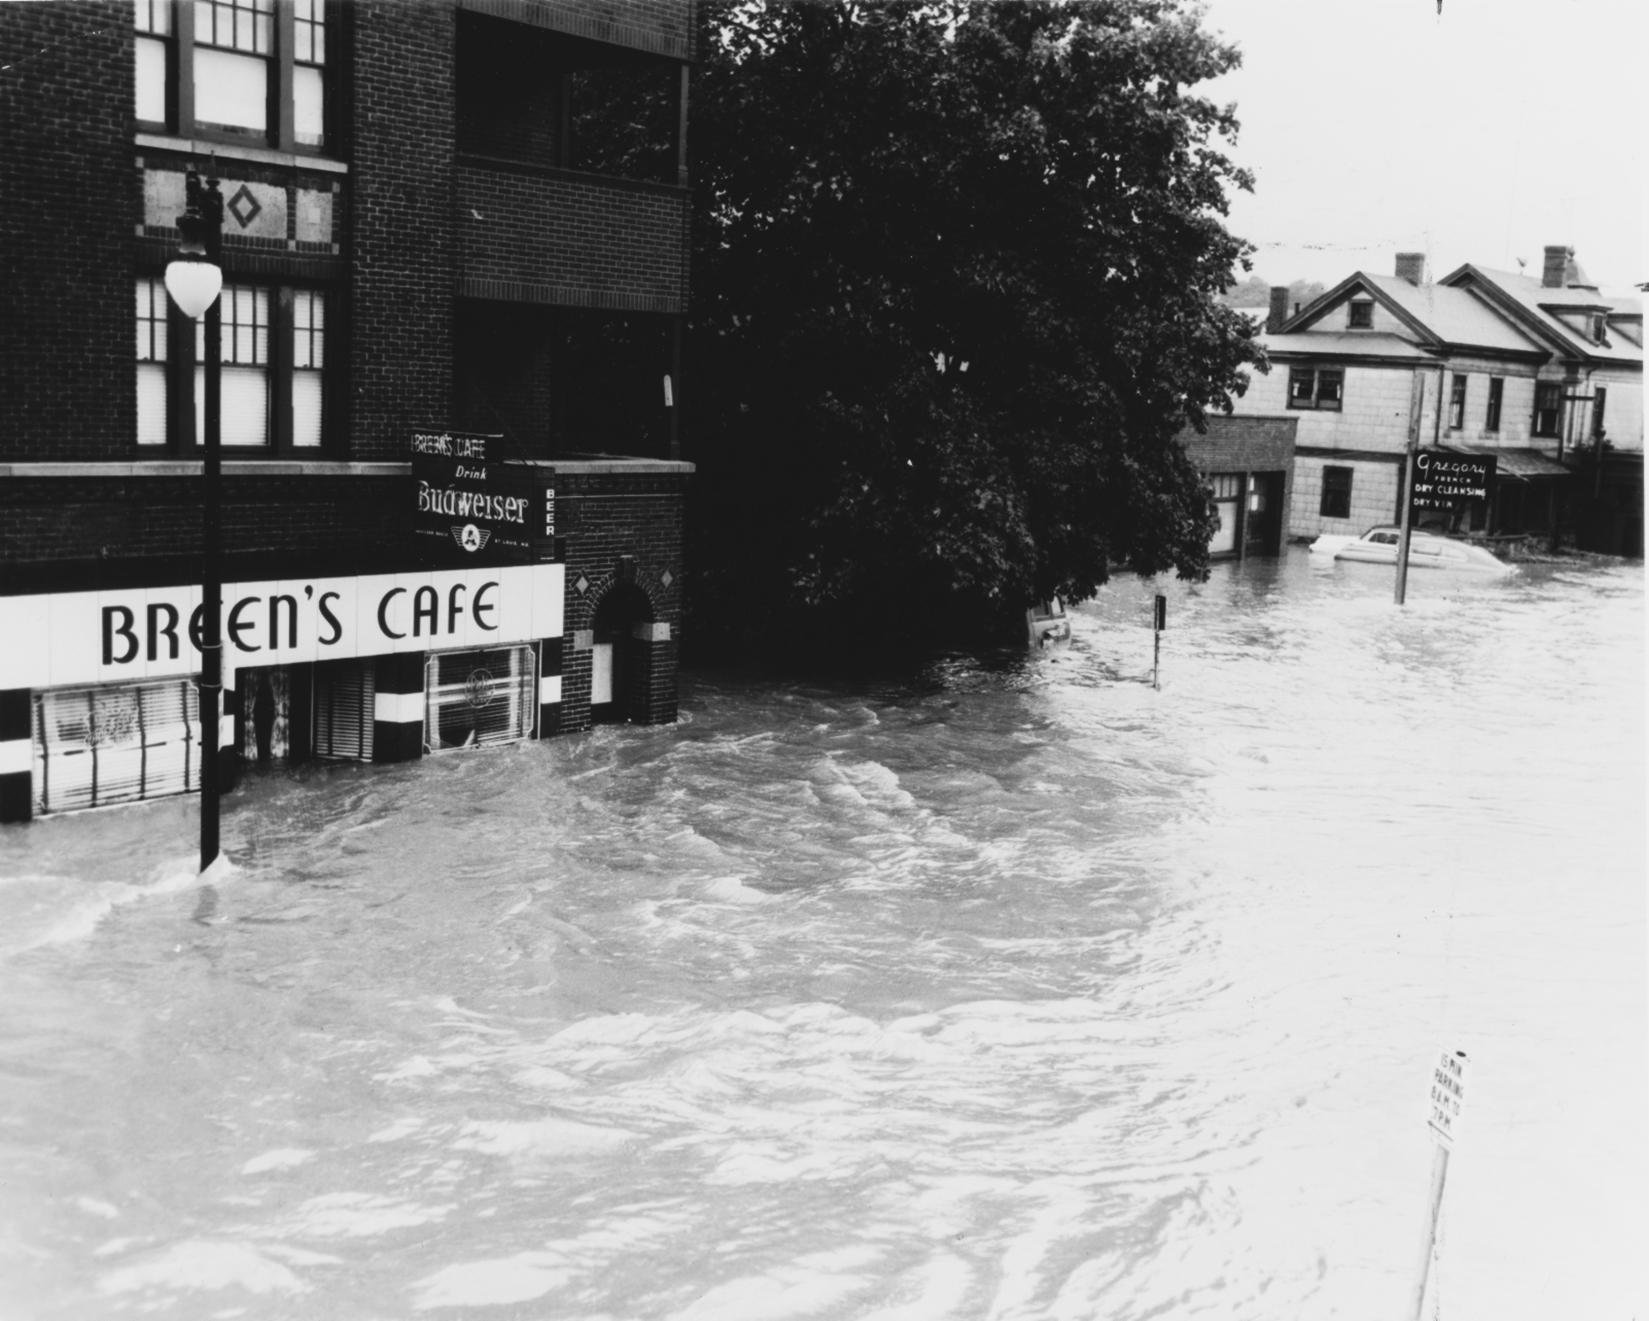
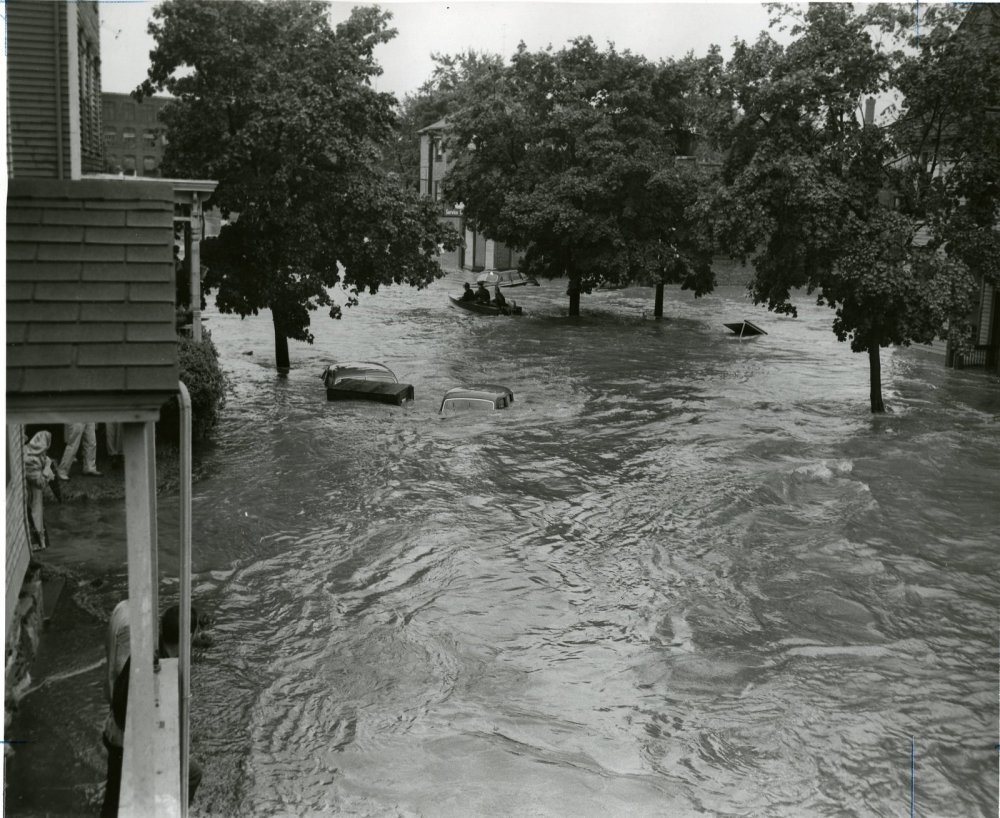
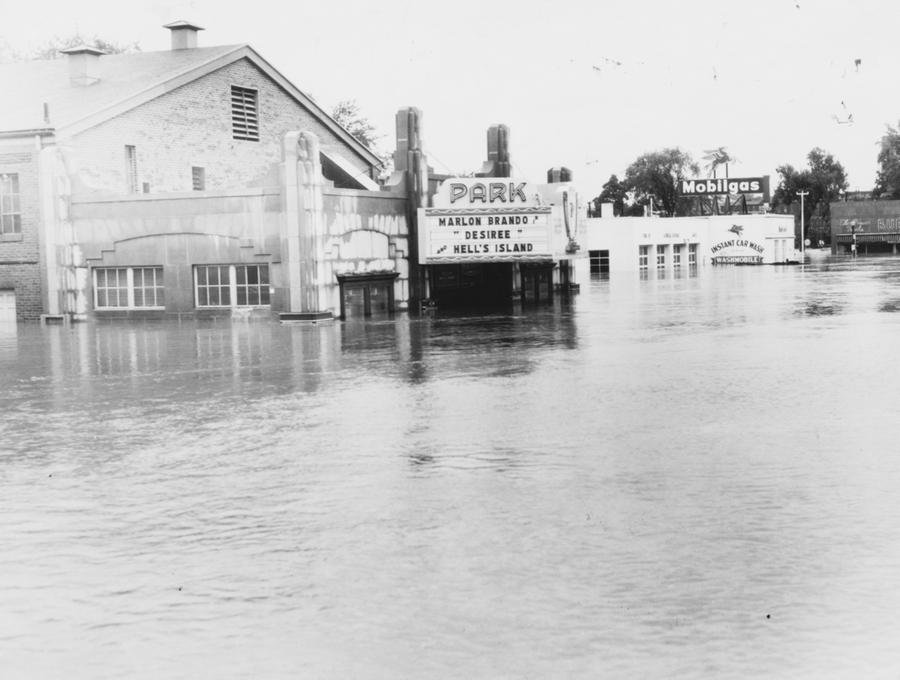
Most of those are in Webster square. The old park theatre was also Webster square. That was by far the worst area hit over to Main St near and just south of downtown....and then over to southbridge st. Basically the areas closest to the blackstone river. Though ive seen pics of shrewsbury st totally flooded (where funky murphys is for those who don't know Worcester well).
-
A few pics of ORH during the 1955 flood...again, prob never see this type of inundation again due to the changes made in flood controls after this one:

-
The 1955 floods changed the way Worcester handled their runoff. Those floods basically put downtown under 10-12 feet of water...but they put in flood control channels and other defenses on the blackstone so we'd probably never see another like it again.
-
Lol. Can he get any further away from CT and still be in SNE?
-
Keep it AN right through October...maybe one or two sharp cool shots just to remind us that winter is coming but I don't need daily frosts every day between 9/15 and Halloween. No use for that.
-
Yeah his best hope is probably PVD since they don't really radiate and downslope torch on a NW flow. Maybe BDR too. BDL will put up some good negative lows next week and ORH will put up some good negative maxes. BOS is tossed until they fix it.
-
BDL +0.8 BDR +0.9 PVD +0.9