ORH_wxman
-
Posts
90,902 -
Joined
-
Last visited
Content Type
Profiles
Blogs
Forums
American Weather
Media Demo
Store
Gallery
Everything posted by ORH_wxman
-
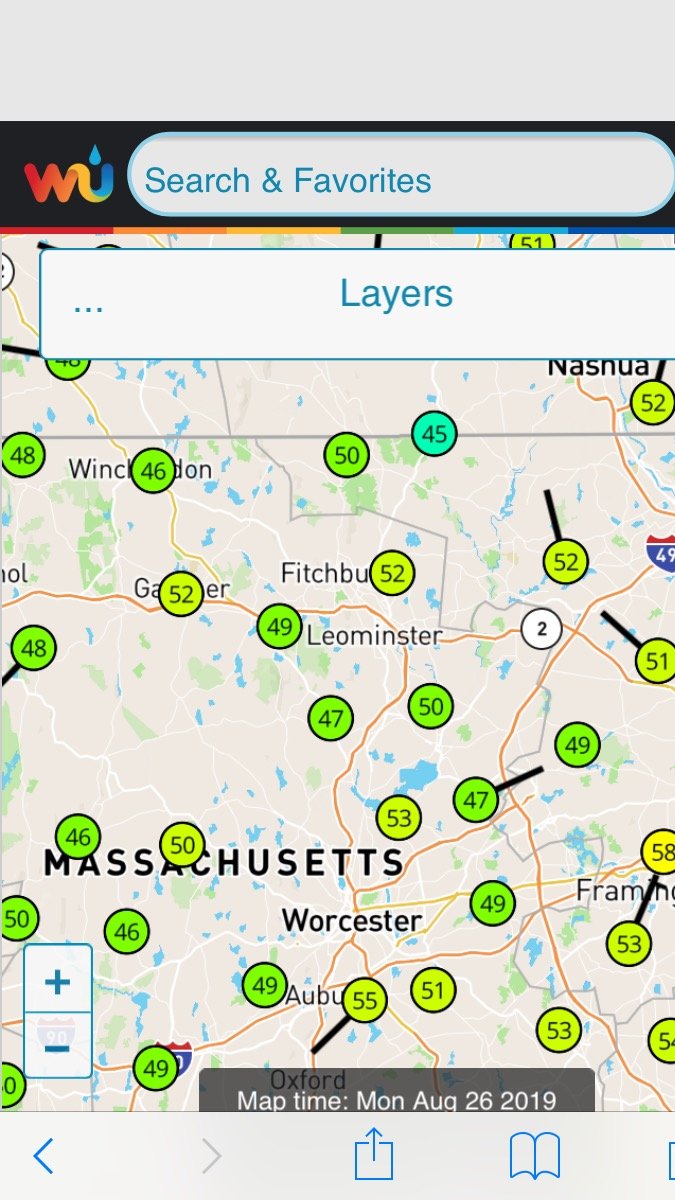
Yeah pretty impressive for this type of setup in summer...not the typical +5C shot across the bow like we might see in late August that produces temps in the 40s

-
Even ORH is down to 52. Gonna be a lot of 40s tonight I think over the interior.
-
Ha, reminds me of reading about the blizzard of '77 in BUF. Epic winds from the southwest that buried BUF....the actual snow that fell in the storm was only like 12 inches but it blew a ton of snow from a mostly-frozen Lake Erie into the city and created like 30 foot drifts. Lol. It looked like something out of the day after tomorrow and it was because of the fetch of wind off a mostly frozen lake.
-
Ossipee lake off to the northeast. That's your spot if you want to be on water. Or you could just say screw it and go full weenie and get a place on Rangeley Lake or Mooselookmeguntic. But your swimming season would probably be cut by a month or two up there. Cant beat the winters though.
-
Attribution studies can help tell us what is more likely with AGW. Hurricanes aren't one of them. Flooding rains would be more likely but actual floods that occur from them are less damaging than they used to be due to flood control measures we have that are far superior to the early and middle 20th century. You may have seen my reference to the ORH 1955 floods and I made a comment how we'd never see that again due to the flood controls put in after that storm. Still, heavy flooding rains are more likely to occur so places that don't have better flood controls are going to see worse floods than they used to. So are heat waves...those are significantly more likely than prior to AGW. Heat waves are the highest confidence occurrence in the attribution studies for obvious reasons...higher temps = more heat waves for most. In New England and most of North America, drought has become less likely compared to the early and middle 20th century...but will it stay that way? The literature is mixed...it says southern parts of North America should see increased droughts in the future while further north will not. We cannot ever attribute a single event to AGW because as Tip said, climate doesn't control the weather. It just gives us guidelines for the probability of such events. The single most dangerous aspect of AGW is sea level rise. The other stuff is small potatoes compared to that. Sea level rise can make storms worse even if the storms themselves aren't more frequent or stronger...like hurricanes in my previous above example. The hurricanes aren't more frequent or stronger, but they produce a worse storm surge flood due to SLR (sea level rise). So what maybe a category 2 used to do for storm surge flooding, now it only takes a category 1 because sea level is higher. I do joke with people sometimes on how the media is pretty awful at parsing the differences though....like I will joke by saying "can you imagine the media storm if we had another period like 1938-1955 again?"....for those who don't know, that was the most prolific period for landfalling hurricanes on the east coast in our records. Of course, back then, you couldn't blame it on AGW, but I'm not convinced that wouldn't be the runaway story this time even though the literature doesn't support that narrative. But scary sells ratings...it doesn't need to be accurate. I tend to be less cynical than many on AGW only because most of the projections that are really scary assume what we call the "RCP 8.5" scenario which is continuing the emissions climb to extremely high values...and these values are pretty unrealistic IMHO. For example, it assumes the coal industry will be 7 times bigger by 2100 and assumes no major headway on green energy...something that is already happening. Solar is already becoming cheaper than coal. It is not likely that we will reverse this trend and decide to go back to more coal and less solar. Market forces will keep turning us toward solar and other green energy as it becomes cheaper. None of this means we shouldn't do anything to push it along quicker or that we should be totally complacent. It just means I find the worst case scenarios unrealistic from a scientific standpoint. All of this really doesn't belong in this thread anyway. We do have a climate change forum afterall. But I figured I would throw in my two cents given the discussion went on as long as it did in here.
-
Yeah you need a specific set of criteria for that type of progression to work out. If we exclude anafrontal storms like March 2005....it's usually massive bombs....like December 1992 and April 1997 (both changed over to snow in the CCB after 6-8 hours or more of heavy rain in eastern MA)....or super dynamic like December 9, 2005 flashing to heavy snow on the coast of MA after they had changed to heavy rain for several hours.
-
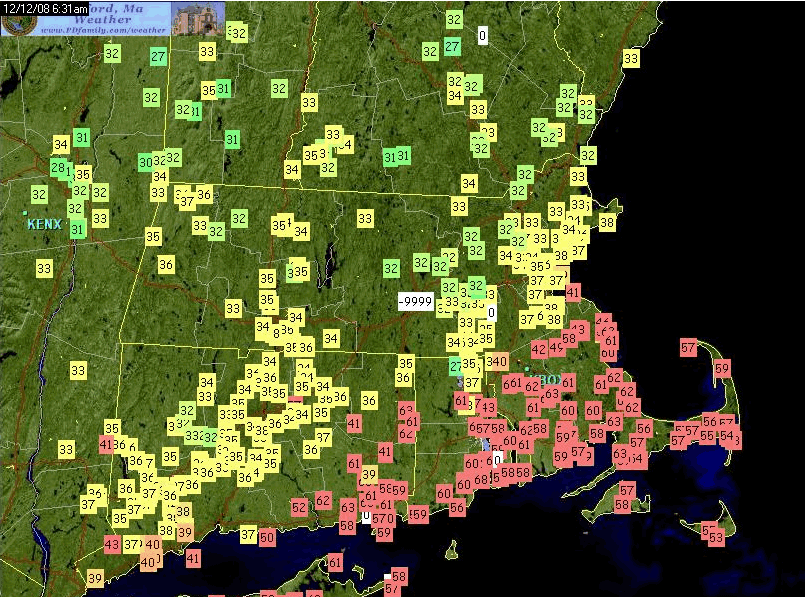
Your reference to the temp gradient in the '98 ice storm reminded me of the temp gradient on the morning of the 2008 ice storm down here. Never seen something so sharp in a storm here. Focus on eastern CT up into S MA....or even just east-central CT to far NE CT....talking about 25-30F over less than 10 miles. (much of the stations below 32F in central MA and SW NH were not online for obvious reasons)
-
FWIW, NJ did not get pounded in that storm. Too warm down there...they may have had some snow in the high terrain of NW NJ. Most of the dynamics were north of them....it wasn't as wrapped up as the Feb 2010 retrostorm.
-
I think it was a combo of going a bit too negative and also cutting off from the polar jet too much....just enough to turn it from wet snow into 34F rain. Apparently the models just didn't quite allow enough warm air to get pushed back into the interior. I think some of it too was there was a sense of hedging toward snowier as earlier that winter we had the epic positive bust of December 23, 1997 that dumped 18" (over 20" in Tip-land just tot he northeast) on a 1-3" forecast of marginal paste. That had caused mass outrage at weather forecasters and people stuck everywhere....it's a lot worse for traffic when everyone expects nothing and gets buried versus people expecting more and then being "pleasantly surprised" that not much fell and they can drive easier. Here's the renanalaysis of it: http://mp1.met.psu.edu/~fxg1/NARR/1998/us0224.php The reanalysis is't perfect because it shows ORH above zero at 850 the whole time, but it definitely was pounding heavy wet snow for hours in the early going. Probably the tough part about that one was they were upping the snow totals rapidly as it got closer. They were actually warmer with the forecast initially like 2 days earlier, but then they kept saying "things are coming in colder over the interior....we may have to up the amount in the Worcester hills"...and then by the night before, they were pretty gung ho and even moreso that mornign while the snow was pounding....they had no idea in real time that we were just an hour or two away from getting overwhelmed by the warmth aloft from the E and SE.
-
You talking the 3/2/18 storm? Was looking like maybe 5-10" eventually over interior but it took forever to change over. Only got an inch or two at the very end. Though Scooter loved the storm on the coast for the epic wind. The Feb 1998 storm was a bit different in that we weren't waiting to change over at the beginning. It was pounding and you don't expect to change to rain over ORH when you get a storm over the benchmark (both sfc and midlevels)
-
Yeah mostly ends up that way but not always. Classic example...2/24/98 over interior MA and even all the way back to ALB....winter storm warning for 12-18" of paste. Not much, if any by the time you got to 128 and forecast was always rain for BOS and nearby/southeast MA. But different story for ORH and up through monadnocks and into E NY state. It started off as planned...pounding heavy wet snow while about 10 miles inside 495 was raining. The snow line actually collapsed southeast a little bit as the dynamics increased and I remember Todd Gross coming on and saying Lexington and Bedford had flipped to heavy wet snow and mentioned they may have to up amounts in the 128 zone. Meanwhile back in ORH, we were ripping...had 4-4.5" by about 830am after it started at 5am or so. No end in sight either. Heavy echoes just streaming north. Then all of the sudden when really heavy echoes started moving in, the dreaded pingers were heard shortly after 830. Worst sound ever. They lasted maybe 30 minutes or so at 29-30F and the temp slowly rose to 32-33 and then we were all rain shortly after. I remember then around 11am the Mets were scrambling but said they expected the snow to collapse back southeast that afternoon and we'd still pick up an additional 4-8"...I thought "ok that is still salvageable even though this few hours of rain sucks". But then I noticed ALB went over to heavy rain not long after. I then knew deep down we were toast. I still hoped everything would collapse back southeast but it never did. Instead, we got nearly 3 inches of heavy rain at 34-35F on a benchmark storm track in February...the storm ended with a few pathetic wet flakes finally mixing back in. Even ALB and eastern NY had a bad bust...had to get west into the Catskills and out to BGM for big snows that never changed over. Worst negative bust of the 1990s by far for me.
-
The 1940s, 1950s, and 1980s seems to stand out as rather putrid years in Maine based on your data, tamarack. That actually matches ORH pretty well. I didn't have 1940s in my dataset, but if I did, they wouldn't be very good based on what I know from that decade at the older coop site. They weren't as bad as the '50s or '80s but still pretty cruddy. Your 1990s stand out for moderate events.
-
I really wish I could find it, but years and years ago, I saw a writeup on the Feb 1989 storm. It was of course in black and white PDF scanned onto some website and then printed back out. But it showed the old NGM paneled model forecast about 24 hours before the Feb 1989 storm and you could see why they were going nuts. We all remember how dry the NGM tended to be, and it was spitting out over an inch of QPF from NYC to BOS and all points in between back to ORH and HFD included. It had "the look" so to speak....not just QPF, it was thing of beauty in the midlevels with like 4 or 5 closed height contours at 850 and several at 700 even if a bit oblong. Looking at the reanalysis, you can probably see what was "supposed to happen"....that powerful southern vort energy was going to really swing around the base of the trough and "wrap back northward" and tuck that storm in closer to the coast....but the whole thing kind of gets pinched off a bit too quickly.....ugh, just looking at those panels is painful bringing back the memories that are still so vivid 30 years later: http://mp1.met.psu.edu/~fxg1/NARR/1989/us0224.php http://mp1.met.psu.edu/~fxg1/NARR/1989/us0225.php
-
Nothing was worse personally for me than the February 24-25, 1989 bust...it was similar to the one you described except it did get snow back to ORH hills...just it ended up being 3-4" of sand after 1-2 feet was predicted not 24 hours earlier. We were rewarded by WBZ channel 4 with Shelby Scott reporting live from Chatham, MA under 2 feet of snow and blizzard conditions long after the arctic sand stopped falling in ORH and the sun was already poking out. The bust you described may have been either late Jan 1987 or mid Feb 1987....that was actually a good season over the interior, but one of those storms absolutely demolished the Cape while giving nary a flake to Boston-westward except a brief burst that produced an inch or so from the WAA ahead of the developing shortwave...but the main CCB never made it back northwest of SE MA and the sun was out for much of it over the interior. http://mp1.met.psu.edu/~fxg1/NARR/1987/us0209.php http://mp1.met.psu.edu/~fxg1/NARR/1987/us0210.php Back in those days, there was always dread lurking behind the excitement of an impending storm. I was always excited, but after the first bust or two, I became wiser but at the expense of fun....we were waiting for the other shoe to drop constantly. Even in a 3-6" event. We'd see those types of events turn into an inch of slop washed away (waking up to the dreaded sound of cars splashing outside instead of that "muffled" sound of snow)....... or clear skies with stratus deck visible on the eastern horizon with semi-regularity. December 1992 was the turning point as you noted. That storm seemed to take a decade worth of frustration and turn it on its head. It was as if it almost mocked those who hated snow and started to enjoy our "new climate" of busts and underperforming snows in the 1980s and early 1990s...."here, take this 2-4" forecast and laugh about it turning into 34 inches blue cement-turning-into-powder combo." The 1990s still had their share of ratters and some busts....but you knew the tide had turned...the worst was behind us it seemed....and that feeling turned out to be prophetic as we went into the 2000s.
-
I dunno, Euro today looks like LabYore Day is coming. We'll see what the ensembles look like in a bit.
-
I should add in 1.0-2.9" events just to see if there's been anything going on there. But that would require a chunk of time for me to compile that data since there's more of those events, and I never started the process. I had already started doing 3, 6, and 12 thresholds over a decade ago. Anecdotal, but I swear 2.7, 2.8, and 2.9 were so damned common in the 2000s and 2010s looking at the ORH data. I can't believe how many times I left off an event because it failed to reach 3.0" by a few tenths or less.
-
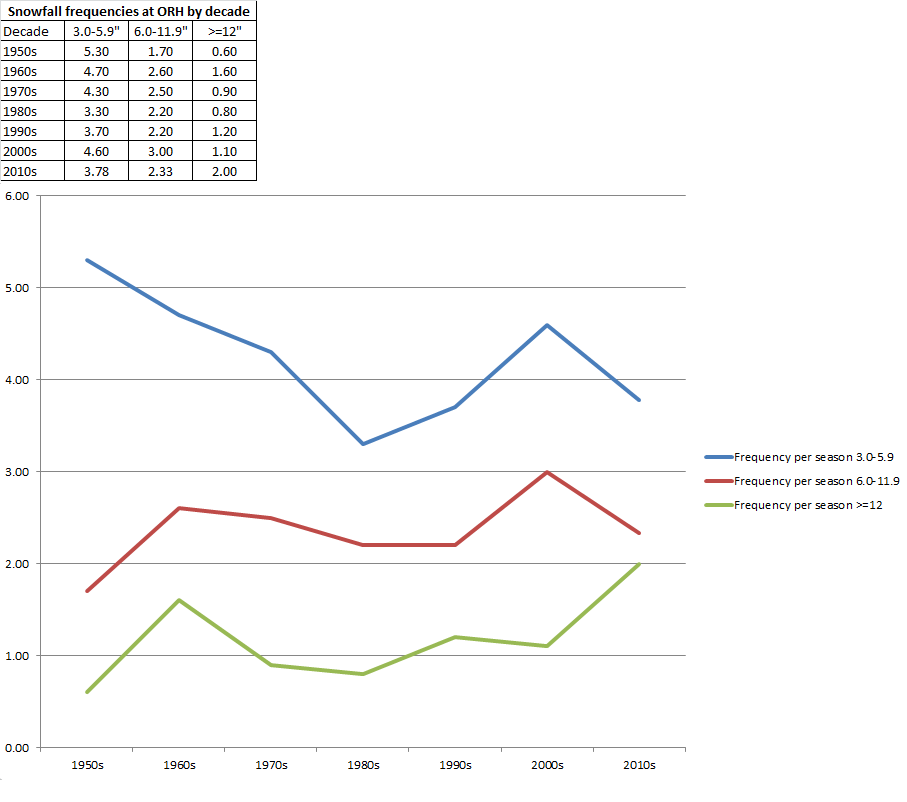
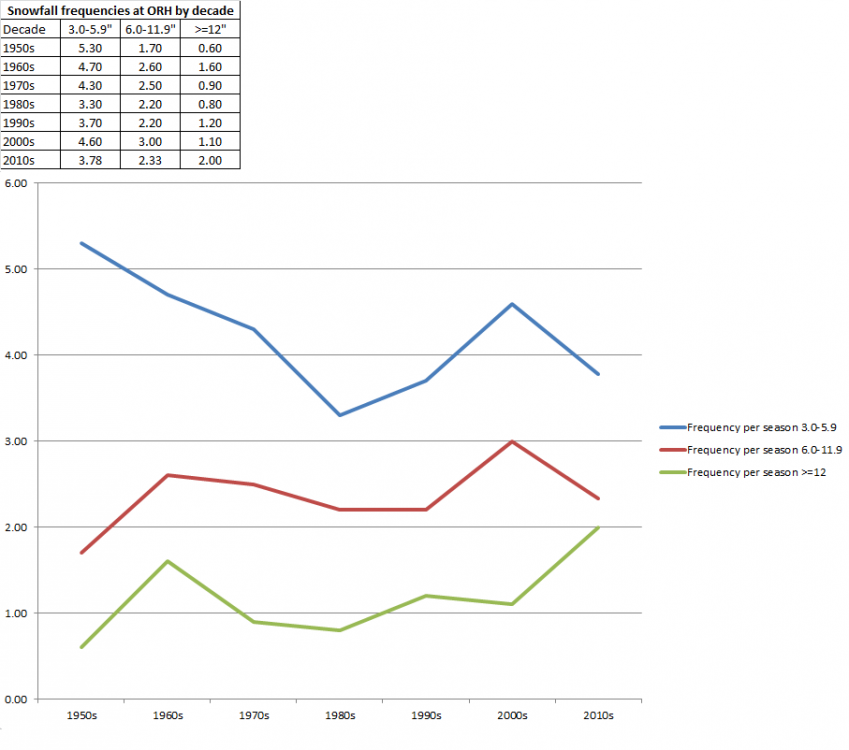
Yeah the 1950s and 1980s were pretty big outliers that can skew the look. The 1950s were dreadful for snowfalls 6"+ in both categories over 6". Even worse than the 1980s....they seemed to try and make up for with lots of 3.0-5.9" events, but the 1956-1957 season kind of skews that decade too if we want to dig deeper. That winter had 11 events of 3.0-5.9" and ZERO 6.0"+ of any kind. No other year in the entire record even had 10, nevermind 11....2002-2003 was closest with 9, though unlike 1956-1957, the incredibly prolific 2002-2003 also had 2 events of 6-11.9" and 3 over 12".
-
Well I just made it....lol....I had the raw file for years, but I had to update it for the most recent decade.....here;s the raw data by each single year: Snowfall frequencies at KORH by year Year 3.0-5.9" 6.0-11.9" >= 12" 1950-1951 5 0 0 1951-1952 8 2 0 1952-1953 5 2 0 1953-1954 3 1 0 1954-1955 3 1 0 1955-1956 6 6 0 1956-1957 11 0 0 1957-1958 3 2 4 1958-1959 5 2 1 1959-1960 4 1 1 1960-1961 7 2 3 1961-1962 3 2 2 1962-1963 5 4 1 1963-1964 5 3 1 1964-1965 7 2 0 1965-1966 2 2 3 1966-1967 4 4 2 1967-1968 4 4 1 1968-1969 3 2 2 1969-1970 7 1 1 1970-1971 4 6 0 1971-1972 5 3 2 1972-1973 3 1 1 1973-1974 2 2 0 1974-1975 7 1 1 1975-1976 2 2 1 1976-1977 6 4 2 1977-1978 4 4 2 1978-1979 7 1 0 1979-1980 3 1 0 1980-1981 2 2 0 1981-1982 4 3 1 1982-1983 1 0 3 1983-1984 3 5 1 1984-1985 6 0 0 1985-1986 4 1 0 1986-1987 2 5 2 1987-1988 4 3 1 1988-1989 4 0 0 1989-1990 3 3 0 1990-1991 3 2 0 1991-1992 3 1 0 1992-1993 6 3 2 1993-1994 7 3 2 1994-1995 0 0 1 1995-1996 6 5 4 1996-1997 3 1 2 1997-1998 5 1 1 1998-1999 2 4 0 1999-2000 2 2 0 2000-2001 4 3 2 2001-2002 2 3 0 2002-2003 9 2 3 2003-2004 5 1 1 2004-2005 8 6 1 2005-2006 3 2 2 2006-2007 3 1 1 2007-2008 4 5 0 2008-2009 4 4 1 2009-2010 4 3 0 2010-2011 4 1 4 2011-2012 3 1 1 2012-2013 2 5 2 2013-2014 4 4 2 2014-2015 4 3 3 2015-2016 4 0 1 2016-2017 5 2 2 2017-2018 3 2 3 2018-2019 5 3 0
-
I decided to look into the frequency of snowfalls by magnitude at ORH based on the discussion by Tip and Ray....here's what I found: Now obviously a couple things stick out....small event between 3.0-5.9 have generally declined while larger events over 12" have increased. The middle run-of-the-mill warning criteria events have not really changed....slight increase. But something to keep in mind, the data is somewhat noisy. See the decade of the 2000s with the big increase again in small events and moderate events....but not really 12"+ events.
-
Let's get a 49 at ORH with mist.
-
There's no way that verifies at his place. Might have to pull out the BDL tarmac for this one and hope they don't stay too cloudy.
-
We wedge. We invert. We stratus from the northeast. Maybe we can pull a Labor Day of Yore though. Still showing up on ensembles.
-
Melt ponding is supposed to occur more readily on first year ice than multiyear according to the literature but let's say that is flawed analysis....if melt ponding was truly getting harder because first year ice is somehow getting so bad and other factors now contribute more to melting because of this, then we would expect the NSIDC area in late June to significantly over-predict the amount of ice left at the end of the season. We haven't really seen that in recent years....except 2016. But it didn't happen in 2017 or 2018. It doesn't look to happen in 2019 either unless something pretty crazy happens in the next couple weeks. The late June area data (which is a proxy for melt ponds) told us that we had a good chance for 2nd lowest but not a good chance for lower than 2012's record. There's nothing glaring that says that data missed some sort of smoking gun on additional melting.
-
Those first two had big -NAO help. 2015 did not though but we got an amazing nearly-standing PNA wave in a perfect spot. When it doesn't line up like that we often have to be at the whim of the unmanned firehose....ala 2013-2014, 2016-2017, and last year...last year we got somewhat unlucky but that's the way it goes. We got lucky in some of those previous years. Obviously we all root for a -EPO since a +EPO is garbage but I will also root for some Atlantic help.
-
The role of the cyclone in 2012 is overstated imho. The ice was in terrible shape before it hit. I'm not really convinced it added that much to the losses. Maybe a couple hundred thousand sqkm or something. 2012 already had the highest percentage of melt ponds by the end of June suggesting a new record was likely. It was significantly lower on SSMI/S area than other years including 2019...it's the main reason I didn't think we'd set a new record this year despite this being the most favorable melt year in a while. It just didn't quite stack up to 2012's early melt ponding.