

ORH_wxman
-
Posts
90,902 -
Joined
-
Last visited
Content Type
Profiles
Blogs
Forums
American Weather
Media Demo
Store
Gallery
Everything posted by ORH_wxman
-
Logan airport went over 10 years without a 12" snowstorm. They had over a foot in the Feb '83 storm and then failed to get it again until the March '93 superstorm. They had some close calls in between but never hit 12". Then ORH went 4 consecutive years without a 10" storm from '88-89 through '91-'92. Only time that ever happened on record.
-
If I didn't know how close we were to getting so much more, then that winter wouldn't have been too bad. It was close to average snow here. Yeah, rewind to 1988 when you didn't know how much Baltimore was getting each storm and couldn't see computer models and the winter probably gets an average rating for most of SNE...sans maybe NE MA and the central CT valley.
-
We tried to warn him.
-
BDL also has to swallow another -7 or -8 today. So they'll be down to like +0.8 or +0.9 by the end of today. Tomorrow is prob close to a 0 departure...then maybe they try to make up a bit...they'll prob hit 85 or 86 Friday with prefrontal SW flow. I'll say they finish between +1 and +1.2.
-
CAR is also the hotspot in the northeast right now at 79F....usually only see that during obscene cutters in winter when everyone else has already had FROPA.
-
Too early to discuss flakes at the picnic tables on clown range GFS on 9/10?
-
I always get the itch to start them back up again, but then life gets in the way compared to my bachelor pad days . They are time consuming to make, but I do like having them as a reference to how a particular season played out. If I have some free time one day, I may start trying to catch up on the 8 seasons that I am behind. I'm actually really bummed that I lost my most recent map...the 2010-2011 winter. I was hoping someone on here saved it, but so far no luck. In the threads that it was posted in, I had used imagehosting links which are now defunct and I had created that one on a laptop that died years ago and foolishly didn't save it to my PC or newer laptop.
-
People also associate the weather that can only occur in that season as "seasons in seasons"....highs of 97F don't happen in the fall or spring but highs of 72F do. Same in winter when the public might associate a high of 12F with "seasons in seasons"...instead of a high of 45F....the high of 45F is actually closer to normal than the high of 12F but highs of 45F occur all the time in spring and autumn, so it isn't unique to winter and it probably changes the perception. But yeah, we always laugh when Kevin thinks November is a winter month when even ORH at 1,000 feet doesn't drop below 50F for an average high until November 11th and is still 42F on November 30th.
-
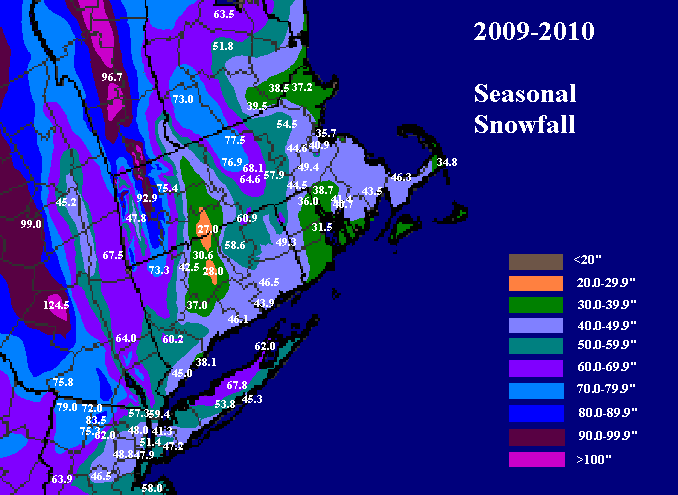
Labor Day weekend of yore puts everyone in the winter spirit
-
Yeah, thats not accurate....you had to get up near the MA border before hitting 10" that far east in MA....Megan was living in North Chelmsford at the time and she had about 6-7, but when I drove to her place and picked her up to get some wifi access in Nashua, I'd say there was a noticeable increase around the northenr part of Tyngsborough just to her north by about 3-4 miles and then it ballooned into about 13" by the time we got to Nashua. Ironically, despite getting less than half the snowfall I got, Megan's 'hood was without power for 5 days while I never lost it.
-
Those are the NESIS maps....not ones done by Kocin like we see in his book. The Kocin maps in his book are much better.
-
I said he was near average, but if we got very specific, he was probably slightly above average snowfall that season....and yes, mostly on the strength of the Dec '09 storm. But they also got some decent snow in the Feb 9-10 bust...like 6-8".
-
No, you were pretty close to average snowfall....Ray's current area was well below average.
-
There is no way the min would be that early.
-
-
Similar in ORH....we had 17" of snow that was just powdery enough that it didn't cause huge power issues. But people from near here just lower down were all coming in and going to the stores since power was crippled in the lower towns just to the east.
-
That's a pretty good sized white faced hornets nest. Hopefully it's high enough up not to be a danger.
-
There were actually two events in October 2009. One on the 15-16th like you recall and another two days later on the 18th...the latter is what produced that crazy Patriots/Titans game in the snow in October. Foxborough was in a great spot for that one...a little extra elevation helped them.
-
Those crisp weekend days of Lab-yore
-
I was looking at JAXA when I made the comments about extent. I agree NSIDC extent looks a bit less likely to finish 2nd but it wouldn't surprise me either. It only needs to have slightly above average losses...though the shape of the ice pack doesn't look as favorable for losses compared to years like 2016 when there was a lot more vulnerable ice left.
-
Area is very likely to finish in 3rd place given the path of 2016 from here on out. Extent is still looking like 2nd place is the most likely but the recent stall has made 3rd or 4th place more possible than it was a week ago.
-
Its weird that someone who seems to be such a weather enthusiast would embrace such an obviously erroneous temperature reading. I mean, I get that it's fun to look at how extreme it is, but it's obviously wrong if we are going by standards set in station sitings.
-
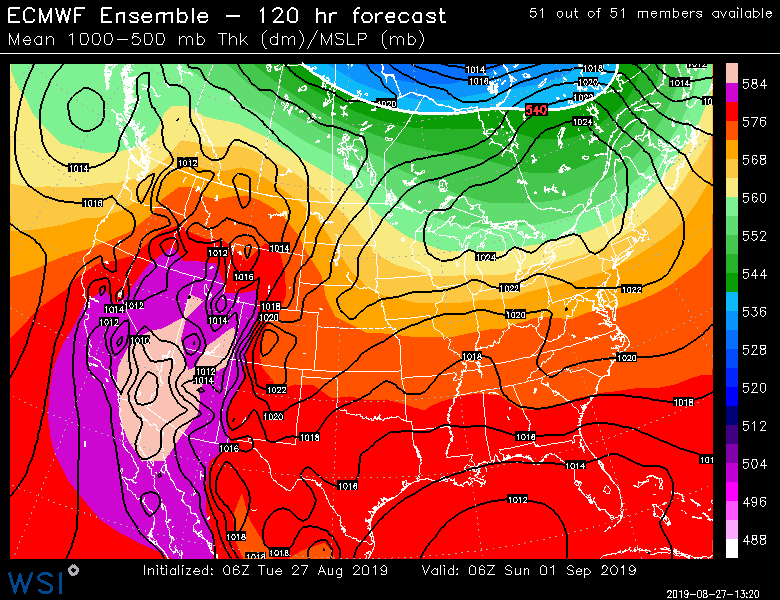
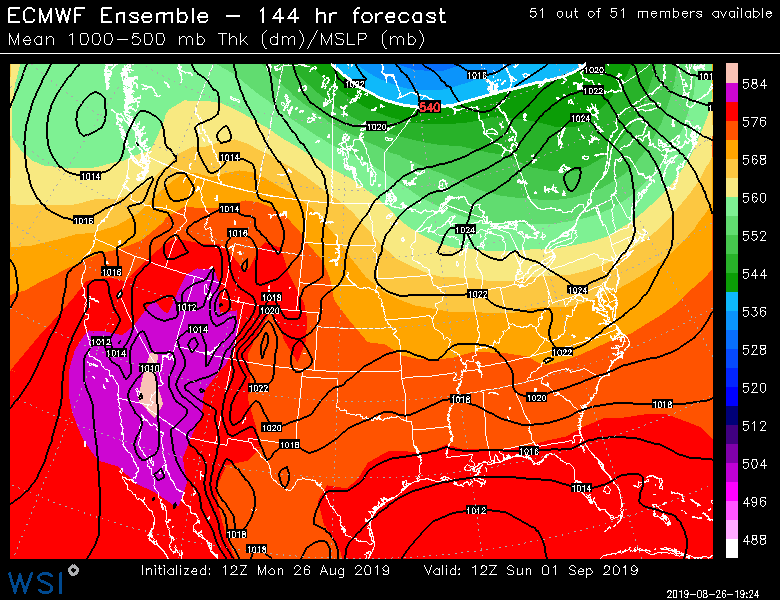
That 540 thickness line intruding into southern Hudson Bay consistently is starting to remind us of the changing season:
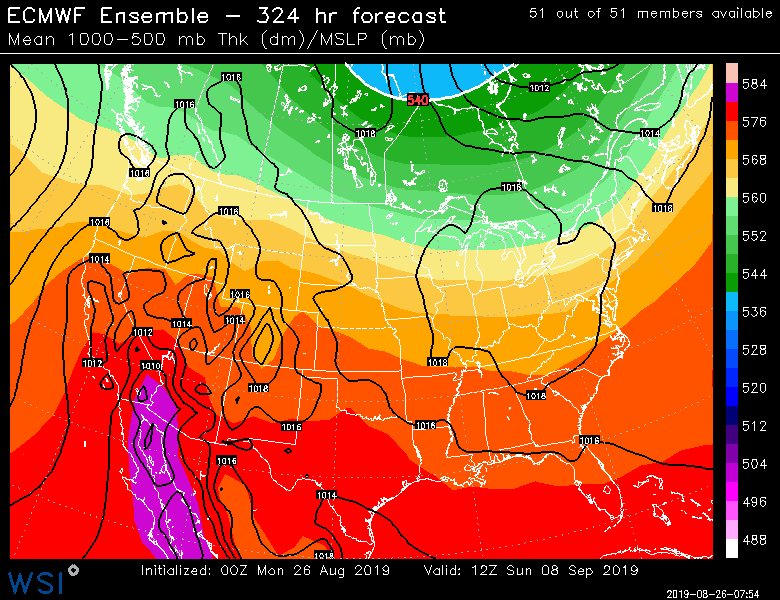
-
I like the look of the EC ensembles toward the 2nd week of September. Looks pretty nice. We'll see if that sticks.
-
I wonder if the bottom of Pinkham notch there around 2k got a weenie freeze. Pretty decent chance.


