

ORH_wxman
-
Posts
90,902 -
Joined
-
Last visited
Content Type
Profiles
Blogs
Forums
American Weather
Media Demo
Store
Gallery
Everything posted by ORH_wxman
-
They didn't physically move the ASOS site at Logan did they? That's all I can really come up with to explain the differences if it's not the instrument itself. If it was something like dark rocks around the site you would think the error would almost disappear during very strong CAA or something similar but it doesn't. I suppose if there were a large enough area of dark rocks or different surface then it could withstand strong CAA but that's the only way I can think of. It does seem like bad instrumentation is the easiest way to explain it but if they tested it and it checked out then we have to start thinking g alternative explanations.
-
Sometimes the ultimate weenie +PNA/-NAO pattern can actually suppress us like Jan 1985....but it delivers too sometimes like 1976-1977. But we rarely get screwed in a -PNA/strong -NAO pattern. It can actually cause storms to try and cut and redevelop south of us ala Jan 11, 2011. IT's one reason that no one index can be the golden nugget....you have to look at all of them together and see what the pattern looks like. EPO is definitely the best one for temperatures....for storms, a +PNA is good, but then again, a -PNA can be really good with a -NAO, because -PNA tends to be very active and then the -NAO will force them underneath us keeping us on the snowy side.
-
It also depends on what the Atlantic is doing too WRT the PNA sign and what we want....if we have a big NAO block, I actually want a -PNA. I mean, this is a strongly negative PNA pattern, but nobody around here will complain about this setup (or this winter)
-
I agree the big +PNA is the best for big storm potential.
-
We actually have a slightly inverse correlation with the PNA and temps...it's pretty insignificant, but our correlation to the PNA is something like -0.1
-
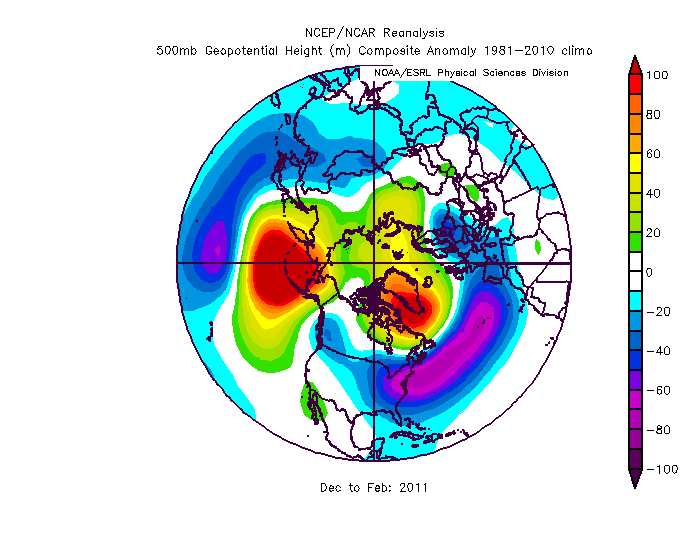
Brutally cold winter and average snow (around 45" at BOS and 65" at ORH IIRC)
-
Yep...to put ORH into context historically....average temperature for the first half of the month ranking (first half = Nov 1-15) 1976.....34.2 (!!!) 2019.....36.2 1933.....36.4 1962.....37.2 1992.....37.4 1986.....37.5 1921.....37.8 1904.....37.8 For anyone well-versed in history, I probably do not need to tell them that 1976-1977, 1933-1934, 1962-1963, 1986-1987, and 1992-1993 were a pretty weenie-ish set of winters. So the extreme cold for first half of November is a good foreshadowing. Nevermind the 1921 year showing up too.....most epic ice storm probably in SNE records and it occurred later that month in November.
-
November departures so far: ORH: -6.6 PVD: -6.0 MHT: -6.2 CON: -6.3 BDL: -4.8 BOS: -3.5......lol
-
Yeah. We kind of had a moderate event that was strictly west of 495 on 12/29/16. Had around 6" in ORH in that one while there was basically zilch inside 495. I was out on winter hill that day Too bad that one actually didn't pop just a hair sooner because it had an incredible stinger just north along the NH seacoast and S Maine.
-
Yeah they had 13 while Lowell had 5
-
I mentioned this before but there was a thin band of nasty icing in that storm...really tough to get that with the marginal cold, but rigjt around where I am in Holliston, Hopkinton up to around Bolton and northeast to near Tip in Ayer....though the icing was a little less up north as it was more rain vs snow...but there was like a third of an inch of ice after about 6-8" of snow in the 2nd storm in that narrow stripe....lots of power outages. Hopkinton was blackout for like 2 days after the event. The icing briefly made it as far west as shrewsbury and west boylston because the next day we were out that direction and I remember a thin layer off crust on the top there whereas just a few miles west back in ORH there was no crust at all.
-
Yeah the first one overachieving right to the coast made it easy to fall for the headfake on storm #2...made everyone think it was happening again but then the R/S line just retreated back to about 495.
-
That storm was my glory...loved that storm. Such a sharp cutoff just inside 495.
-
Biggest problem with the setup is the high retreats really quick. It's possible we get a bit more ZR than shown right now though if it holds a little longer than guidance shows...which has been known to happen on these cold airmasses.
-
Yes. It takes a more anomalous airmass this time of the year. If we had moderating cold becoming stale in place over time like we do here between Saturday and Monday except it was a month later, it would be enough. But this time of year you really need almost pure Arctic airmasses...not all the time, but most of the time.
-
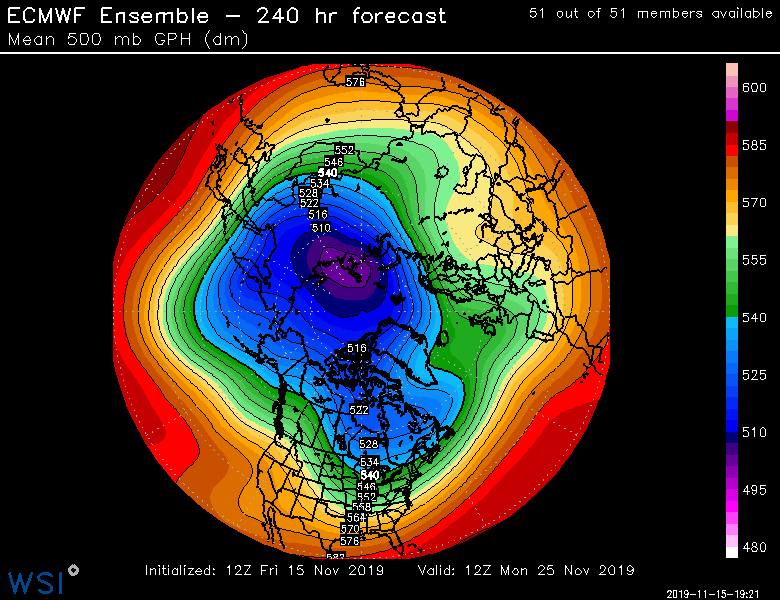
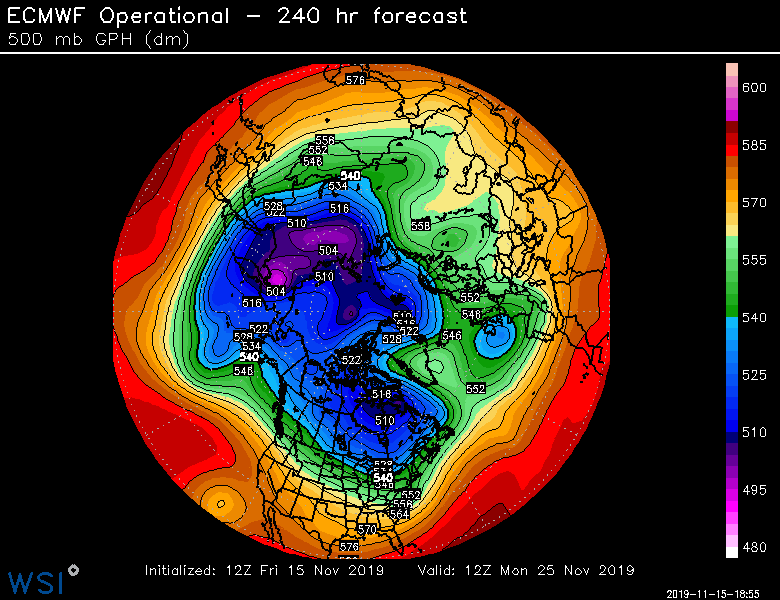
I'll add that the EPS just coming out looks better than the OP run out at the D10 range....
-
It looks ok IMHO...not as good as last night's run or the ensembles, but you can see the -NAO building and it looks like EPO ridge is in the process of reloading. Not gangbusters or anything...agreed on that...but probably enough to keep us bothering to watch guidance for interesting threats...esp for interior this time of year.
-
I'd still watch T-day week...there's some decent cold hanging around and there's a pretty decent -NAO look on both GEFS and EPS.
-
If the euro seasonal thinks we're getting normal 2m temps then it actually means it probably has a frigid H5 pattern.
-
Winthrop coop is where the measurements were taken from 2010-2018....but not anymore...it is defunct now. That's why we had the disaster "new location" last winter.
-
Lol. Hes trying to get everyone else to call it the FV3 but nobody is falling for it.
-
Btw Ray...sorry for the mild hijack of your thread. I haven't read your outlook yet but plan to after eating a couple bowls of chili and then sitting on the stall. They are always a good detailed read.
-
I only listed the past few years....but its the same going back much further....that 27.4 vs 43.3 is by far the biggest discrepancy....and it's not getting fixed either. That awful 27.4 value is going to stay there unless NWS BOX wants to try and jump through 10 million hoops to change it.
-
Last year's BOS total was unusable. There's really no other way to spin it. We're not just talking about the old weenie "But Logan isn't representative of the city!!"....I'm talking about versus normal Logan airport measurements..... last year's snow measurements were sometimes late, measured after events ended, and apparently out at the water treatment plant on deer island. The fact that Hingham on the water had 43.3" while BOS had 27" is enough evidence on how bad last year's total was. It was the first year of using the new observer and observation location.... Show me which year doesn't "look like the others": Year..............BOS.....Hingham 2014-2015....110.6....117.7 2015-2016....36.1......37.4 2016-2017....51.7......47.6 2017-2018....60.2......59.9 2018-2019....27.4......43.3
-
Yep. Def helps. But the RH seems to be the biggest factor. Of course around here those stronger W and NW winds help cause the RH to drop so they can be related. Scenarios like you explained is where the lower winds can really help. You get rain and then no strong CAA...kind of unusual in the cold season... but the low winds and clearing skies leads to radiational cooling and you fall to like 28/28 and everything freezes with minimal evaporation. Almost like a freezing fog scenario.


