ORH_wxman
-
Posts
90,902 -
Joined
-
Last visited
Content Type
Profiles
Blogs
Forums
American Weather
Media Demo
Store
Gallery
Everything posted by ORH_wxman
-
TS Fay - Drought ending Rains and Severe Convection
ORH_wxman replied to weatherwiz's topic in New England
A few showers here last night. Very little wind. Wouldn’t even know there was a TC unless you were following it closely. -
I’ve had 1 90F day so far. ORH airport has had zero. Kind of crazy considering what has gone on in NNE.
-
+24 to +25C on 7/19 on the Euro....another day 9 record-breaker.
-
At least the Euro dumped the BDF next week....but it squashed the heat dome even more...now it just clips SNE with +20ish for a day or so. At least we get much better thunderstorm potential on that look.
-
Nice BDF on the Euro now for next week. That heat dome is getting pinched off much faster now....shocker.
-
Until I see, the ensembles do it....I'm selling. The ensembles are impressive, but they still sow enough of a hint of it getting pinched and we end up with 20C for a day or two.
-
Looks like tuckermans still has some decent sized snow fields. It’s weird from year to year...I remember going there around this time in 2014 and there was no snow left (at least visible...prob some hidden patches remained). Yet in 2020 when they’ve had record warmth for a chunk of June, they have large fields still visible, lol... Granted, it was damned cold in April and first half of May, so maybe that played a factor.
-
75/59....really nice out as we near lunchtime.
-
I think we'll want to see a big CAA/Baffin or greenland high at some point to have a legit chance. The ice in the Beaufort/CAA is lagging 2012 significantly and the high rotting on the Asian side of the CAB is keeping the ice flowing toward the Beaufort. The Laptev and adjacent part of ESS is trying to make up for it, but I don't trust counting on huge losses close to the pole as we get into August....2012 had an amazing advancement of open water via the Beaufort/Chukchi/ESS sector.

-
We've been getting a bunch of warm Januarys/Februarys recently after a string of cold ones in the 2009-2015 time range. Hopefully we can swing it back cold this winter. 2019 was kind of cold in Jan/Feb but we had so many cutters mixed in that it didn't feel like it, lol.
-
Yeah your area got the shaft that winter....you missed the big December fun in both directions (12/9 to the south and 12/25-26 to the north)
-
Summer 2020 Banter and random observations
ORH_wxman replied to Baroclinic Zone's topic in New England
Randolph got destroyed in the retro-storm in late February....they stayed mostly (or all) snow looking at the totals. Probably a lot of upslope assist there on east winds to isothermally cool the column. -
Spring 2020 New England Banter & Random Obs
ORH_wxman replied to CapturedNature's topic in New England
Alright ya’ll...drop the blame game on the thread being closed. There’s plenty of reasons including posters in this subforum. It ran its course. Yall can take it to PM or Ampol. -
Spring 2020 New England Banter & Random Obs
ORH_wxman replied to CapturedNature's topic in New England
Yeah ya’ll, take the personal stuff with your rifts at Ampol out of here. -
Spring 2020 New England Banter & Random Obs
ORH_wxman replied to CapturedNature's topic in New England
It had run its course. We’re the most lenient subforum when it comes to moderation, but the thread had become more and more political. Early on, the thread typically got back on track quickly when it strayed, but the political posts and personal attacks started dominating ....and rather than start expending more time and energy moderating people for content in a thread that was marginal even in it’s early days, it was decided to shut it down. -
Weak sea breeze advancing to the west...only should drop temps into the 70s though. 81 here currently.
-
Looks similar aloft to ‘07-‘08 actually. Wouldn’t be surprising at all.
-
You’re probably wondering what the hell all the rumors were about moderate summers in New England, lol....prob near-record warm start to summer up in northern New England. You’ll get an AC and then not have to use it for the next 2 summers...LOL. Nice reprieve today though.
-
Also gotta watch out for a raging bull moose during the rutting season in fall. All jacked up on testosterone. They have been known to go psycho and attack people trying to shoo them off. I remember one story where a guy got attacked after the moose was curious about its reflection in a large window while passing by on the property. Its funny because other times of the year they are pretty skittish.
-
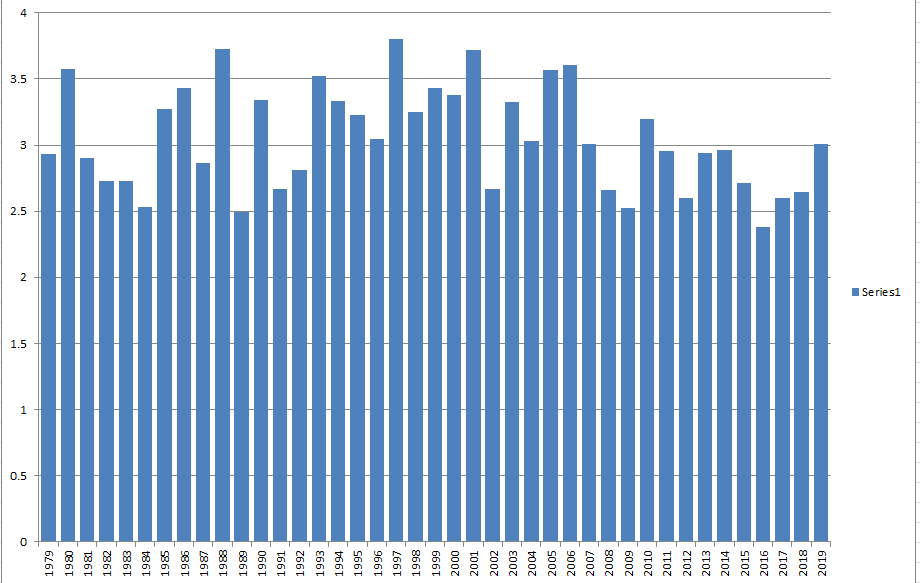
We have the final June numbers in....here's the breakdown of what the minimum in 2020 would be if we followed the same path as every other year: So if we followed the same path that 2019 followed after 6/30, we would finish at 3 million sq km of sea ice area. The post-2007 average path followed is 2.78 million sq km which is what I will use as my baseline. However, there are two factors that will cause me to lower this baseline a bit. First, is that we had a 340k(!!) loss on 7/1....and second, we have a very hostile pattern for the ice. We're currently into a nuclear dipole pattern which would continue to assault the ice for the next week. This will help increase melting and melt ponds while the sun angle is still pretty high in the arctic. Normally, I would put the chances of passing 2012's minimum of 2.228 million sq km at close to 0% based simply on the chart above. But I'll give it an outside shot of happening this year given the current pattern and the huge loss on 7/1. My prediction will be for minimum sea ice area in 2020 is 2.5 million sq km +/- 300k. A minimum of 2.5 million sq km would be 3rd lowest. The top two are 2012 (2.228) and 2016 (2.463). Sea ice extent is a little more fickle since it can depend on compaction vs area which is very straight forward. But for the minimum daily NSIDC sea ice extent, I'll go with 3.8 million sq km +/- 500k. I use larger error bars on the extent due to the much higher standard deviation.
-
Aka, Mt Mansfield visits Scooter for 6 weeks. I remember running the stats, you had like 20-something days of measurable during that stretch and like 30 with a trace or more. So many days in between storms would put up like 0.6”...lol.
-
I’ll never embrace high dews from a comfort standpoint. The only reason I’d want them is if we have a legit severe wx setup. I don’t understand what high dews accomplish for outdoor activities that a day like 84/53 does not. Maybe if I’m spending all day at a pool party or waterpark I could make an exception.
-
Just got drenched by a nice storm....still raining. Another quick inch it looks like before it moves out.
-
Saturday, June 27 - Sunday, June 28, 2020 Convective Thread
ORH_wxman replied to weatherwiz's topic in New England
Yeah looks like MPM might make up for lost time. That looks big just west of ORH. -
Saturday, June 27 - Sunday, June 28, 2020 Convective Thread
ORH_wxman replied to weatherwiz's topic in New England
Can you imagine Kevin downplaying a snow advisory event in winter? There would be dozens of posts about it “ripping” and “heaviest snow of the season”.