

ORH_wxman
-
Posts
90,902 -
Joined
-
Last visited
Content Type
Profiles
Blogs
Forums
American Weather
Media Demo
Store
Gallery
Everything posted by ORH_wxman
-
Weaker Nina is often fine during multi-year...00-01, ‘08-‘09 and ‘17-‘18 were all during multi-year events. The stronger events seems to do worse multi-year but there are exceptions like ‘75-76.
-
Happy hour still exists in MA but they just work around the “law” they wrote for it. As others said, they usually make food super cheap. Or they will bundle the alcohol with food. You still have drink specials but they just make them for the whole evening. They can’t discount them just during the early hours.
-
Yeah here is the main site. I had linked to the map itself, but you can go to other regions from the main site. It's def nice to have a map that will catch the SPECIs http://weather.rap.ucar.edu/surface/
-
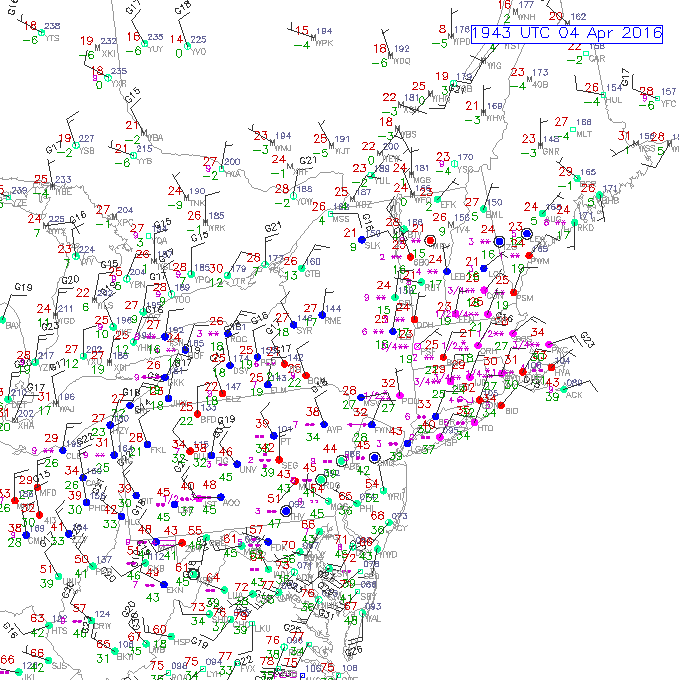
It actually updates like every 10-15 min. I didn't save a plot from this site for the ice storm, but one of my favorites that I did save was from April 4, 2016 when powder snow was falling right into Logan airport and it was in the 70s south of PHL. Don't typically get a gradient like that.
-
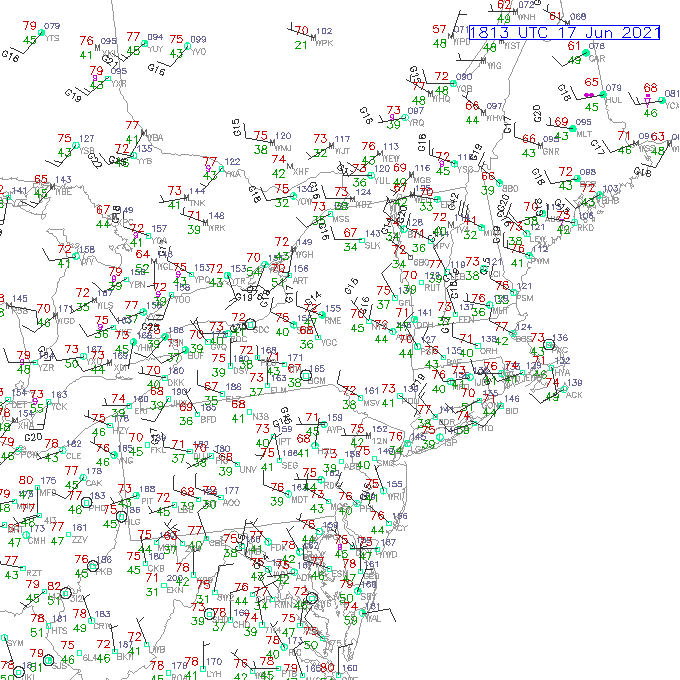
Rap real time is a good site too https://weather.rap.ucar.edu/surface/displaySfc.php?region=alb&endDate=20210617&endTime=-1&duration=0 It's the one I use the most for regional obs
-
The 2/1/21 storm definitely had one of the bigger coast to 128 gradients we've seen in a long time. As Scott and others have said for years, it was due to happen. The moisture was pretty incredible though in that. Most of my 17" fell in like 5 or 6 hours. I think you'd have to go back to January 3-4, 2003 to find a storm with that much coast to 128 gradient. There's been plenty of other storms since then with gradients, but not from "near zero to 3-4" of slop" on the coast to over a foot in like a 10-15 mile span since that '03 storm I don't think. Oct 2011, the gradient was more between 128 and 495....and February 24, 2010 was more of an elevation dependency....between like 495 and ORH hills. Jan 17-18, 2010 was kind of similar but not the prolific amounts. Coast got mostly skunked while 128 and westward had like 5-8"....but not over a foot. Maybe I'm missing another one in there somewhere but I don't think so. You prob have to go to 2003 to find one that big between coast and 128.
-
Around now is when we start tracking NSIDC area....and the reason I like to track this is NSIDC area is a good proxy for melt ponds due to the SSMI/S satellite it uses being "fooled" by melt ponds into thinking it is open water, so the area metrics respond to them. And we care about melt ponds in June because they are the best predictor of both minimum area and extent from this time range. Far better than extent metrics or non-SSMI/S area metrics. Anyways, 2021 area on 6/15 was 8.63 million sq km, here are how previous years were in relation to that number (negative means that year had less ice) 2020: -130k 2019: -370k 2018: +250k 2017: +200k 2016: -190k 2015: +40k 2014: +170k 2013: +280k 2012: -640k 2011: -110k 2010: -120k 2009: +750k 2008: +300k 2007: -50k
-
It can kill 60-70k actually....2017-2018 flu season had around that number. The "delta" variant breakthroughs aren't all that compelling unless they are killing vaccinated people.
-
That's probably the saddest part of it....the people who need help the most are on the receiving end of the violent crime surge.
-
There's always going to be some crime where a lot of people are living in high density....the way to measure it though is on a relative scale. Violent crime is absolutely surging right now compared to the normal pre-2020 baselines. That is not a good thing at all. It is what helped hollow out a lot of cities in the 1970s/1980s.
-
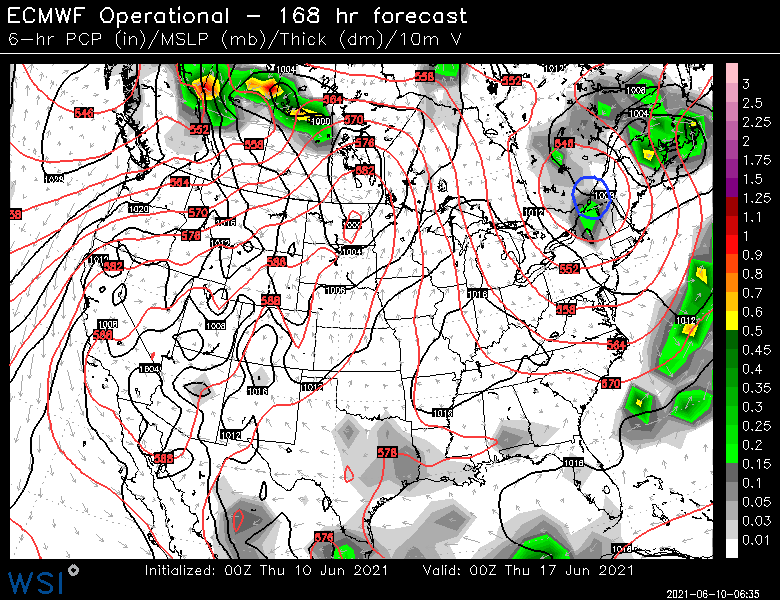
Prob not going to threaten the new record this year unless the pattern changes. The ensembles don't look overly exciting as they are producing a strengthening vortex over the CAB through the solstice. We need that to reverse and show strong high pressure to get the ice into better position to threaten 2012. We're kind of tracking the 2010s average on a lot of metrics at the moment.
-
Wow awesome pic Nick. Thats crazy for 10 days into June even up there.
-
The property value argument is a straw man because aesthetics isn’t a very convincing argument to a larger audience. The problem is you have some medium density communities that are very close to high density neighborhoods and amenities but don’t want to increase the density in their own little island. If you want to live in a low density area, there’s more than enough room in America, but you have to be willing to be well outside a major city.
-
Prob like 91 or 92?
-
Ok that is definitely wrong on the elevation then. It sounds like it is claiming the same location as the coop site in northern ORH but I believe that elevation was like 610 or 620 feet.
-
Yeah HOAs are not very common in New England....you do get them in those townhouse neighborhood a lot, but otherwise they are fairly rare.
-
Can't quite read that google doc....which ORH site is that? There's a good coop in northern ORH near Indian Lake that was around 600 feet which reported as the official site for years. 402 feet is really low....I wonder where that is. I think Lake Quinsigamond is the only place that is that low inside the city limits.
-
You kidding? We'd have an entire thread of whining. Tropical threats in SNE usually involve a few lawn chairs blown over after DIT promises forests being flattened.
-
I feel like in New England, you have to push the warm seasons back a couple weeks from the "meteorological XXXX" distinction. We all know spring isn't really 3/1 in here either. Prob more like late March. Ditto for summer....it's not uncommon to have cruddy/miserable stretches in early June but usually they are done by late month.
-
What was the last legit COC summer we had? 2000? 2009 was brutally chilly but it wasn't because of COC, it was super wet in June/July. 2000 I recall lots of legit chilly/dry nights. 2007 was pretty COC too, though not like 2000 that I remember. But IIRC CON had 30s a few times that summer in June and August.
-
A coating on the picnic tables next week?
-
Dude, just block him if he bothers you that much.
-
Not being saddled with a 600 or 700 dollar per month student loan payment would go a long ways as well. We've talked about the insane cost of college now, but that is definitely a hindrance to younger generations buying a home....and we know buying a home is a fastest way for upward mobility on wealth.
-
1997-2012 is also kind of a bad cherry-picked time frame that is way shorter than 1935-1980 and also different circumstances. The 1935-1980 period has the beginning in the middle of the great depression (start at the nadir)....the 1997-2012 time frame starts during the late 1990s boom and ends in the aftermath of the GFC. That said, you are right about the unique circumstances of the middle 20th century where the rest of the developed world was bombed back to the stone age and America was the one left standing to rebuild everything for the globe. That kind of advantage cannot be replicated by simply changing the tax code or labor laws. Actually enforcing some anti-trust laws would probably help with real wages, and if the government ever gets out of the business of subsidizing massive education loans, there might be a correction in the inflation of tuition. Housing is the toughest one though. Not an easy fix with all the NIMBYism and environmental hoops you have to jump through to build more housing these days.
-
10 Year Anniversary. June 1 2011-2021. Monson Springfield MA
ORH_wxman replied to HoarfrostHubb's topic in New England
This was one of the few severe events here where I was following the models like I would for a winter threat. Like 36-48 hours out and closer I remember a bunch f us posting soundings in the thread. The numbers were so good.


