

ORH_wxman
-
Posts
90,902 -
Joined
-
Last visited
Content Type
Profiles
Blogs
Forums
American Weather
Media Demo
Store
Gallery
Everything posted by ORH_wxman
-
For the whole month, yes...but I think the first 13 days of 2009 were definitely colder than the first 13 of 2021.
-
Yeah I’m def more for the chill/relaxed vibe. We spend most of the week on the lake in Maine and usually bring the kids to storyland one day and that’s also when we stop in N Conway afterward on the way back.
-
My wife loves the general store there. We usually stop in once during our week-long vacation 30 minutes away in Maine. It’s a fun town to go into for an afternoon or maybe an evening for dinner, but I kind of side with Phin on not wanting to be there a long time. I start to get claustrophobic with some of the tourist crowds after a while. N Conway does have some sweet views though just walking around there.
-
Man, ORH running a -4.3 departure through 13 days this month. Not 2009 levels but still pretty cold compared to recent years.
-
I went to the Red Sox game the other day and took the green line from Riverside...I feel like about 20-25% weren’t wearing masks but nobody was enforcing it. My guess is they will probably drop the requirements in another month or two assuming there isn’t a big resurgence here.
-
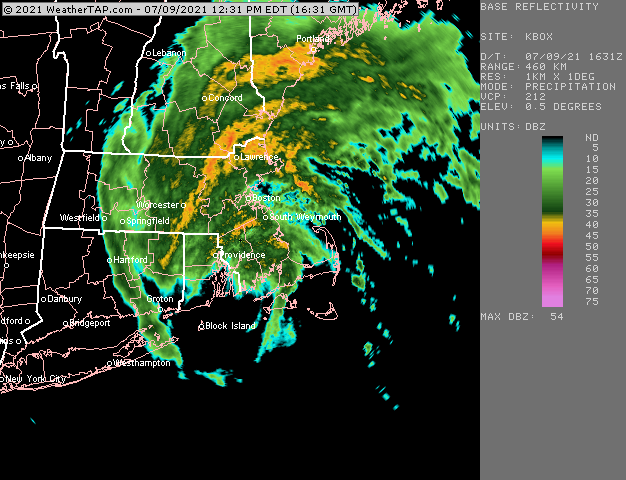
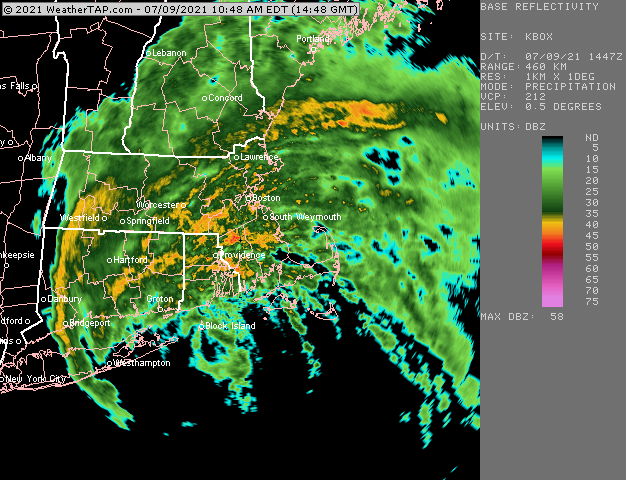
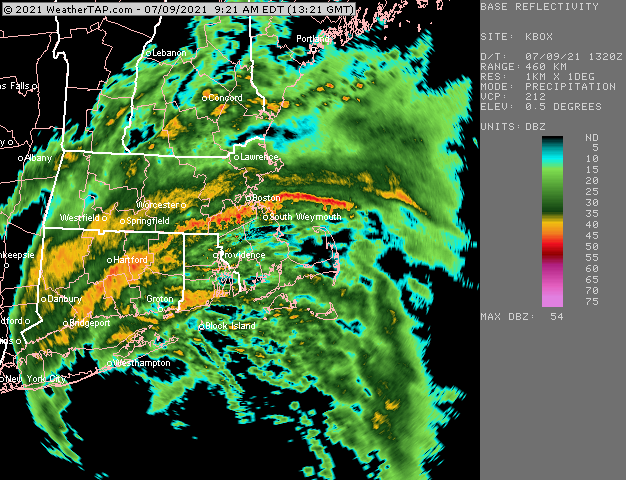
Over 3.5" here now. Still getting hit good but the best is slightly NW at the moment.
-
Deluge
-
Getting smoked here
-
Definitely a semantics argument. Hard to believe you’d have a mass infusion of people that need to be hospitalized from another wave of covid without having deaths with it.
-
They won’t come back unless a big wave of people dying returns...which is unlikely in our region where like 80% of adults are vaxxed.
-
At this point (barring a minuscule minority of people who cannot safely take the vaccine), if you remain unvaxxed and get a serious case of covid, that is on you. Anyone who has wanted a vaccine has been able to get one with fairly minimal effort for a couple months now (longer in some areas).
-
My 5 year old had covid back in April and it was less severe than most colds he has had. We almost never found out but we decided to test him when he complained of a mild headache and had a low grade fever (around 100F) and there had been a couple cases in his daycare. The mild symptoms lasted maybe 2 days. My 2 year old never caught it from him despite us making no attempt to separate them. Guess it's that much harder for a 2 year old to catch it.
-
Just had a really nice storm come through.
-
ORH already at 56F. No monthly record low. Still a great shot at the daily record though. Kind of sucks that we couldn’t get the monthly record if it’s going to be this horrible.
-
Time to beat 1992 and 1978. Embrace the disaster.
-
I posted earlier that ORH has a legit shot at the all time July record tomorrow. 55F in 1978.
-
This is a crazy pattern. From impressive heat to epic cold for July. Gonna have to watch closely tomorrow...ORH legit could set an all time record low max for the month of July. Current record is 55F set on 7/4/78.
-
The warmth in Siberia probably will have the largest effect on the Laptev and East Siberian sea ice....because the snow cover there in northern Siberia melted out earlier this year and that helps push warmer air closer to the ocean. IF we were having a warmer year on the other side of the arctic where the Beaufort and Chukchi are, then we might have had a chance at a new record, but those seas are lagging way behind on the melt this season which will prevent a new record unless something really crazy happens. If we look at the average temps (listed below) in the arctic basin (north of 70N) in the Dec-Mar time frame, we see how warm it was for some of those seasons between 2014-2018 when we were really lagging on the refreezing in the Chukchi. But the last 3 winters have cooled back closer to the late 2000s baseline. The question is whether we spike back up quickly to the 2014-2018 levels or if it takes another decade or two to consistently get there again. The arctic can be notoriously volatile on temp swings. 2000 -18.706 2001 -19.469 2002 -18.780 2003 -19.126 2004 -19.802 2005 -17.880 2006 -17.321 2007 -18.124 2008 -18.628 2009 -18.553 2010 -17.506 2011 -17.678 2012 -17.581 2013 -18.566 2014 -16.554 2015 -18.181 2016 -15.655 2017 -17.128 2018 -16.510 2019 -17.756 2020 -18.734 2021 -18.239
-
We need winter temps to warm more to get to reliably ice free summers. Right now we are kind of in a new equilibrium where most of the ice is first year ice but the winters are still cold enough to freeze the first year ice to near it's maximum thickness (around 2m). We've been flat on volume since 2010. The minimums are mostly dependent on weather...specifically May and June weather which iswhy we can forecast the area mins somewhat accurately at this point. We saw some extremely warm winters in the 2014-2018 time frame, but the most recent 3 winters since 2019 have sort of reverted to the late 2000s baseline. We'll have to see if we see them spike back up.
-
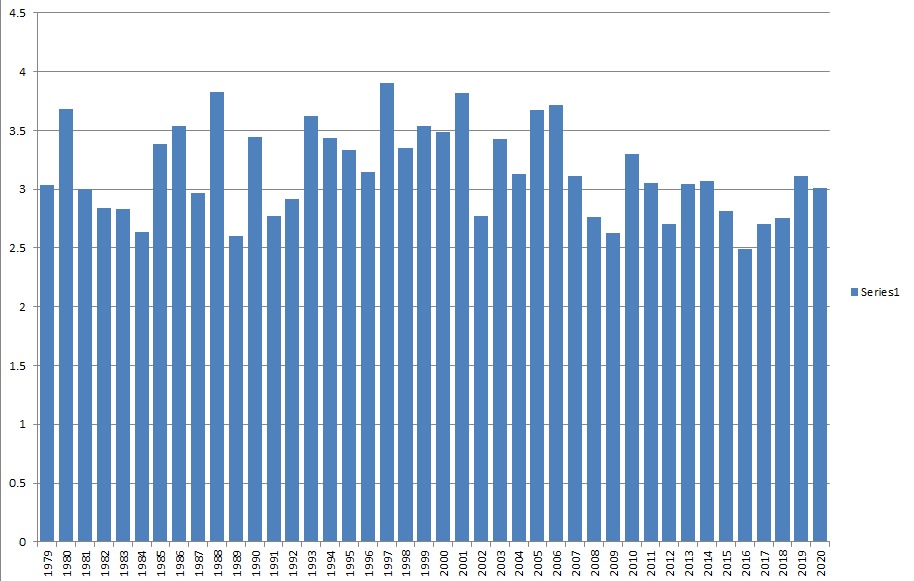
Given we're now past 7/1, it is time for the annual forecast. Quick update on standings: 2020: -430k 2019: -380k 2018: +390k 2017: +70k 2016: -180k 2015: +190k 2014: +320k 2013: +390k 2012: -590k 2011: -140k 2010: -310k 2009: +710k 2008: +280k 2007: -330k You can see last year's forecast here: And here is last year's verification: As for 2021.....below is what the final area would be if we followed the path of every other year from here on out. An example is that if we followed the path of 2012 from here on out and lost another 4.3 million sqkm of ice like that year did post-7/1, then we would finish at 2.7 million sq km. The reason the forecasts are pretty accurate is that area loss post-7/1 is pretty stable over time going back to 1979. There has been a bias toward a little bit higher in the post-2007 world, but it is much smaller than the differences we see prior to July 1st (i.e., most of the area loss can be explained by what happens prior to 7/1.) Two things stick out on the graph....one, is that any minimum above 4.00 million sq km is basically impossible no matter which path we follow. Nevermind that we haven't had an area min above 4.0 million sq km since 2006 anyway, but there isn't even a realistic shot at one this year like perhaps was plausible in years like 2014. Secondly, the chance at a new record minimum is basically impossible too. The two largest melt years post-7/1 were 1989 and 2016. You can see following both of their paths still only produces a min around 2.5 million sq km....well above the record-low 2.23 million sq km minimum in 2012. Given that information, I will use the post-2007 average as my baseline. I might even skew a little on the high side of that unlike last year because the forecast is quite stormy over the arctic basin for the foreseeable future. The EPS have a pretty strong vortex over the pole through mid-July which is wasting what's left of prime insolation season up there. Taking a post-2007 average result post-7/1 purely at face value would yield a minimum of 2.9 sq km in 2021. I'll skew just a touch higher than that based on the forecast and current distribution of the ice. So for an area minimum, I'll forecast 3.0 million sqkm +/- 300k. That would place 2021 around 8th lowest. Sea ice extent is a bit more fickle since compaction plays a larger part unlike area. But I'll go 4.3 million sq km on NSIDC extent +/- 500k. I have a larger range on the extent min since it has a much higher standard deviation than area.
-
7.09 million sq km is the NSIDC area today....usually I want to see something around 6.60 million sq km or lower by tomorrow to have a plausible shot at a new record. Preferably lower than 6.5 million sqkm.....2012 was 6.42 on the 7/1 data (which isn't reported until 7/2)
-
toss the 100F at BOS....esp with SW wind
-
NSIDC area numbers: 2021: 7.16 million sq km 2020: -90k 2019: -310k 2018: +450k 2017: +270k 2016: -20k 2015: +370k 2014: +360k 2013: +520k 2012: -450k 2011: -80K 2010: -360k 2009: +870k 2008: +510k 2007: -20k 2021 is somewhat on the lower end in the post-2007 era, but not threatening a new record. After two more days of data, I'll post my prediction for final minimum like every year. Unless we see some drastic changes, a new record min will be all but ruled out.
-
What's weird is max temps have risen faster since 2000 in the summer than min temps They've risen almost twice as fast here. Granted, only 20 year sample, but that is completely opposite of the trend from 1950-2000. Even weirder, the rest of the year has been the usual...min temps continue to rise much faster than max temps. But for the summer months, it has not followed that pattern the past 2 decades.
-
Agreed. Ten years doesn’t even change that much. Obviously there are some underlying factors that are different versus 20+ years ago, but it’s pretty silly to just discard analogs because of that. Let’s not act like previous ENSOs didn’t buck trends either or have weird things happen. Just last winter we kept mentioning how we were getting El Niño during a La Niña similar to what happened during a 4-6 week period in 1975-1976. Or how can we forget 1968-1969 acting like a La Niña.


