

ORH_wxman
-
Posts
90,902 -
Joined
-
Last visited
Content Type
Profiles
Blogs
Forums
American Weather
Media Demo
Store
Gallery
Everything posted by ORH_wxman
-
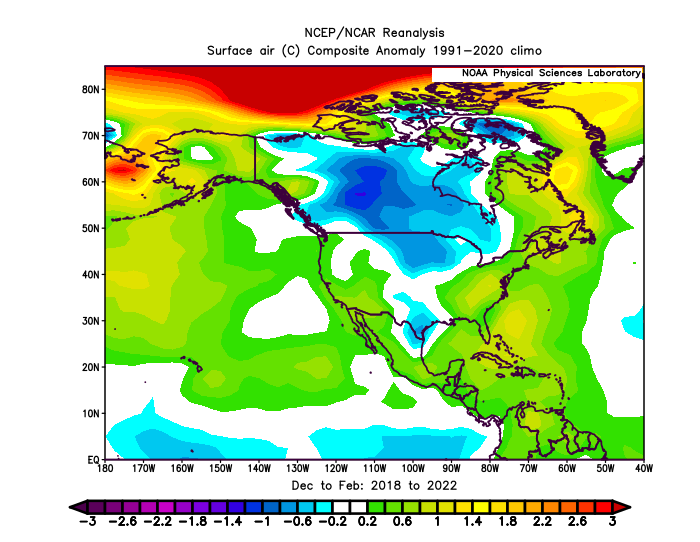
Here it is on the Continent level....we've had the cold source well primed....we just haven't been able to get that to bleed over the top like we did in many other winters such as 2013-2014 or 2008-2009.
-
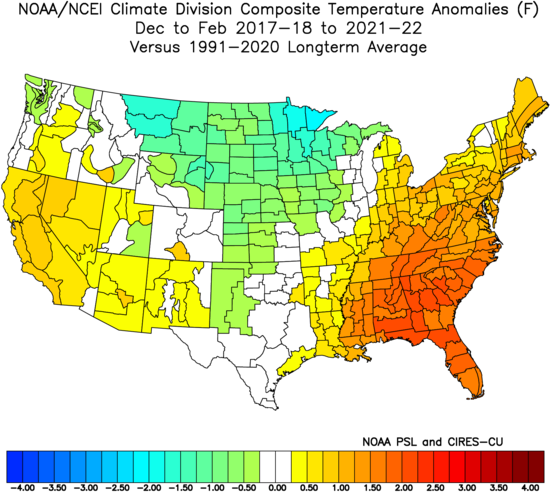
We've been in a pretty severe cold drought in the east for seasonal cold winter temps too...so we're prob due for a few colder seasons even within the present day baseline. Areas like the midwest and plains have been much colder....it even shows up well on the 5-year composite. The upper plains/N rockies have actually been below average in the means the last 5 years while the east has torched.
-
Yeah these are fair points....I'm not saying I would be forecasting a -NAO right now. I'm just not that confident in a +NAO either. We can probably add a "neutral" category in there too. Years like 2008-2009 would prob fit that mold....technically positive, but barely so and most of that coming in March. We could prob say the same for '02-'03 that barely averaged positive. I'm also not confident this is going to be a modoki Nina....the subsurface is pretty cold into Nina 3/3.4 compared to Nina 4.
-
I don't see an obvious pattern there, but this is admittedly a pretty crude exercise.
-
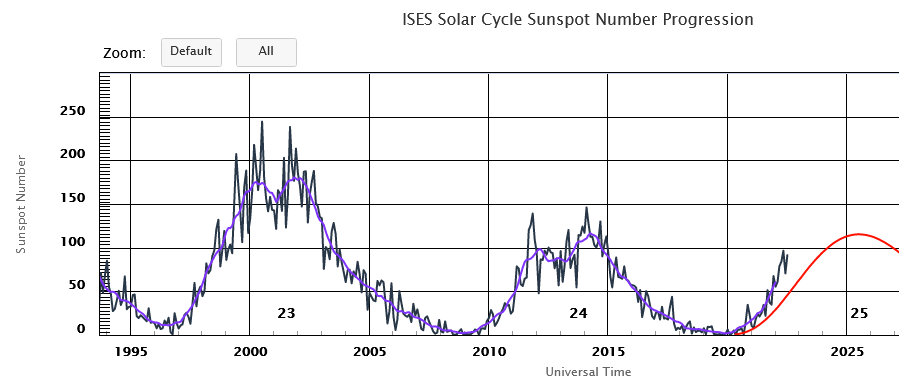
I guess we could start overlapping these with ENSO phase to see if a clearer pattern emerges, but you start reducing sample size when that happens. Like lets pull all the -ENSO years from these "solar increase" periods (defined as the solar cycle is on the upswing or near peak but not an obvious local dip like late 2000): 1955-56: -NAO 1956-67: +NAO 1967-68: -NAO 1970-71: -NAO 1988-89: huge +NAO 1998-99: +NAO 1999-00: big +NAO 2010-11: huge -NAO 2012-13: -NAO 2021-22: +NAO
-
Does this hold up empirically? I can sort of understand the logic from a qualitative standpoint but I haven't seen anything empirical that backs it up. I'm just eyeballing these solar cycle graphs and I see all sorts of noise on the NAO for winters where the solar cycle was on the upswing. It seems the "solar cycle increase/peak = +NAO" idea worked well in the +NAO-dominant period of 1980ish through early 2000s.....but outside of that period it's all over the place. The previous increase to peak was in the late 1960s to 1970ish (which we all know was massively -NAO period)....the one before that was the 1955-1959 period...another -NAO dominant stretch (sans '56-'57) and then the ones after that are 2010-2014 which was a mixed bag ('10-'11 and '12-13 were -NAO while '11-'12 and '13-14 were positive) and then the current one which started last year.
-
Update: NSIDC SIA was 4.00 million sq km on 8/16. Here's how other post-2007 years compared on the same date: 2021: -230k 2020: -960k 2019: -920k 2018: -220k 2017: -310k 2016: -740k 2015: -480k 2014: +620k 2013: +140k 2012: -1.06 million (-1060k) 2011: -650k 2010: -50k 2009: +50k 2008: -240k 2007: -750k
-
Why are we so confident in a +NAO? Esp in a weakish ENSO regime? Solar activity is still pretty low by historical standards and we've had plenty of -NAO winters near the peak of solar cycles (see 2000-2001).
-
Yep agreed. That has been a pretty typical feature for modoki Ninas. Even the good ones….you just hope that part of the polar domain stays decent enough to offset. Hopefully we get a big SSW like 2000-2001 to offset some of that. That’s what probably gave us that epic finish that winter. Regardless, still feeling decent about December at least and maybe January. I’ll feel even better if this stays pretty weak.
-
I also think 2011 had some pretty big (and ill-timed) solar activity in November/December that may have played a role in a strong PV up in the EPO region that winter.
-
Yeah the outlook would probably change if this goes more basin-wide, which I feel like has a decent chance of happening. I'm also wondering on intensity....a few weeks ago, I would have said no chance at a moderate Nina, but now I think that is perfectly plausible, though I still favor weak at the moment.
-
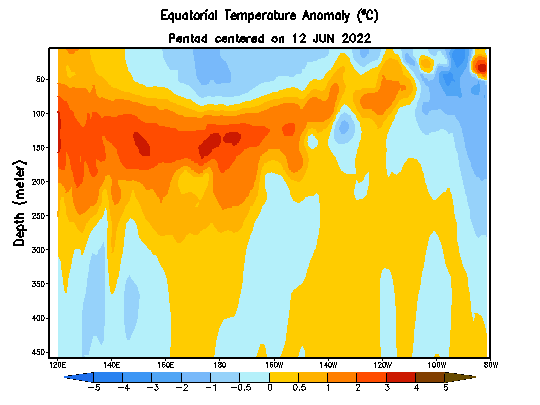
I'm wondering if this Nina starts moving away from the modoki look over the next 6-10 weeks. Coldest Tdepth anomalies are really centered over region 3.4/3. You obviously have to upwell them to the sfc, but they seem to be rising.
-
3rd year Ninas are pretty rare. But within that small sample, every December has been cold Dec 1910 Dec 1975 Dec 2000 Dec '56 and '85 barely miss the cut due to them being borderline cold neutral cases, and Dec 1945 barely misses because the prior year was borderline cold-neutral sandwiched between 2 Ninas. 1956 was actually just barely below avg so you can classify it as average temps. But there is a notable lack of warmth in all those years for December. So I think our chances for a colder December are increased this season from the baseline. Most of those winters went out with a relative whimper though with a huge exception of 2000-2001.
-
Update: As of 8/13, the NSIDC SIA was 4.07 million sq km. Here’s how other post-2007 years compare on the same date: 2021: -240k 2020: -960k 2019: -850k 2018: +100k 2017: -340k 2016: -470k 2015: -490k 2014: +480k 2013: +190k 2012: -1.04 million (-1040k) 2011: -650k 2010: +80k 2009: +250k 2008: -350k 2007: -690k
-
Update: On 8/10, the NSIDC SIA was 4.25 million sq km. Here's how other post-2007 years compared on the same date: 2021: -350k 2020: -850k 2019: -830k 2018: -190k 2017: -380k 2016: -590k 2015: -560k 2014: +420k 2013: +80k 2012: -1.16 million (-1160k) 2011: -690k 2010: -60k 2009: +220k 2008: -290k 2007: -600k
-
Here's the post-2007 NSIDC area minimums: 2007 2.954993 2008 3.079552 2009 3.547109 2010 3.072129 2011 2.916451 2012 2.228429 2013 3.607877 2014 3.576643 2015 3.139137 2016 2.463209 2017 3.000742 2018 3.235357 2019 2.871403 2020 2.5859 2021 3.1658
-
It makes sense that we're coming back to the pack a little bit since the mean minimum area since 2007 has been 3.03 million sq km (median 3.07 million sqkm)....and we've only had 3 seasons above 3.5 million sq km since 2007....those being 2009, 2013, and 2014. In fact, those are the only 3 post-2007 seasons with a minimum over 3.25 million sq km. The next closest was 2018 at 3.23 million sq km.
-
Update: On 8/7, NSIDC SIA was at 4.32 million sq km. Here is how other post-2007 years compared on the same date: 2021: -220k 2020: -840k 2019 -790k 2018: -10k 2017: -290k 2016: -660k 2015: -470k 2014: +380k 2013: +240k 2012: -1.14 million (-1140k) 2011: -570k 2010: -120k 2009: +200k 2008: -120k 2007: -440k
-
Update: On 7/30, NSIDC SIA was 4.91 million sq km. Here’s how other years compared on the same date to 2022: 2021: -160k 2020: -1.16 million (-1160k) 2019: -810k 2018: -220k 2017: -230k 2016: -720k 2015: -570k 2014: +170k 2013: -50k 2012: -980k 2011: -690k 2010: -470k 2009: +50k 2008: +20k 2007: -590k
-
Update: On 7/26, NSIDC SIA was 5.25 million sq km. Here’s how other post-2007 years compared on the same date: 2021: -250k 2020: -1.06 million (-1060k) 2019: -860k 2018: -350k 2017: -420k 2016: -640k 2015: -540k 2014: tied 2013: -310k 2012: -880k 2011: -690k 2010: -460k 2009: +140k 2008: +100k 2007: -710k
-
Update: NSIDC SIA was 5.40 million sq km on 7/23. Here’s where previous years since 2007 compared on the same date: 2021: -340k 2020: 1.01 million (-1010k) 2019: -840k 2018: -370k 2017: -450k 2016: -600k 2015: -400k 2014: -90k 2013: -460k 2012: -890k 2011: -800k 2010: -310k 2009: +10k 2008: +40k 2007: -640k
-
Large part of the ice pack has fresh snow cover on it from the cold cyclone last week. It's definitely help put the breaks on the area loss since the 2nd week of July.
-
Update: On 7/20, NSIDC SIA stood at 5.52 million sq km. Here's how other years stood at the same point compared to 2022: 2021: -280k 2020: -850k 2019: -880k 2018: -180k 2017: -380k 2016: -480k 2015: -290k 2014: -100k 2013: -220k 2012: -910k 2011: -590k 2010: -110k 2009: +120k 2008: +220k 2007: -500k
-
Update: On 7/16, NSIDC SIA was at 5.84 million sq km. Here’s how other years looked on the same date compared to 2022: 2021: -290k 2020: -720k 2019: -840k 2018: -50k 2017: -200k 2016: -520k 2015: -240k 2014: -60k 2013: -230k 2012: -900k 2011: -360k 2010: -270k 2009: +70k 2008: +190k 2007: -590k
-
I’m not sure how they are getting that data. Only issue I see is that graph is from NASA and not NSIDC….so maybe they are using a different algorithm. Here’s a dataset of NSIDC extent and area but it stops in late 2021…. https://docs.google.com/viewer?a=v&pid=sites&srcid=ZGVmYXVsdGRvbWFpbnxhcmN0aXNjaGVwaW5ndWlufGd4OjU1OGIwZWI0NGI2ZDI5YTM I’ve been using the below site for in-season area updates in 2022 https://cryospherecomputing.com NSIDC has the area available somewhere on their site but it’s hard to find. The top of the first link’s data source explanation might be able to get us there but I haven’t taken the time to try and build my own spreadsheet yet based off it.

