ORH_wxman
-
Posts
93,093 -
Joined
-
Last visited
Content Type
Profiles
Blogs
Forums
American Weather
Media Demo
Store
Gallery
Everything posted by ORH_wxman
-
Yep. Got used to averaging like 55” per year for a couple decades during the formative years. Anyways, still think we might get something in the interior this weekend. Can’t rule out eastern coast either if we can strengthen a little midlevel circulation before it exits.
-
The biggest bias has been speed…models have been wayyyy to slow with the MJO propagation. They were trying to stall it in phase 7 for a week-plus like 10 days ago and then less than 3 days later it was already out of phase 7 and right now we’re already in phase 1.
-
06z gfs went back to showing snow for Saturday night. 00z euro did give about 1-2” over the interior too N of pike. There were a few members on the EPS that did have warning snows but it wasn’t many. Still something to watch…esp interior.
-
Except in Asia.
-
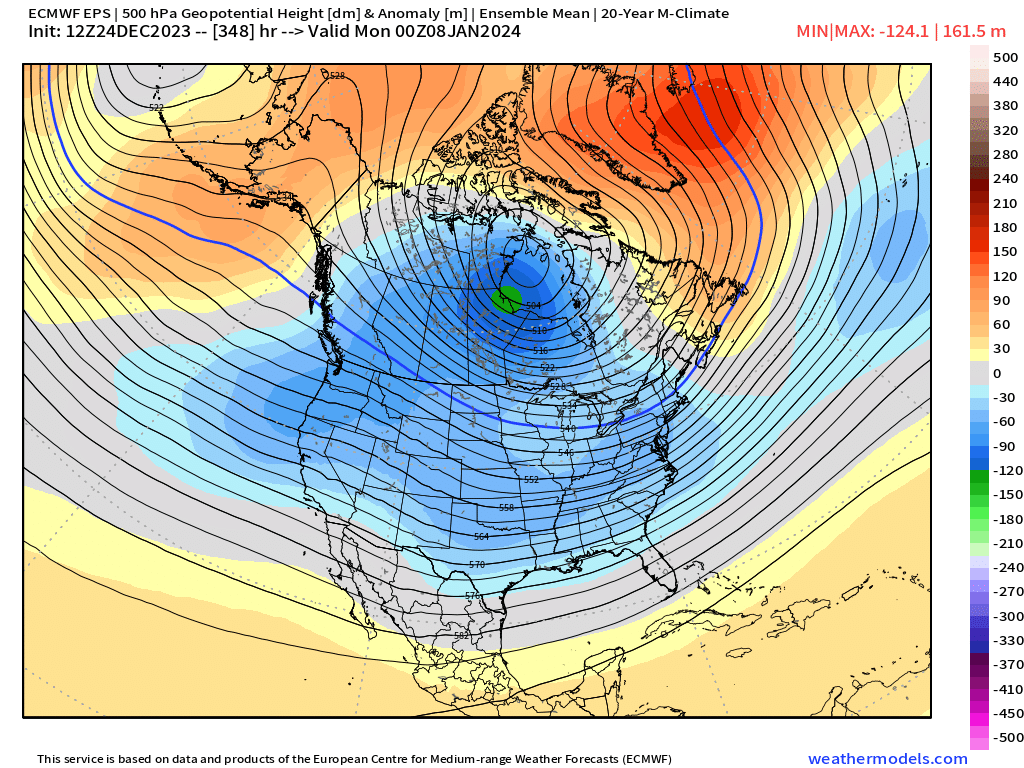
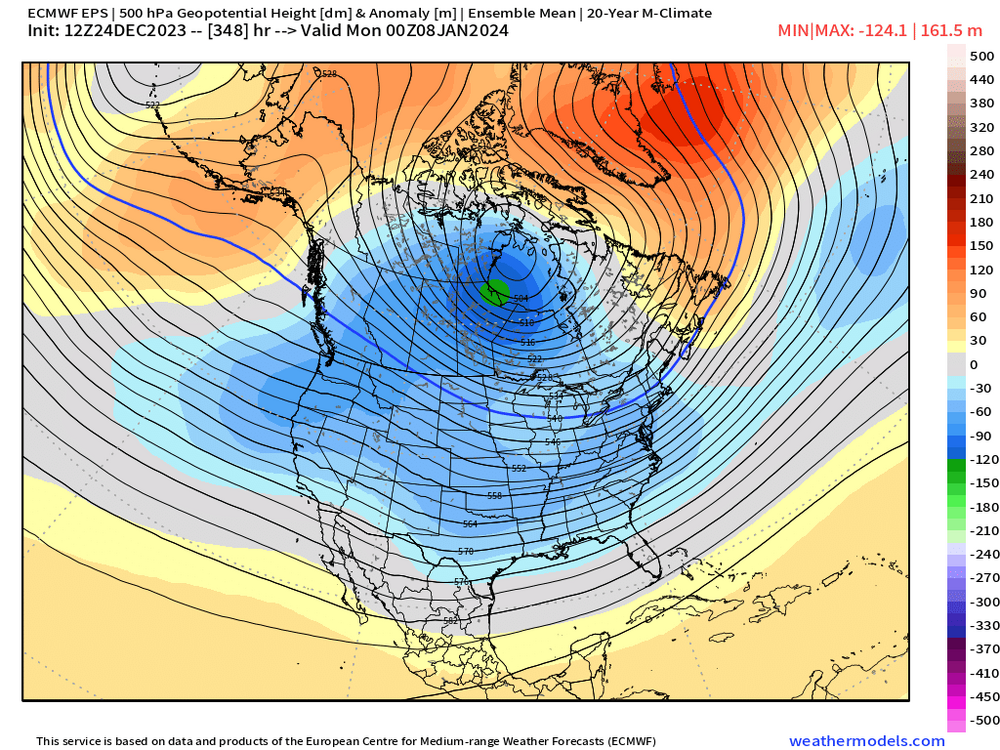
That almost looks like a favorable Niña pattern at the end. You have a stout AK/Aleutian ridge with a -NAO and a PV down in Hudson Bay.
-
Ukie and GFS both trying to get some accumulating snow into southern zones. Really close there. Nice feed of colder 925 temps pulled into the secondary.
-
Weeklies have been showing a lot of NAO blocking trying to develop during that time the last couple runs….caveats of course on that lead time but it does match what we’d expect after an early January SSW. Im hoping we can bridge the early January pattern to the developing -AO without much of a relaxation in between.
-
Yeah a lot of times there’s hype about them and they don’t occur but this one is looking pretty likely to occur. Yeah I’m not as worried about the cold aspect in an El Niño because we don’t typically have to deal with a SE ridge like in La Niña. So even if the “bulk of the cold” goes into Europe or somewhere else, you’re still talking a -AO pattern in an El Niño with low SE heights….that’s powderkeg for big storms. I don’t need blizzard at 10F with ball-shriveling cold for a week afterwards…a pattern with lots of highs in the 20s/30s is just fine with me which isn’t far off from peak winter climo as it is.
-
Yes it would still be useful even if PV goes to other side because it promotes a -AO. When you have that in an El Niño, your chances for big storms drastically increase. As always, no guarantees it works out but also as always, you want as many variables in your favor as possible.
-
All ensemble guidance is calling for an SSW with a split of the SPV by Jan 5-6.
-
That’s a very strong cross-guidance signal for a split for 10+ days out. Impressive to see the convergence on the different ensemble suites.
-
I would have at least given out extra credit points if he said that pattern wouldn’t work in 2023 but instead he just tried to gaslight everyone and say the weeklies were further south than the ‘83 map even though both of them are right in front of us to see. Jan 1958 also had a similar look. What’s funny about Jan ‘58 is even though it was a pretty snowy month (esp interior), there was a storm late that month which was a perfect benchmark track that was mostly rain. Imagine what the discourse would be in here this season if a late January storm in an El Niño produced a mostly rain event on an ideal track….
-
That’s not even a bad pattern. It’s quite reminiscent of the first half of Feb ‘83.
-
This happens every winter…everyone looks for the KU cookbook pattern and when it doesn’t show up, there’s some incredibly awful analysis about snow chances…particularly in New England. I understand the margin for error is a lot lower down in the Mid-Atlantic.
-
Yeah it wasn’t blizzard here. Just a heavy snowfall and a great event. Winds were ok, but nothing out of the ordinary. Jan 2022 had exceptional winds.
-
Lot of triggered snowflakes in here the past 18+ months. Don’t worry, for some it’ll make them stronger…for others, they just wilt under the pressure of not getting KUs every year.
-
EPS was pretty darned cold for us. Def colder than OP GFS. Regardless, whenever you see cold anomalies just to our south in that NYC-DCA corridor, that usually means we’re plenty cold enough to snow even if we are near avg or slightly above like on that 06z GFS run. Sitting in that -5 to -8C range of 850 temps. Hopefully we can actually get one of the shortwaves to pop a nice system for us. The really active look is something I like a lot…it will make model watching relevant since any one of them could show up as a storm all of the sudden when we get closer.
-
Yep....can't rule out something pre-New Years either even on the EPS....not a high probability but some memebers are trying to form something with that rotating ULL. But beyond that longshot, I think we'll have some chances in early January.
-
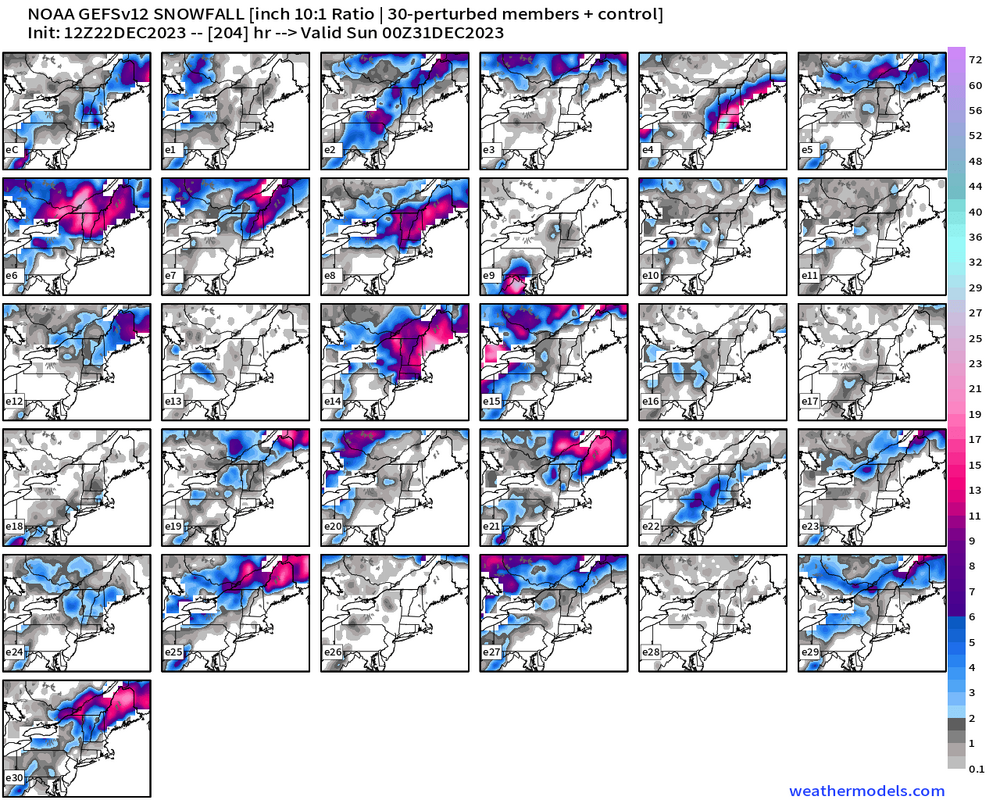
There are some interesting GEFS members in there too
-
Canadian is trying to redevelop another low when the ULL goes south on 12/30
-
Almost unreadable....the funny thing is I don't think Decembers like 2011 or 2015 ever got close to this awful on the posting level. Maybe we were just deleting more stuff back then, but I don't really recall having to do that.
-
He went from one extreme to the other....
-
Whats funny is that 1969 has continually showed up as an objective analog on the ensembles. That year did have a huge turnaround that started with the Xmas night storm (though it wasn't good for a chunk of Maine because they got warm sectored)
-
Well in the late 1980s/early 1990s during my formative snow weenie years, all we had was shitty 2-4/3-6 events....no biggies. But what you need for those types of events is an active northern stream in conjunction with a western ridge and that type of pattern has been largely absent since 2015....we've had a lot of western troughiness. We did have a bunch of smaller clipper events in 2018-19 winter, but that was kind of an outlier amidst the larger boom or bust type winters of 2020-21 oe even 2017-18.
-
We get coywolves all the time here...they can get loud at times. Esp if they are attacking something then it sounds really eerie.