ORH_wxman
-
Posts
93,094 -
Joined
-
Last visited
Content Type
Profiles
Blogs
Forums
American Weather
Media Demo
Store
Gallery
Everything posted by ORH_wxman
-
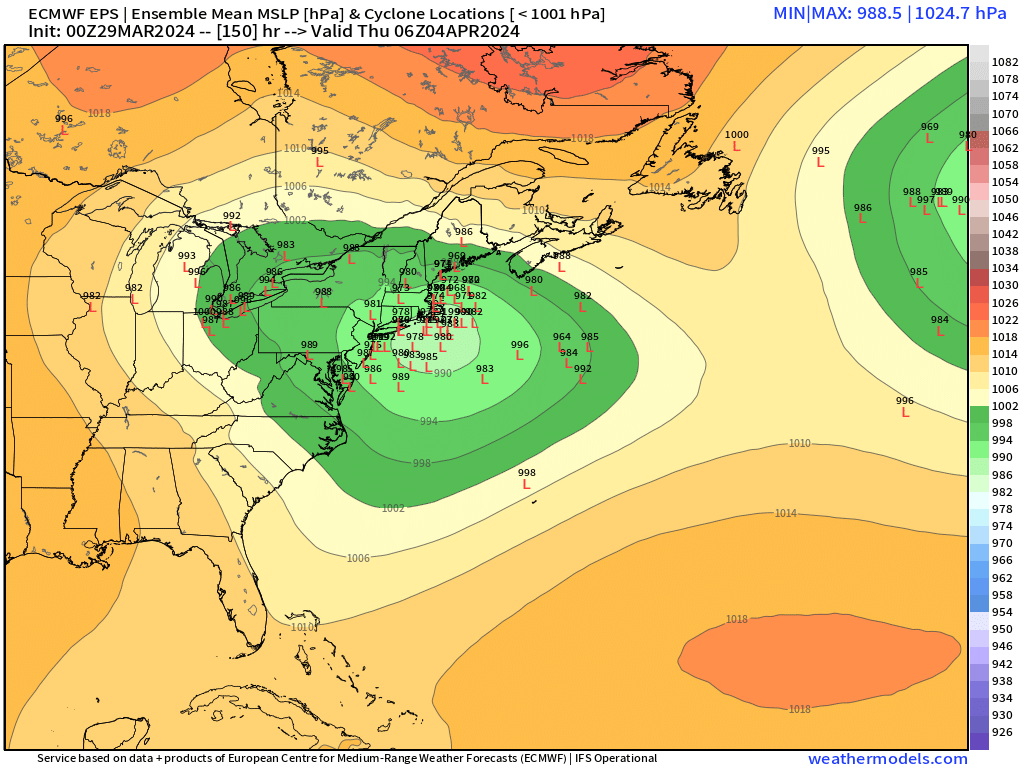
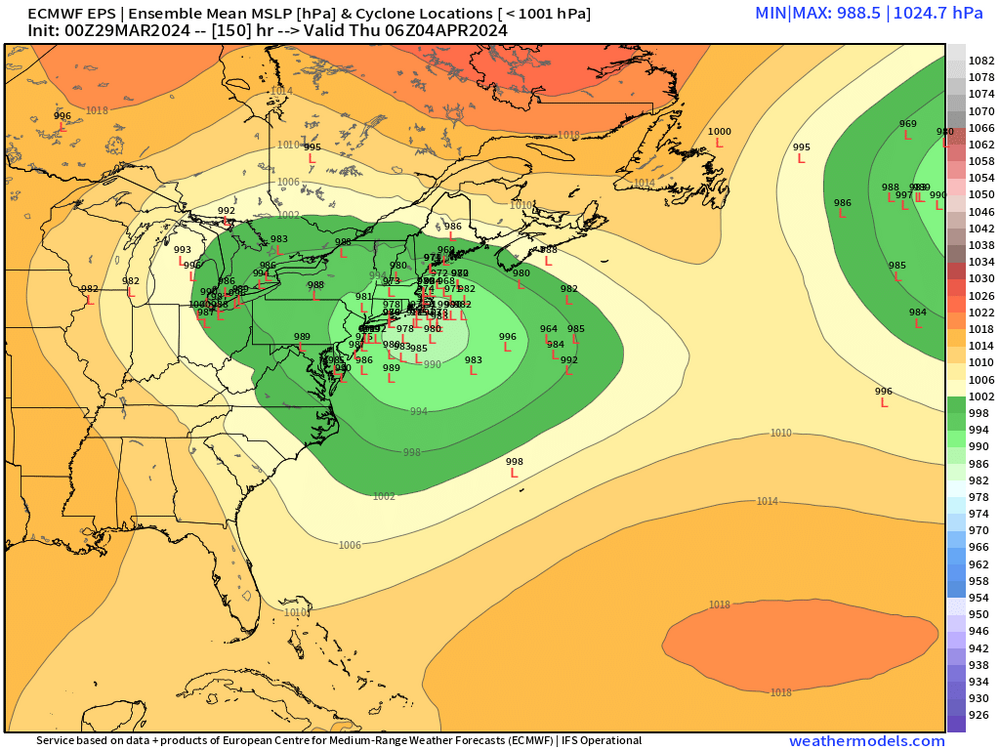
Significant Miller B Nor'easter watch, Apr 3rd-4th
ORH_wxman replied to Typhoon Tip's topic in New England
We’d all be worried if the Ukie was jackpotting us at this range. -
Lol…maybe if it’s still showing big snow on Saturday or easter we can take it seriously.
-
Tamarack might not see the ground until May at this rate.
-
Reggie ain't biting for Friday.
-
Yeah it's not an isothermal look on the NAM....it's a decent lapse rate from the surface to 850. IF you actually verify that, then latent cooling is going to take the sfc to near-freezing fairly easily if you have any sort of heavy rates.
-
Well the NAM is one way to get a blue bomb.
-
Still needs a lot of work....you want to see legit rates in this thermal profile. There's a scenario where the low pressure develops along the front and gives us decent precip on Friday in the CCB, but it remains mostly rain because it steady light/moderate precip and not good rates. 06z NAM kind of showed this...decent precip in the CCB but mostly rain with just some sloppy snow over the hills...maybe an inch or two in a scenario like that but also could just be white rain.
-
Yeah that was a huge shift from even 06z.

-
It's also 2.5 weeks deeper into March than the Mar 2018 big dog which was Mar 12-13. That matters a lot climatologically.
-
Individual i took it as
-
EPS looked decently mild by 4/9.....but then again, the EPS has been utterly horrific this cold season, so taken with a grain of salt for now.
-
The other explanation is that the warmer waters didn't really have as much to do with it as hypothesized. Might be some other important factor or factors.
-
Ukie has the snow on Friday too in SNE. Looks pretty marginal in the lowest levels in the CP, but if guidance is going to try and spit out good hourly rates, then it will be worth watching. Certainly over the interior hills it is becoming a threat. The pattern we were hoping for in February now looks to be happening in late March and early April.
-
I think we only cracked freezing twice in January 2009....sneaky frigid month. Never hit 40F. Throw in 25" of snow from multiple events (in addition to the late December snows) and it was quite a stretch. Pack got pretty deep but not like 2011, 2013, or 2015 levels.
-
The Congrats Dendrite Deck Destroyer 3/23-3/25 obs discussion
ORH_wxman replied to Ginx snewx's topic in New England
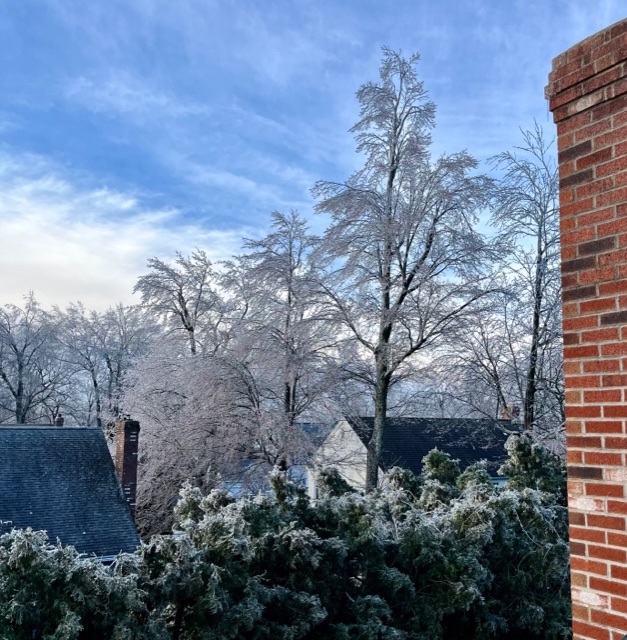
Still iced up this morning on winter hill in ORH. There’s basically zero ice about 300 feet lower.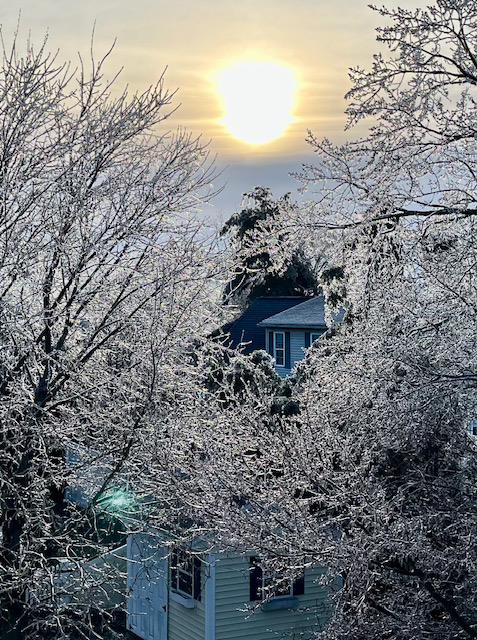
-
The Congrats Dendrite Deck Destroyer 3/23-3/25 obs discussion
ORH_wxman replied to Ginx snewx's topic in New England
Don’t think the dewpoint drain is quite there for a huge ice storm, but it’s getting mildly interesting with already over a quarter inch of glaze on winter hill in ORH.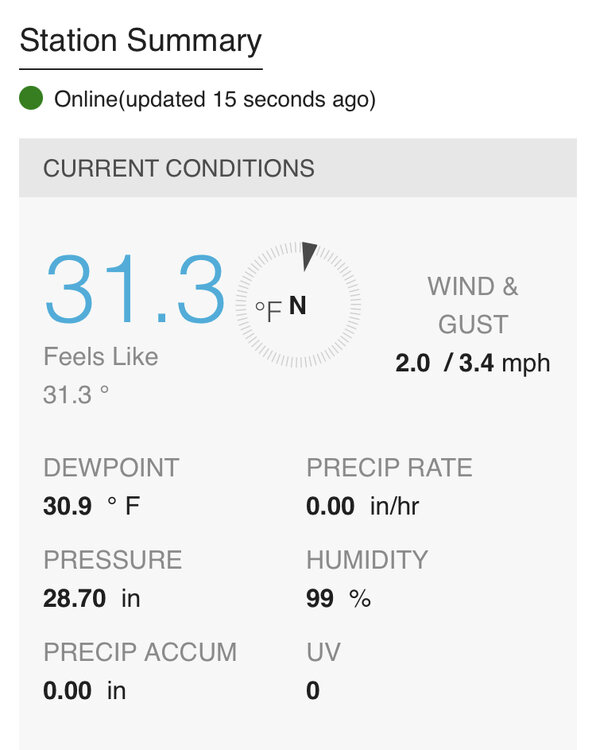
-
The Congrats Dendrite Deck Destroyer 3/23-3/25 obs discussion
ORH_wxman replied to Ginx snewx's topic in New England
Still glazed on winter hill. Temp has actually ticked down a few tenths the last hour to 31.4F from a high of 32.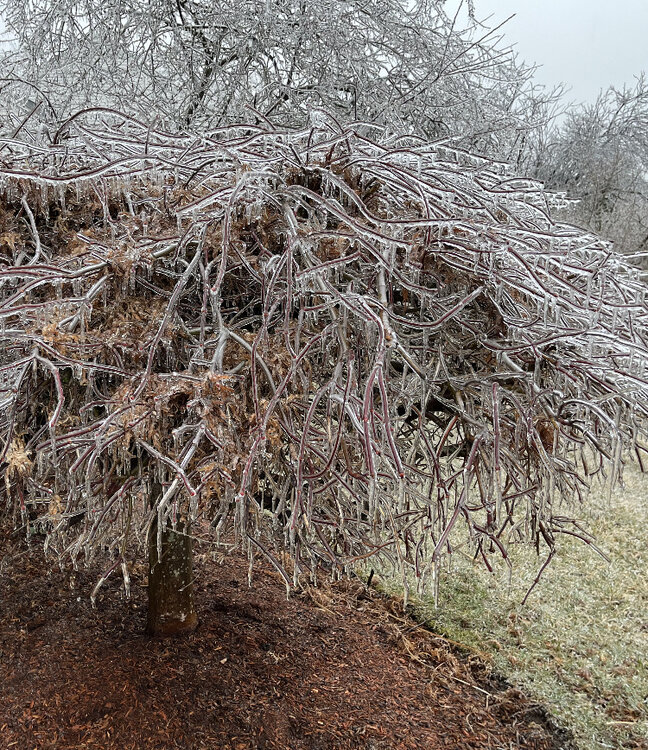
-
The Congrats Dendrite Deck Destroyer 3/23-3/25 obs discussion
ORH_wxman replied to Ginx snewx's topic in New England
Still a lot to glazing on winter hill. Temp 31.5F. Prob breaking even with sun angle right now but def accretion between about 8am and noon.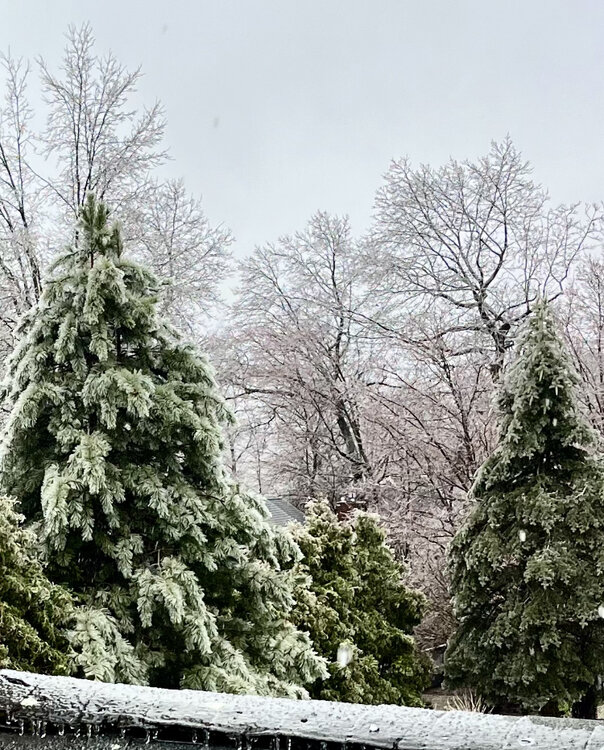
-
The Congrats Dendrite Deck Destroyer 3/23-3/25 obs discussion
ORH_wxman replied to Ginx snewx's topic in New England
Pretty solid icing on winter hill right now.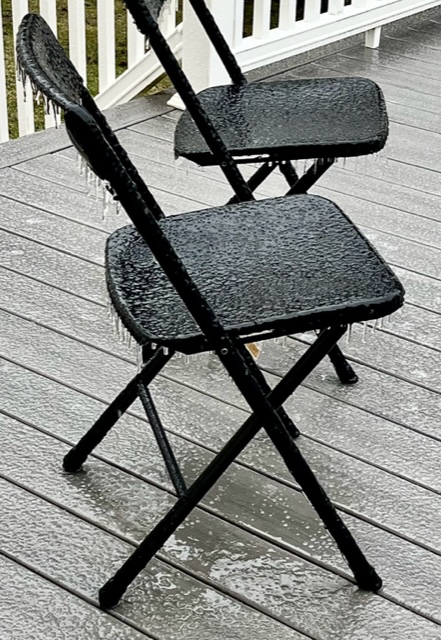
- 832 replies
-
- 10
-

-
Yeah this was super close to being a nuke....but just enough northern stream nuances to screw it up again.
-
Mixing with snow here now with a little elevation in NW Holliston. Big catpaw type mangled flakes clearly visible in the spotlight out back when there was nothing about 5-10 min ago. Too bad it isn’t going to last a few more hours. We would’ve pulled some accumulation. It’ll prob end just as it changes over completely.
-
Sensible wx is what most people care about at the end of the day. It’s like how in mid-winter, you can have a day where ORH is like 30/24 with spitting light snow. That day maybe ends up as +3. But nobody normal would actually consider that an above normal temp day. Esp since it was all driven by the min temps. It’s even worse imho in early spring like right now. You can have a 42/37 day with drizzle which is positive departures but nobody gives a fook that the low was 37 instead of 28. They consider that cold and miserable.
-
I love how in the movie, Morgan Freeman’s character, “Red”, is narrating how May is “one fine month to be outdoors in New England”. Every time I’ve seen that in the past couple decades, I always tell myself, “good thing they were too early to experience May 2005”.
-
Honestly, stay out of the thread if you aren’t going to contribute anything of substance and just continue to troll. I’ll help you out if you don’t want to do it voluntarily.
- 480 replies
-
- 14
-

-

-
-
This has actually been telegraphed pretty well. Second week of March and beyond kept showing up as blocky. Unfortunately there’s not a ton of cold on that look so we prob gets lots of cold rain or slop threats. But a real system wouldn’t surprise me either if you get everything to line up.