ORH_wxman
-
Posts
90,892 -
Joined
-
Last visited
Content Type
Profiles
Blogs
Forums
American Weather
Media Demo
Store
Gallery
Everything posted by ORH_wxman
-
Almost no chance of getting another La Nina with a subsurface that looks like this
-
The area of record-breaking snowfall is crazy out there...it's not just isolated areas....it's basically everyone in a 300,000-400,000 mile sq mile area that is seeing record or near-record snows.
-
Flagstaff actually has 159.9" so far this season. Already 5th highest on record....decent chance for them to get 3rd place as they only need 7.2" for that....if they can get 17.3" more, then they'll get second place. First place is a much tougher task needing 50.2" to break that.
-
Is that the old Salamander cutoff trail? Or is this a new trail that I haven’t seen before? (Haven’t skied WaWa in years)
-
Haven’t skied Shawnee peak yet. Or did they rename it to Pleasant Mt? We’re up there every summer though on Moose Pond. Love that area.
-
Looks really torched in the lowest levels. Same song as most of this season except even more pronounced this time. No good low level cold on ageo flow. That’s why the trailing wave was better…it actually had a little bit of cold to tap.
-
There’s a large housing shortage. That’s the biggest culprit on rents/shelter. We’ve become a pretty big NIMBY society…esp in more affluent areas. It’s not as bad here as it is in, say, California…but it’s important to not fall further into the red when it comes to housing unit supply. Super low mortgage rates have masked some of the price increases keeping monthly payments more affordable, but it’s hard to enter the market in the first place with those big down payments needed…and renters have really felt the pinch recently. With fewer new buyers entering the market than previously, you crowd the renting market more driving those prices up. Back in the day in the post-WWII middle 20th century , most households spent around 25% of their disposable income on food. 2021 ticked up from pre-Covid, but it was still only around 11%.
-
Your area was due for a localized jackpot relative to climo. It had been a while. Prob have to go back to a year like 2000-01. I guess you had a localized “jackpot” in 2019-20 too but everyone was BN that winter for snow. I was mentioning to that poster who moved to Clinton from ORH how many years recently that ORH had been getting a LOT more snow than places like FIT/Leominster/Clinton/Lancaster even though ORH probably barely averages more than them. This year was finally trying to even that out some and of course your area to Gardner/Princeton/Ashburnham cleaned up even more.
-
Todays system got a lot weaker as we got closer too. Some of those runs were giving 8-12” or even a little more in N NH and Maine.
-
Ensembles didn’t look very good either last night. Still some big hit members but a lot fewer than 12z or 18z. That lead wave is the main culprit.
-
Too detailed. Though SNE probably favored a little more on those looks. We’ll see what the real models say later. Ensembles are still the way to go right now.
-
Clown range NAM and RGEM are pretty intriguing at 00z. If globals can continue to trend as well, then I’ll starting getting more interested in this one.
-
That’s def a step by the GFS. Get that thing to curl up the east side of the longwave trough and we’ve got a legit storm.
-
Ha…that is literally probably the snowiest town in Massachusetts east of the Berkshires.
-
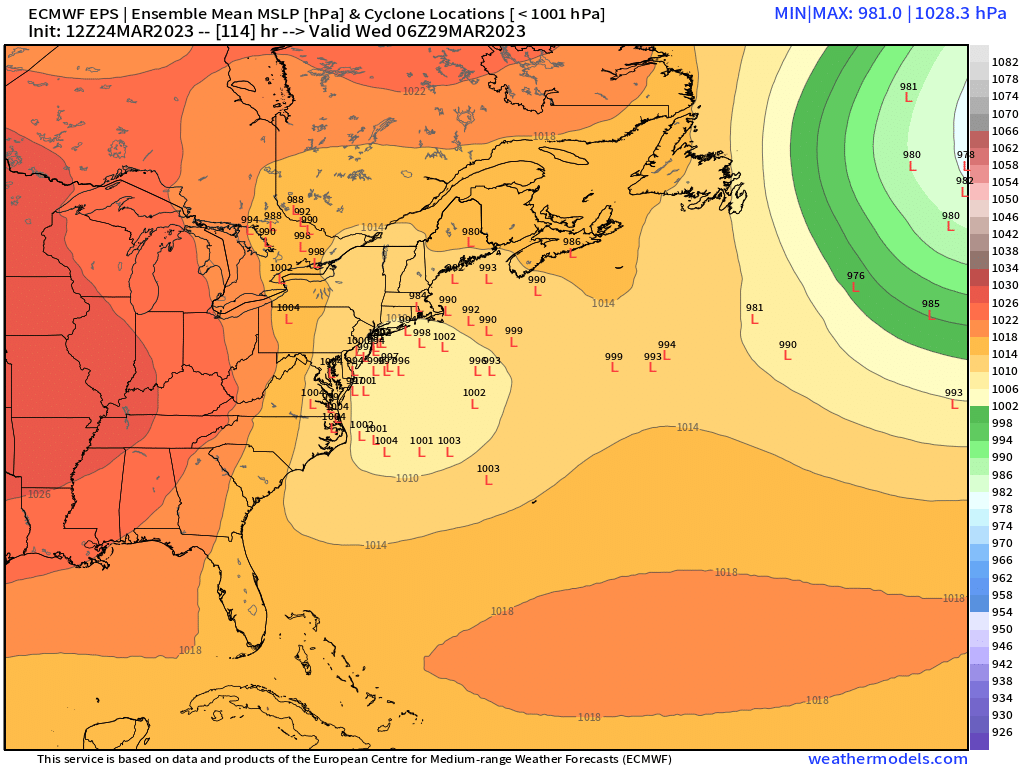
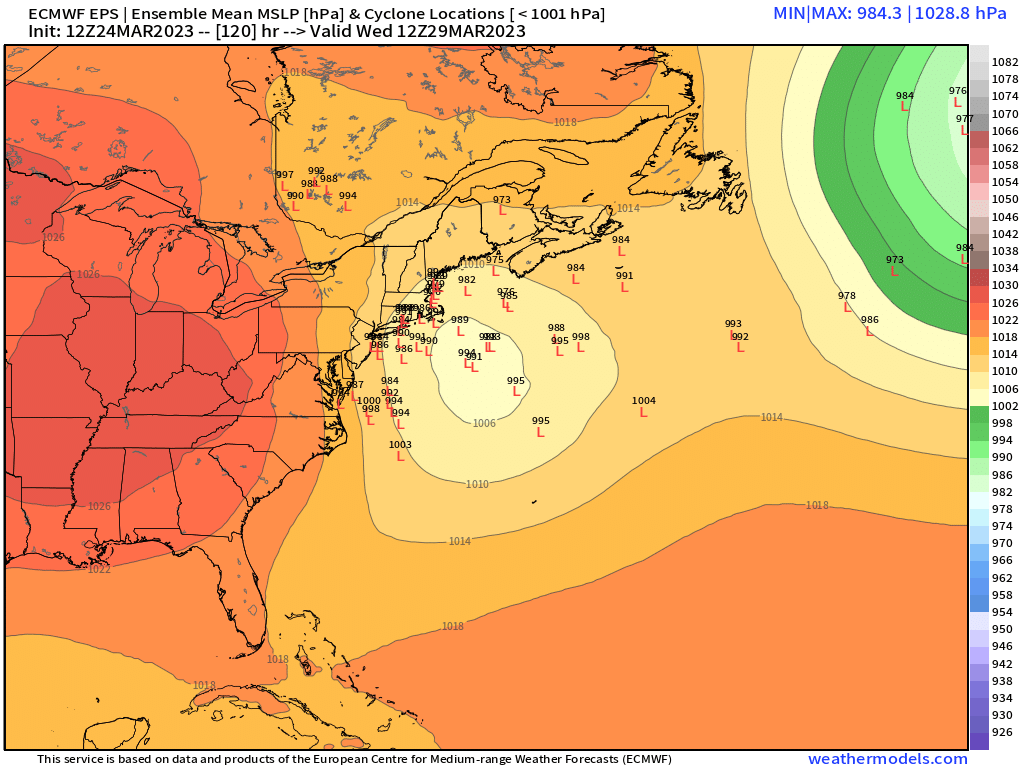
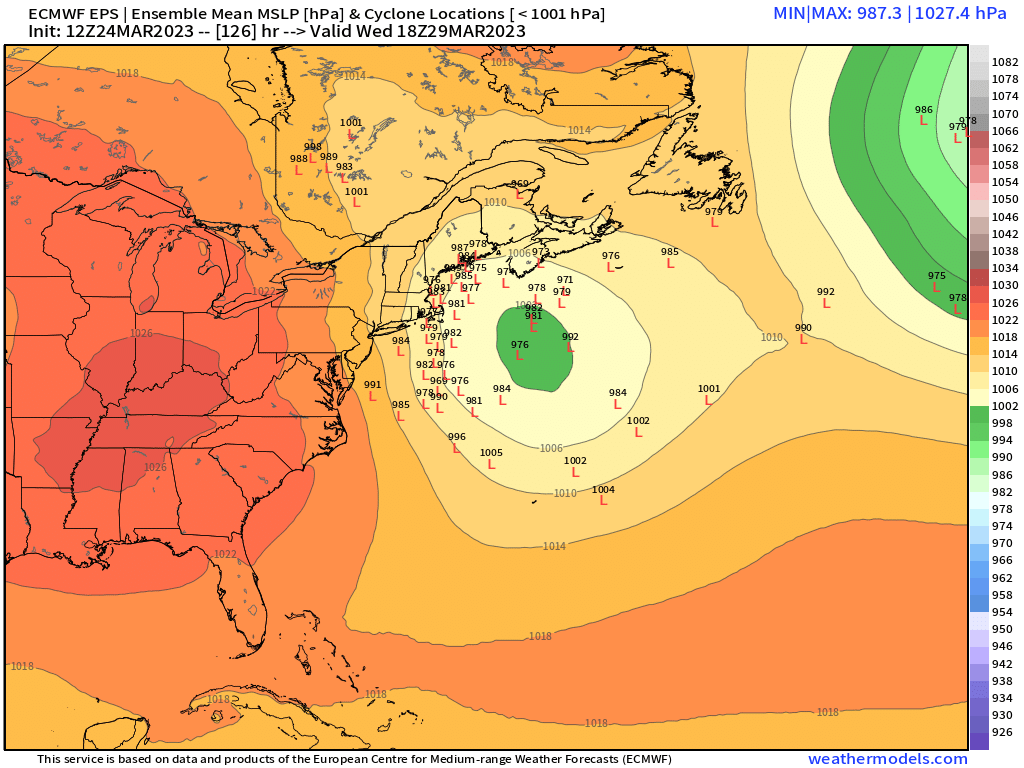
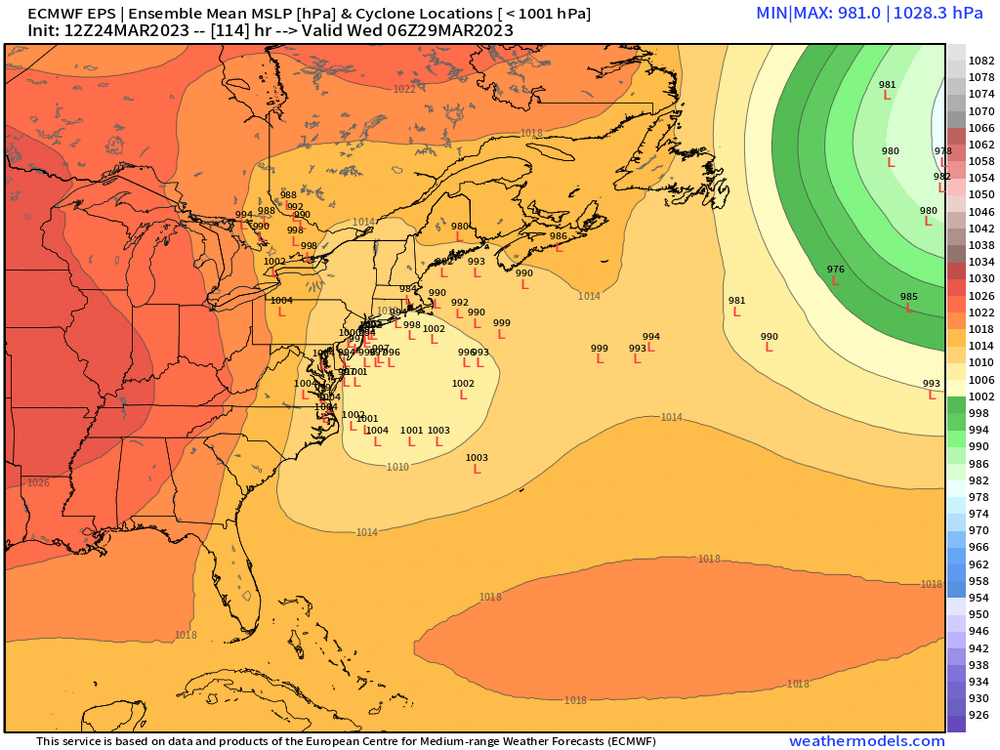
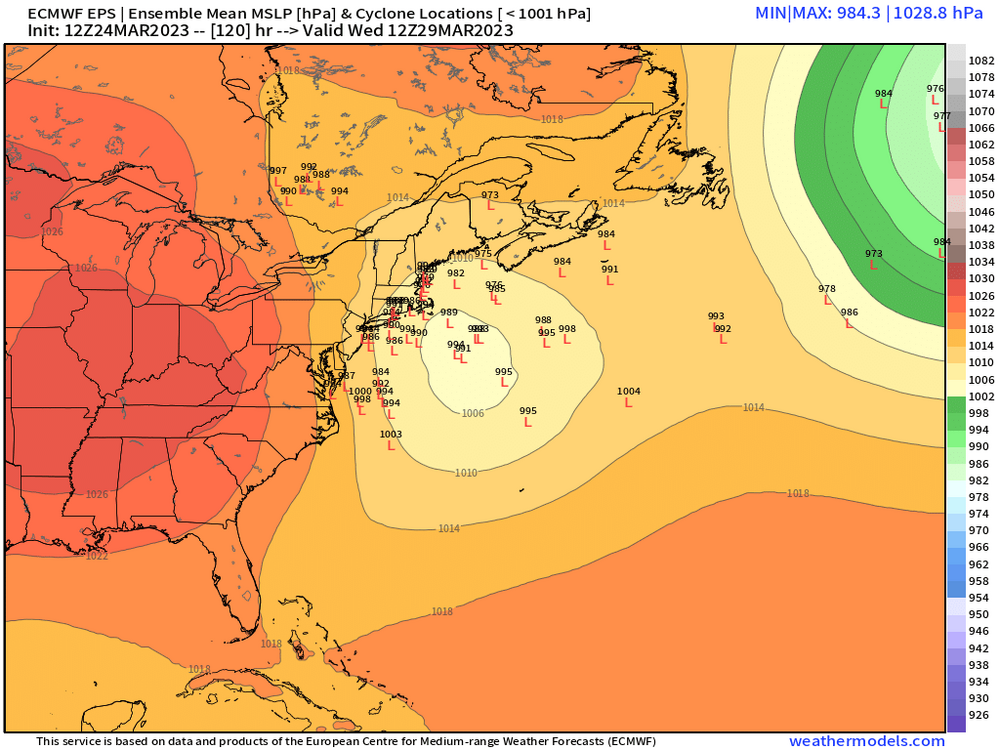
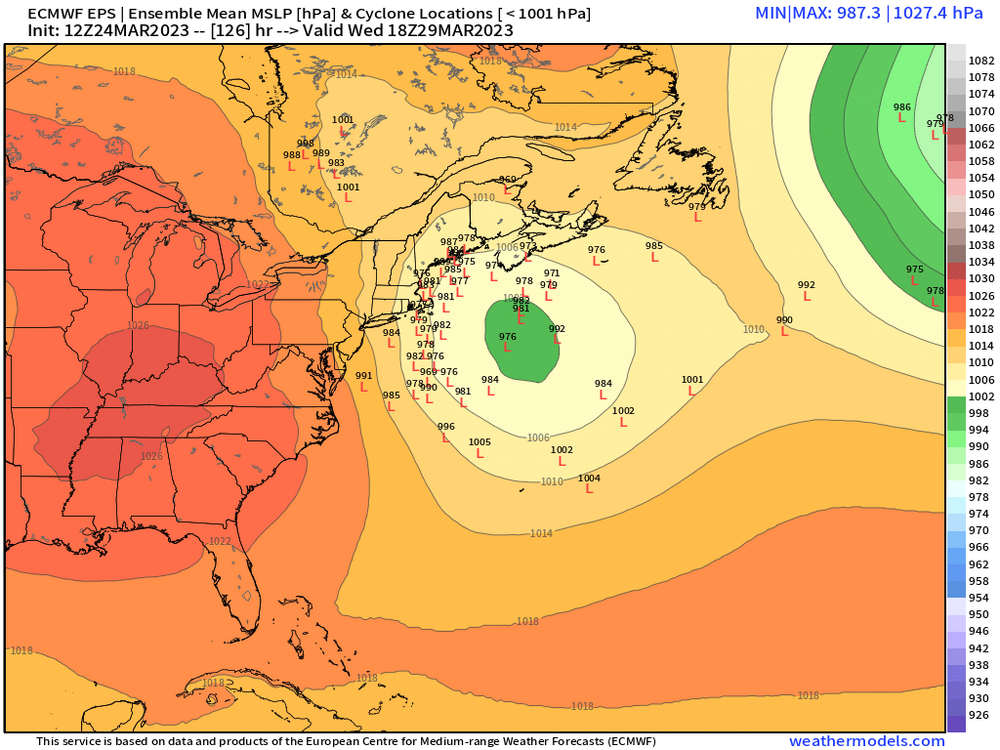
There's definitely some interest on the EPS
-
Really close there on the Euro....sharpen that s/w up just a smidge and you have a real event. We'll see what he ensembles look like in a few.
-
Monday night really…some models have it going well into Tuesday…I don’t think that one is all that interesting from a snow standpoint. Maybe a few sloppy inches for the hills but prob white rain or plain rain for many unless we see the intensity ramp up a bit more. The one behind it seems to have a little better look from a ageo flow standpoint if we can bring it back.
-
I'm surprised the mean that is robust....OP was pretty much nothing (had the front runner wave, but didn't amplify the one behind it)
-
Ukie isn't as interested in making the second shortwave the main player...tries to do the front runner wave.
-
Model skill does start to decrease as the PJ weakens and lifts north. March is a little early for that though....maybe late March there's a slight degradation, but I wouldn't expect model guidance to be noticeably worse than a month ago.
-
Yeah, pointing out inconsistencies in attribution studies is being a denier. So which one is it....CC causing -NAO or +NAO....you got the answer, right?
-
Theyve been the same since I first found them in the late 1990s too. I'm amazed they still even exist in that hideous capacity.
-
Funny, I saw the 84h RGEM and was thinking "GGEM is prob gonna be interesting"....and sure enough.
-
Yeah if we're talking butterfly effects....then you can attribute CC to everything, since we're in a world with that influence. There no world without at the moment. But the true value of attribution studies is the "net effect". One reason I like to stick to the truly empirical studies is you can actually measure some of this stuff more confidently rather than trying to fix too much of it into a model which will always have some levels of assumptions. You still need models even on empirical attribution studies, but you try and use as much real data as possible. Temperature is probably the bets example....we have a TON of temperature data so we're pretty confident on a lot of the temperature changes. But other things with lower sample sizes shorter periods of record can get really dicey very quick. There's a model for everything....in the 1997-2002 period, we saw a lot of studies that said CC was helping make the NAO more positive having come off a recent 2 decade binge of positive NAO winters. Of course, fast forward 10-15 years to the early/mid 2010s after that binge of excessive -NAO/AO winters between 2009-2013 and so many of the NAO/CC studies started claiming the opposite....that reduced sea ice and arctic amplification was actually causing the NAO/AO to become more negative. We don't hear about those studies much anymore after the binge of +NAO winters again post-2013 (and prior to this season). We saw similar papers come out that you mentioned about the "pacific warm blob" causing the big +PNA ridges out west in the 2013-2015 years.....now in the past few seasons we can't stop talking about troughs slamming into Cabo San Lucas. I'm sure CC is involved in all of these things, but the net effect isn't confident so when I read claims like "CC making negative NAO winters more/less likely", I tend to mostly roll my eyes since so many of those things are based on shorter samples and lots of models with assumptions in there. Sometimes, the headlines don't really match the paper either...you'll read that headline and then the paper has this really weak correlation where they state a lot of uncertainty and I'm thinking "how did that headline get written based on that paper?".
-
I remember way before the insane CC debates trying to attribute 7 year trends to it, we used to discuss back in college how inflated the 1951-1980 or 1961-1990 snowfall normals were compared to 1971-2000 (after those came out while in the middle of college)....and whether 1971-2000 was a sign of decreasing snow or just a really shitty period because it had the brutal 1980s but didn't have a prolific decade in it anymore like the 1960s. It turned out that it just happened to be a shitty period in the 30 year record....as we quickly returned to larger snowfall winters. No guarantee that always happens, but it was am interesting conversation at the time which parallels some of the discourse on here.