ORH_wxman
-
Posts
90,892 -
Joined
-
Last visited
Content Type
Profiles
Blogs
Forums
American Weather
Media Demo
Store
Gallery
Everything posted by ORH_wxman
-
Global Average Temperature and the Propagation of Uncertainty
ORH_wxman replied to bdgwx's topic in Climate Change
Boston has two storms that are similar too....they had 19.8" in the 3/3/60 storm and 19.4" in the 2/16/58 storm. -
57-58?
-
Global Average Temperature and the Propagation of Uncertainty
ORH_wxman replied to bdgwx's topic in Climate Change
You are correct...I double counted 2003 for some reason. -
If we're lucky, we'll break into some clearing in the afternoon....but right now, looks pretty rainy in morning and then again when the front comes through later in evening.
-
That area typically has a very early onset of winter too....it's not like here where big November snows are rare....they usually enter December with already deep snow pack. This year has been pretty ridiculous though...I noticed they have a 62 inch pack currently.
-
Global Average Temperature and the Propagation of Uncertainty
ORH_wxman replied to bdgwx's topic in Climate Change
Pretty sure BWI And BOS both have 10 storms of 20"+. Baltimore used to have more but Boston caught up with 4 in the last 10 years to Baltimore's 1. -
Strong Nino is fine....you just don't want a Super Nino.
-
Flash freeze potential in the hills especially. The squall line will need to maintain strength for that to be a risk, but there’s a realistic chance it does.
-
Yes. It was very recent when the 2005-2010 data disappeared for BDL. I remember looking at it within the last year and it was all there. Only the ASOS outage years from like 1996-2002 were missing. Really bizarre and not sure why it’s gone. Your numbers look correct…I remember some of them from when I made maps now that I see them.
-
I have no idea why they don’t have 2005-2010 data at BDL. NWS site doesn’t have it either. They definitely reported snowfall during that time. They just keep showing up as a bunch of traces. I should have all 5 seasons though because I made snow maps during that time and kept data. I’ll just have to wait until I’m back on my home computer to check. I’ll post them here when I get the chance.
-
He can access the threaded data here: https://xmacis.rcc-acis.org The climod2 site doesn’t thread the data so it will break off when a site like BDL moved from Hartford to Windsor Locks CT, but the xmacis site threads it all together.
-
We’ve discussed this before…but the question for that hypothesis is “how does CC change the laws of thermodynamics and atmospheric dynamics?” The short answer is…”they don’t”. CC doesn’t all of the sudden mean PV = nRT is no longer true. It just means our T is higher. Same with other equations. Models are simply running these equations based on data input. The data being input is real time data so it should already account for the current conditions of 2023. If we input a bunch of data from 1970, you’d get a colder look but still a forecast that resembles what happened back then. Now if you’re running a climate model, you’d want to account for more CO2 each year since that will affect warming once you go out far enough. But this won’t be relevant on an operational short or medium range model. Whatever minuscule CO2 increase happens over the course of a 15 day OP run is not enough to cause meaningful temperature change. Older/Obsolete models used to have trouble with dynamical/latent cooling which is why we likely saw more positive snow busts when they thought it would be +1C aloft…now, models have gotten a lot more skilled (a lot more vertical layers are present in models now too which will catch pockets of higher lift that potentially could have been missed by their primitive predecessors), and when they say it will be +1C aloft, they are closer to correct since they are better at already accounting for dynamical and latent cooling than older versions of models.
-
That was the event that gave BOS their new record, right? I remember that one. Temps just plummeted midday in that band.
-
GFS definitely has a cold bias…esp since the upgrade. Euro is still mostly king I feel like when we’re really close in on BL temps and things like that. NAM is pretty good too once inside of 36h.
-
No it’s is July 1st to June 30th
-
Model guidance used to have a much bigger warm bias in the boundary layer too on storm systems. They’ve improved quite a bit to where that bias is almost gone. There are still some CAD scenarios where you take the under but on a generic wetbulb situation, they are not really biased warm these days.
-
Global Average Temperature and the Propagation of Uncertainty
ORH_wxman replied to bdgwx's topic in Climate Change
Another factor the complicates these types of questions of projecting future snowfall trends is regional temperature variability. Like if we did an analysis on the warming from, say, 1970-2000, we would’ve seen a bullseye of warming over the northern plains with a cooling trend in SE Canada…you do the same analysis from 1995ish until now, you get a cooling trend in the same northern plains spot while SE Canada has the highest warming (and within the US border the highest warming is the northeast in that time frame). -
Global Average Temperature and the Propagation of Uncertainty
ORH_wxman replied to bdgwx's topic in Climate Change
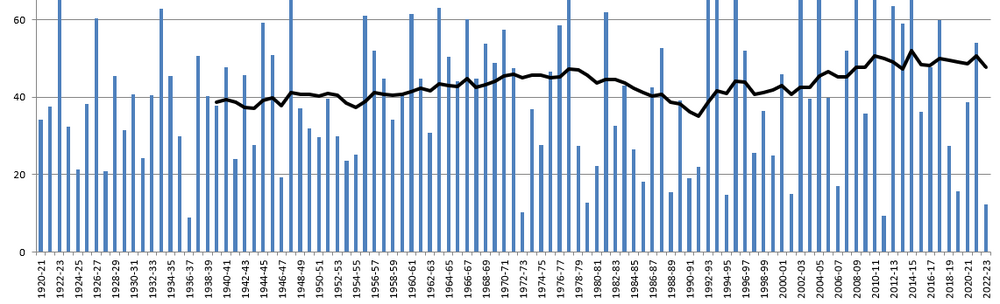
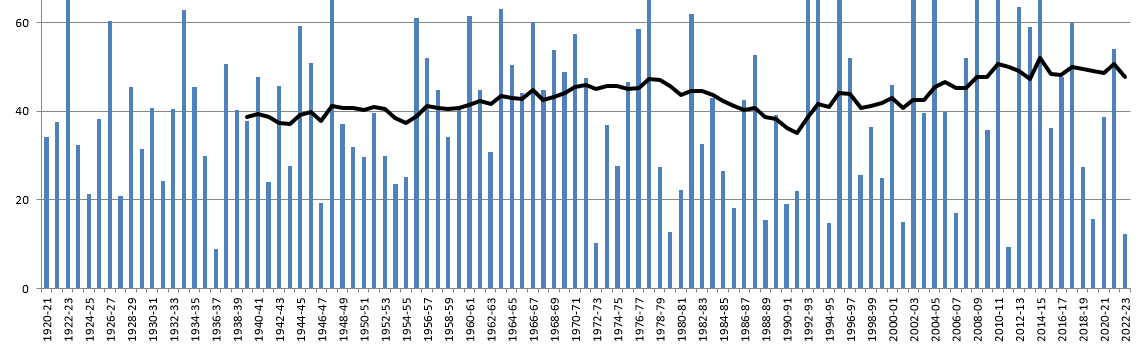
Yeah that is a brutal dip even in the 20 year average. -
Global Average Temperature and the Propagation of Uncertainty
ORH_wxman replied to bdgwx's topic in Climate Change
I think if you theoretically ran it out like 50-100 years you could maybe do 8 year chunks to try and compare….but at that point, you might as well just use rolling 30 year normals. -
Global Average Temperature and the Propagation of Uncertainty
ORH_wxman replied to bdgwx's topic in Climate Change
But you’re going to use the 2007-2015 period as baseline to try and pick out when an “inflection” happened (supposedly 2015 in your original hypothesis) due to warming and then using future 8 year chunks to measure against it….I originally objected due to how short such a period is. We could’ve done the same exercise in the 1960s/1970s and then determined 2 decades later that we reached an “inflection point” because we couldn’t match the snowiest 8 year period from then…and we would have been wrong…because 8 years is obscenely short to try and figure out climate trends. I don’t think you can use rolling 8 year chunks to figure it out. You need something way longer. -
Global Average Temperature and the Propagation of Uncertainty
ORH_wxman replied to bdgwx's topic in Climate Change
How do you know the 2007-2015 peak was due to warming and not other factors? That’s the whole problem with the exercise. When you use such short periods to try and figure out if warming caused some sort of a tend, you inherently introduce massive natural variability into the equation. -
Yes ENSO is a weak correlation for New England snowfall....I did not specify what it was in my post....I was merely responding to which one has produced the best results for us and that answer is undeniably weak El Nino. I'd definitely not bank on ENSO alone. IF you filter it for Modoki El Nino though, then it becomes more prolific.
-
Yeah it was during the super nino of 1972-73 when Flagstaff got their unicorn 200"+ season. They had 77.4" in the month of March 1973 alone. This winter was fairly prolific in every month but January's 61.4" carried the most weight....3rd snowiest January on record for them.
-
New England has typically done the best in weak Nino, but moderate to low end strong has produce plenty of good to great seasons too ('57-'58, '63-'64, '65-'66, '68-'69, '86-'87, '02-'03)
-
Global Average Temperature and the Propagation of Uncertainty
ORH_wxman replied to bdgwx's topic in Climate Change
You'll need a lot longer than 10 more years to figure out snowfall climo. BOS average of nearly 60 inches between 2007-2015 is a ridiculous baseline to measure against as it is. The 36.5" mean since 2015-16 is a lot closer to their longterm snowfall climo than the 59.5" mean from 2007-2015. BOS moving 20 year average...even that doesn't tell you much on the 20 year level.