

ORH_wxman
-
Posts
90,892 -
Joined
-
Last visited
Content Type
Profiles
Blogs
Forums
American Weather
Media Demo
Store
Gallery
Everything posted by ORH_wxman
-
It’s not going to be a weak Nino and probably not moderate either. Im leaning toward a strong Nino at the moment but short of “Super Nino” in the ‘82-83, ‘97-98, and ‘15-16 mold. Borderline cases like ‘72-73 and ‘65-66 are right in the mix though…and they are good PDO matches.
-
Yeah it prob does…esp if it is rapid, then the effects are non-linear. March is kind of weird though in that other factors start increasing in relevance too due to the strong increase in solar insolation compared to mid-winter. But if we’re focusing on the meat of the winter (mid Dec through mid/late February), ENSO stuff after new years is largely irrelevant. This is going to be an interesting evolution to follow though because of all the weird stuff going on as this Nino strengthens (the west-based forcing and the extremely negative PDO are two of the biggest unconventional factors so far)
-
I usually stop looking at ENSO in December. I suppose fast changes in January can still lead to a change in end-of-winter pattern ala late Feb into first half of March but the larger scale impacts mostly seem baked in by new years.
-
Update: On 7/10, NSIDC area stood at 6.11 million sq km, here’s where other years stood on the same date compared to 2023: 2022: +240k 2021: -240k 2020: -380k 2019: -580k 2018: +50k 2017: +220k 2016: -300k 2015: +150k 2014: +440k 2013: +260k 2012: -440k 2011: -40k 2010: -30k 2009: +470k 2008: +370k 2007: -110k
-
The forcing being way west all summer is definitely really weird compared to the Super Ninos....that and the PDO. I wonder if this one tops out more like 1.8 or something on the trimonthly ONI.
-
That band might dump like 2-3" in a short time...looking like it's heading right for my area
-
Ginxy Sultan Signal incoming
-
July has arrived ... the Meteorologically defined mid summer month
ORH_wxman replied to Typhoon Tip's topic in New England
Ugh...that's the worst. We take our kids every year but keep flexible....usually pick the nicest weekday during out of our vacation in adjacent western Maine to drive over and spend the day. Although maybe you can luck out where the rain is delayed a bit or more spotty....we had a day like that one year and the threat of scared off all the crowds, and we basically had the park with no lines or very short lines. It was great. -
July has arrived ... the Meteorologically defined mid summer month
ORH_wxman replied to Typhoon Tip's topic in New England
That's one reason I'm annoyed they haven't fixed the sensor there yet...it's always a great proxy to use for the type of airmass we are in. Like when ORH hits 90F, it's a pretty legit hot airmass....when they start going 93-94F, it's a "high end" heat wave. -
July has arrived ... the Meteorologically defined mid summer month
ORH_wxman replied to Typhoon Tip's topic in New England
Yeah they only average about 2-3 90F per year. Some years they fail to hit it (last occurrence in 2014....though 2015 almost pulled it off too until a September 90-burger) -
July has arrived ... the Meteorologically defined mid summer month
ORH_wxman replied to Typhoon Tip's topic in New England
ORH hit 90 on 4/14 and hasn't since...in reality they probably haven't hit it all since they are running about 2F too warm still. They might squeeze out another one today. But I want to see like 92F for it to be authentic. -
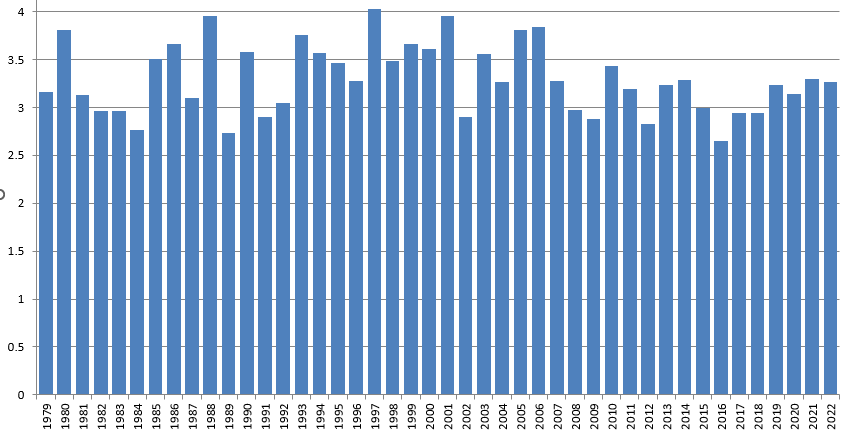
Official 2023 prediction on Arctic Sea Ice minimums: Area: 3.1 million sq km (+/- 300k)...this would rank 8th lowest Extent: 4.7 million sq km (+/- 500k)....this would rank 13th lowest This is based on years of using NSIDC area from the SSMI/S satellite which gets fooled by meltponding into thinking it's open water. This means that we can use NSIDC area as a proxy for meltponding and some of the most robust literature on predicting minimums in advance is using meltponding in May and June. I give more detail on my method here in last year's prediction, but didn't feel the need to repeat it every single year so I will just link it for those who are interested in how I make these predictions: I will include the graph I usually post, Keep in mind that this graph is not a graph of historical minimums....it is simply what 2023 minimum would be if we followed that previous year's melt rate AFTER July 1st. The reason this works fairly well is most of the decadal trend in ice loss has been due to increases in melting prior to July 1st, not after. But it gives us a nice distribution of possible results if we mirrored previous season's melt rate from post-July 1st.....from this graph, you can see that if we had a post-July 1st melt rate like 2016 (currently the biggest post-July 1st melt on record), then we'd end up with a minimum of 2.65 million sq km....that would still be over 400k above the record minimum in 2012 which is why we can rule out a new record this year. There just wasn't enough melting prior to July 1st to challenge the 2012 record. Likewise, you can see how even a higher retention post-July 1st would still produce a minimum below 4 million sq km....so it is safe to say that we will not have a 4 million sq km min for the first time since 2006. The distribution of this year's possible results looks quite mundane in the post-2007 context...and that is reflected in my predictions above.
-
July has arrived ... the Meteorologically defined mid summer month
ORH_wxman replied to Typhoon Tip's topic in New England
We got smoked earlier. Not sure how much but it had to be over an inch in under an hour. We’ll see if any of that stuff to the west holds together. -
Yeah the latest drop the past 2 days is going to put this more toward the middle of the pack in post-2007 than near the top retention years. I’ll have my official forecast out later today or tomorrow but I’m expecting a fairly mundane/boring season with no extreme results (high or low). But there’s always still the chance of a surprise.
-
For our forum https://wkevin.com/new_england_snow/
-
Update: On 6/29, NSIDC area was at 7.55 million sq km. This is lining up to be a higher retention year in the post-2007 context. Here's how other years compared at this point. I'll have my final forecast out in a day or two. 2022: -430k 2021: -390k 2020: -480k 2019: -710k 2018: +60k 2017: -120k 2016: -410k 2015: -20k 2014: -30k 2013: +130k 2012: -940k 2011: -460k 2010: -740k 2009: +480k 2008: +120k 2007: -610k
-
Trade winds don't look very favorable over the next few weeks. Things can change obviously later in July and August....but at the moment, I think something in the 1.6-1.9 range is more likely than low 2s.
-
Stronger Ninos are frequently boom or bust. But I’m feeling cautiously optimistic right now that we end up with something good. We’ll see what happens the next 4-6 weeks but it feels like a true super Nino is getting harder to obtain given the non-SST metrics right now. It will be hard to keep up with 1997 or 2015 I think over the next month. But ENSO is the ultimate humble pie…I’ve seen so many times where we were certain by mid or late summer and then it just didn’t do what we thought it was going to do.
-
The weird part is that the forcing has been consistently west so far despite the SST anomalies being skewed solidly east.
-
Update: On 6/25, NSIDC area was at 7.91 million sq km. Here's where other years compared at the same time: 2022: -110k 2021: -500k 2020: -570k 2019: -620k 2018: +80k 2017: -480k 2016: -570k 2015: -130k 2014: -60k 2013: +20k 2012: -800k 2011: -300k 2010: -910k 2009: +500k 2008: -230k 2007: -550k
-
Yeah south wind today which is one of the few directions they don’t downslope. So they shouldn’t be too much lower than surroundings like when it’s a N wind or any other wind with western component to it.
-
FIT airport is a downslope pit so they tend to run warmer on temps but colder on dewpoints with the adiabatic drying they get.
-
I'm surprised on '04-'05 but not surprised on '09-10 which occurred during a deeply negative PDO phase that had started with the back to back Ninas '07-'08 and '08-'09 and then continued right into the next couple Ninas of '10-'11 and '11-12. That PDO cycle didn't really break until 2014 IIRC when the weak El Nino started developing that summer.
-
Update: As of 6/22, NSIDC area was at 8.11 million sq km. Here's how other years looked compared to that on the same date: 2022: -20k 2021: -540k 2020: -450k 2019: -410k 2018: +330k 2017: Tied 2016: -500k 2015: +10k 2014: +50k 2013: +250k 2012: -670k 2011: -160k 2010: -500k 2009: +690k 2008: +30k 2007: -480k
-
I'm hoping we get a colder look to this Nino given the -PDO being somewhat stubborn.

