ORH_wxman
-
Posts
93,099 -
Joined
-
Last visited
Content Type
Profiles
Blogs
Forums
American Weather
Media Demo
Store
Gallery
Everything posted by ORH_wxman
-
December 2024 - Best look to an early December pattern in many a year!
ORH_wxman replied to FXWX's topic in New England
You can grab them straight from ecmwf.int site. Here’s weeks 4, 5, and 6 (week 4 is Dec 30-Jan 6 for reference)…obv we take with a grain of salt that far out right now
-
SNE GTG Banter Thread: Funky Murphy's 1pm 12/14
ORH_wxman replied to 40/70 Benchmark's topic in New England
Yeah maybe we do a January gtg. We’ve done January in several years in the past. For Clark’s I’d prob choose something the week of 12/16-12/20. Not sure I can make Monday 12/23 but that date is kind of nostalgic because 12/23/13 was the date of the original Clark’s GTG. -
December 2024 - Best look to an early December pattern in many a year!
ORH_wxman replied to FXWX's topic in New England
It’s weird seeing a snow event modeled below freezing. I’d like it if we could shift that south another 50-75 miles or so. Feel like we’d get in on the more prolonged isentropic lift. -
December 2024 - Best look to an early December pattern in many a year!
ORH_wxman replied to FXWX's topic in New England
Check the weeklies today for January “Keep your eyes shut MaryAnne! Don’t look at it” -
December 2024 - Best look to an early December pattern in many a year!
ORH_wxman replied to FXWX's topic in New England
EPS def looking decent by the end of the run....actually moved it up a little and the look got better. Similar to what the weeklies show leading into the week of Xmas....hopefully it's onto something. Even GEFS took a nice step today too. -
SNE GTG Banter Thread: Funky Murphy's 1pm 12/14
ORH_wxman replied to 40/70 Benchmark's topic in New England
Doubtful for me. Boys have youth basketball that day. -
December 2024 - Best look to an early December pattern in many a year!
ORH_wxman replied to FXWX's topic in New England
We will warm sector but it’s just a lot shorter than some of the previous solutions which had us like in a 48 hour warm sector. Now it’s more like 6-12 hours at least over interior. Longer on the coast locations. -
December 2024 - Best look to an early December pattern in many a year!
ORH_wxman replied to FXWX's topic in New England
Yeah it’s too bad we can’t shove that arctic boundary a bit further south behind the clipper on Sunday. If we could, that would introduce a lot more “interesting” look for the main event mid-week. It’s close but doesn’t quite really make it here…we are kind of left with the leading-edge polar airmass in place. Still cold enough for some marginal light frozen/freezing precip over interior but not enough to make the main show more interesting. It eventually gets bullied out. But the look is definitely more favorable for the snow economy up north. Wouldn’t be a total wipeout like some of those 60F cutter solutions we saw a few days ago. -
That’s pretty good for the first week of December. It’s not record breaking or anything but it’s def quite cold. Record low max for ORH today is 18F and tomorrow it’s 21F. They get much lower as you go into mid and late December but early December climo is still relatively mild. Avg high is still 40F at 1,000 foot ORH on Dec 6th. It falls to 33 by late month.
-
December 2024 - Best look to an early December pattern in many a year!
ORH_wxman replied to FXWX's topic in New England
That’s a very wedged look on GFS for Monday/Tuesday. Gonna have to watch for frozen/freezing precip over interior even if it’s light in that setup. -
December 2024 - Best look to an early December pattern in many a year!
ORH_wxman replied to FXWX's topic in New England
Actually gave about 3-5” for ORH up to your area Monday night. Not sure I buy that yet but the trend has def been wedgier with that. -
Why has BOX not updated the PNS since 1045am yesterday? That’s kind of weird.
-
December 2024 - Best look to an early December pattern in many a year!
ORH_wxman replied to FXWX's topic in New England
There were cracks in the armor starting before Jan 2022….being taken the to woodshed in Feb 1-2, 2021 really started the downhill trajectory. The blizzard in 2022 was a brief reprieve but then the spiral resumed. Lots of furniture broken and Scooter’s kids learning all sorts of new swear words. You hate to see it. -
December 2024 - Best look to an early December pattern in many a year!
ORH_wxman replied to FXWX's topic in New England
Every run seems to get more wedged. I’d be surprised if the interior even down to SNE doesn’t wedge for a long time. We might eventually warm sector but it could take a while. And up in the CAD capital from like CON to western Maine foothills, prob no warm sector at all…unless the trend reverse back to a much stronger sfc low west. -
December 2024 - Best look to an early December pattern in many a year!
ORH_wxman replied to FXWX's topic in New England
Looks more like C-1” to me. But if that one trends a little sharper then it could be a bit more. -
December 2024 - Best look to an early December pattern in many a year!
ORH_wxman replied to FXWX's topic in New England
I’d like to see a better push of the arctic airmass in the low levels for a larger scale icing threat. We don’t ever get back into the real cold after the clipper overnight Saturday night. But it’s not far away so if we trended things further south then it’s possible but I’m not sure how much more we can trend this inside of 4-5 days. -
December 2024 - Best look to an early December pattern in many a year!
ORH_wxman replied to FXWX's topic in New England
CNE/NNE might actually get a decent SWFE next week if that high keeps trending a bit. Think SNE might be too far south but maybe down to pike region could get a bit if things broke right. It’s obviously going to be a see-saw with the west coast troughs reestablishing itself each round between now and the next two weeks, but there’s also intervals of cold too so can’t rule out something timed well. Guidance has been actually semi-consistent with trying to rebuild the PNA ridge by the 20th or so. Hopefully I doesn’t get pushed back or erased altogether. MJO would kind of support it though going into phase 7 during December La Niña. That promotes Aleutian low. -
December 2024 - Best look to an early December pattern in many a year!
ORH_wxman replied to FXWX's topic in New England
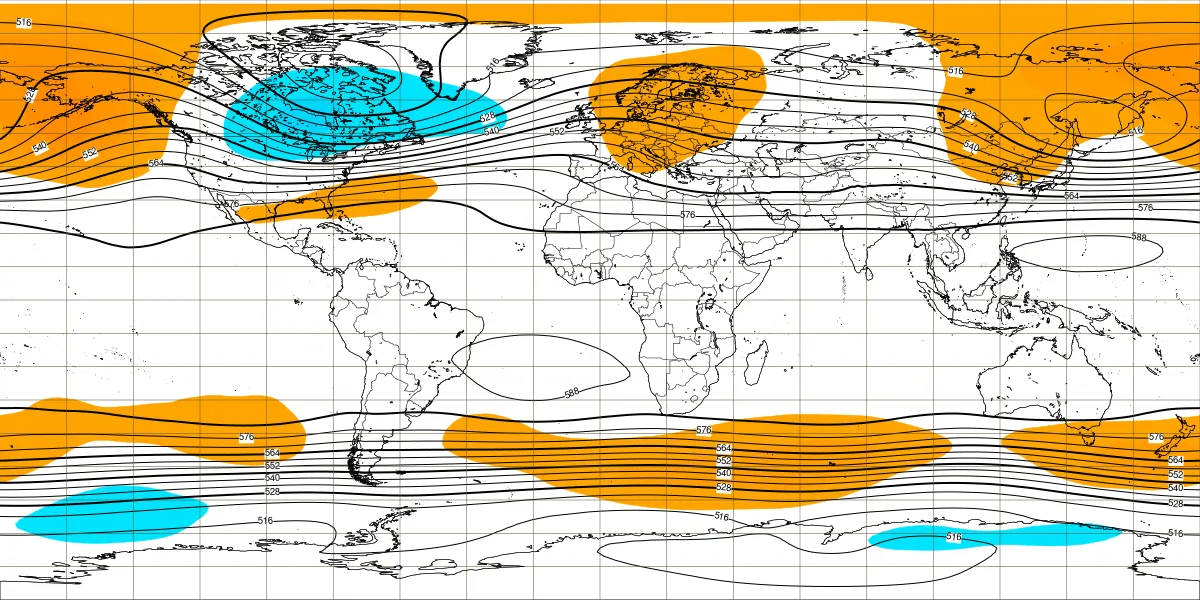
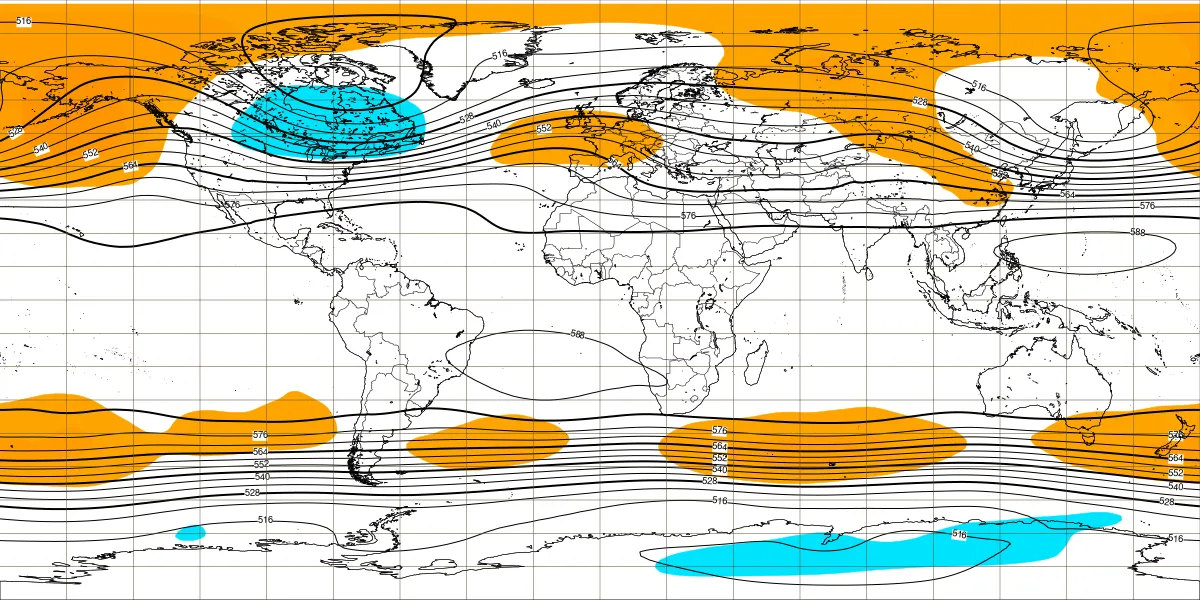
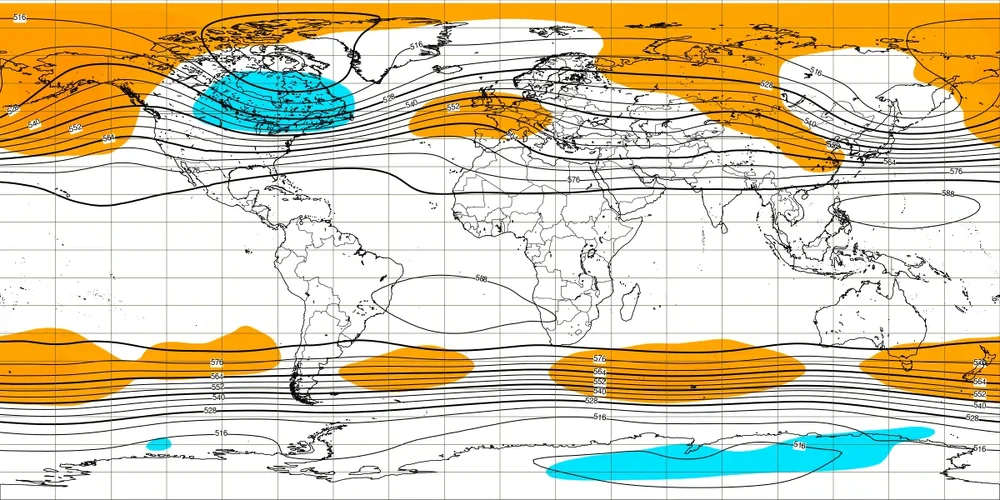
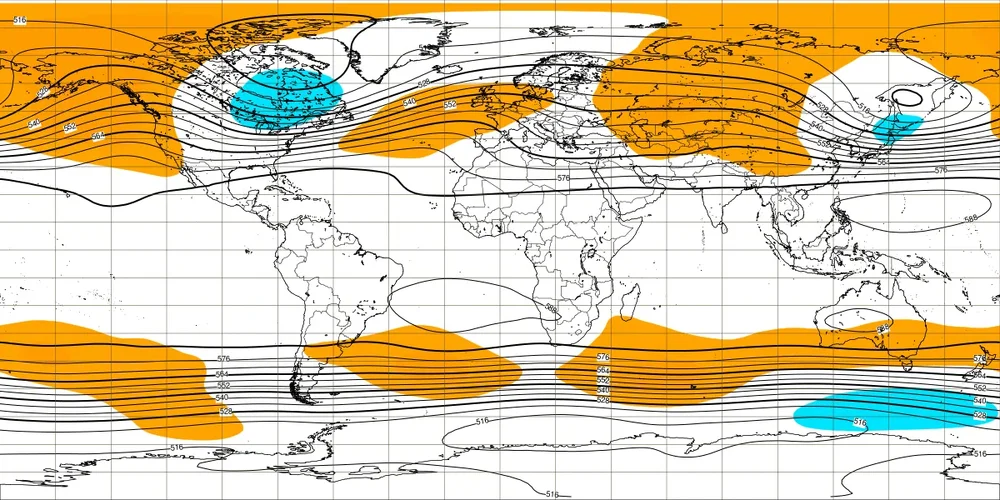
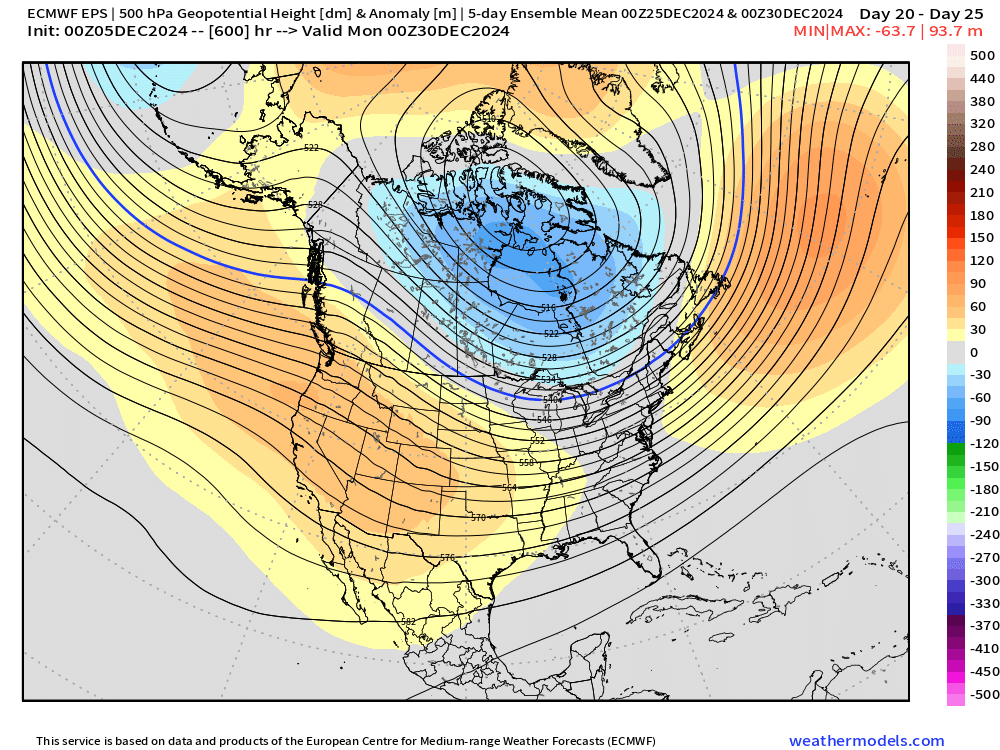
I wouldn’t be punting the rest of the month when the last 10-12 days has a pretty decent amount of uncertainty. I know weeklies aren’t exactly the poster child of accuracy but here is the 5 day H5 mean ending Xmas (Dec 21-25)…. Then here is Dec 26-30 Doesn’t exactly scream punt. I’m skeptical of any good look these days but there isn’t a strong empirical reason to assume it’s going to fail either.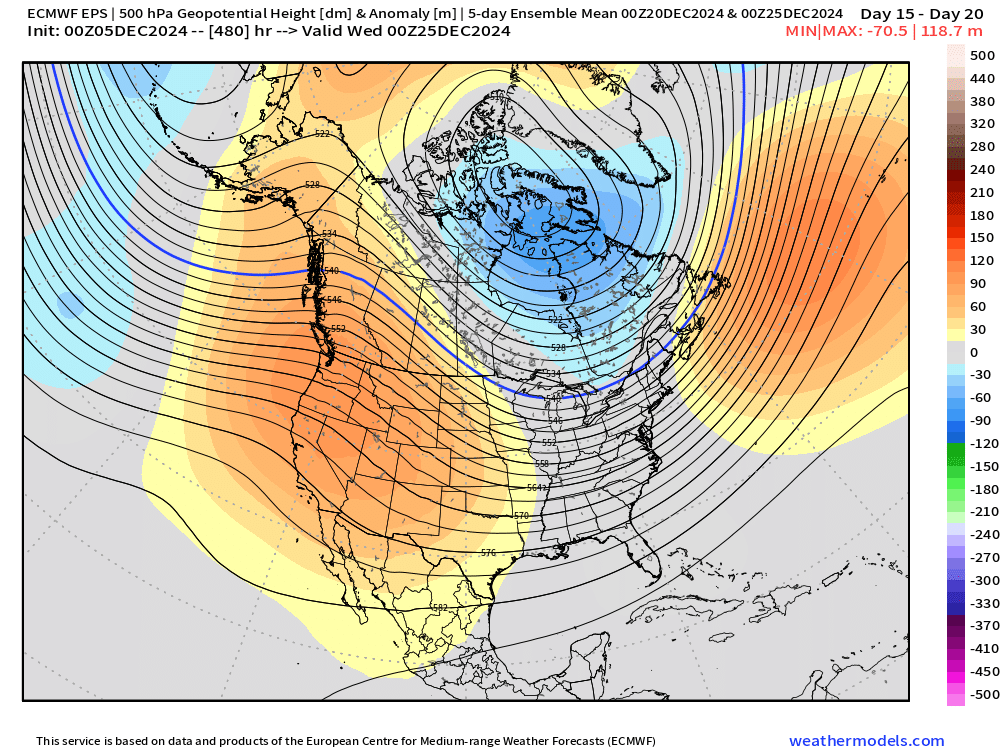
-
December 2024 - Best look to an early December pattern in many a year!
ORH_wxman replied to FXWX's topic in New England
There’s an extremely low chance that any 30 year period since BOS kept records was snowier than the 1990-2020 period. Snow cover is a different animal but you wouldn’t be able to compare pre-Logan airport to Logan airport obs anyway since Logan is in a munch worse spot for both snow and snow cover than even the old site a little bit inland in the city. But snow cover is definitely more correlated to avg temperature than just snowfall which has a larger precip anomaly component to it. -
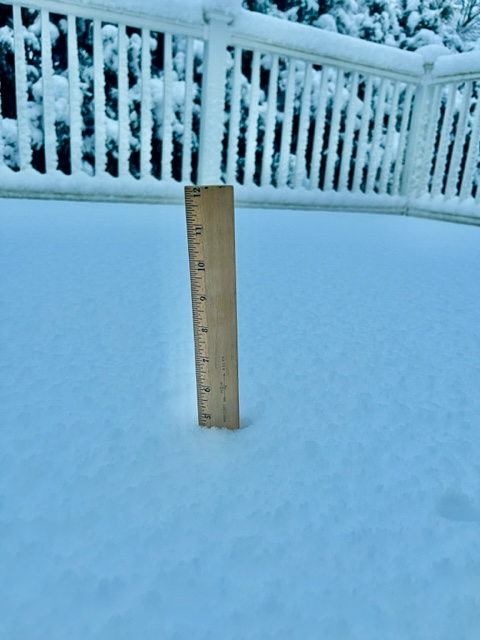
6.3” on winter hill looks like the final unless there is something from squalls. Had around 2” in Holliston…decent difference. Lower down in town was even less.
-
December 2024 - Best look to an early December pattern in many a year!
ORH_wxman replied to FXWX's topic in New England
That PV lobe vortmax rotating down in Quebec is what would be needed to get a colder solution next week. If you can rotate that down into northern Maine or something then it gets very interesting. But right now most guidance is too far north with it. This is the clown range NAM at 12z
-
Some big bands coming in now
-
Winter hill
-
Moderate snow here and 32.5.
-
That’s an impressive collapse east after midnight. Really quick.