

ORH_wxman
-
Posts
90,892 -
Joined
-
Last visited
Content Type
Profiles
Blogs
Forums
American Weather
Media Demo
Store
Gallery
Everything posted by ORH_wxman
-
There won't be a La Nina pattern this year....agreed. None of the seasonal models show a La Nina pattern either....they all show big +PNA with STJ riding underneath it. The polar domain and the Aleutian low position will determine whether it's a good pattern for the northeast or not.
-
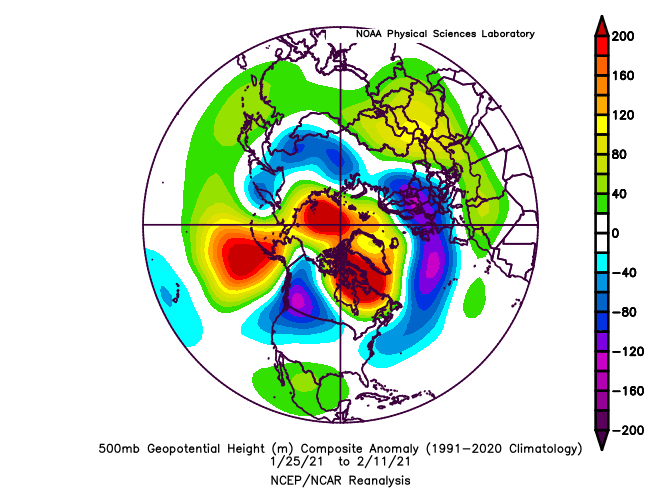
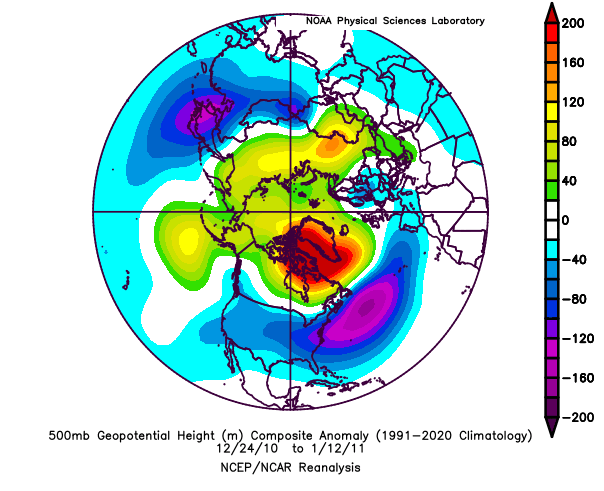
The late Jan/early Feb 2021 period was really driven by an exceptionally favorable Atlantic....the PAC pattern was a -PNA, but the trough wasn't digging into Baja CA/S CA like we saw last winter and for a time in Dec 2021 too....so because it wasn't digging that far southwest, it allowed the NAO block to successfully produce a classic height response over the Northeast and Atlantic region. Late Dec 2010 through first half of Jan 2011 also saw this pattern though the PAC was even a little more favorable (though still a -PNA) to produce an even colder height response than the 2021 pattern. These are aren;t super uncommon for "good" La Nina patterns. I'd expect a lot more +PNA though this winter.
-
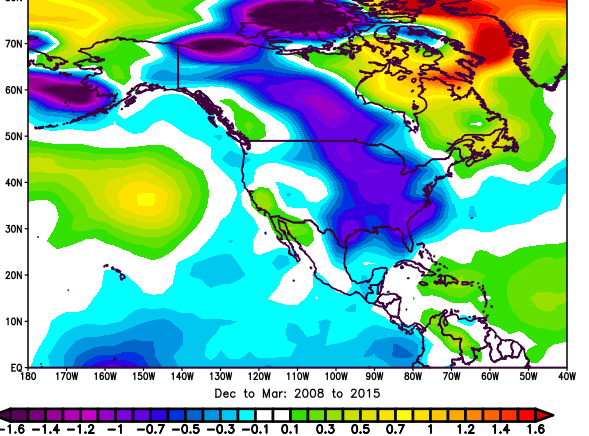
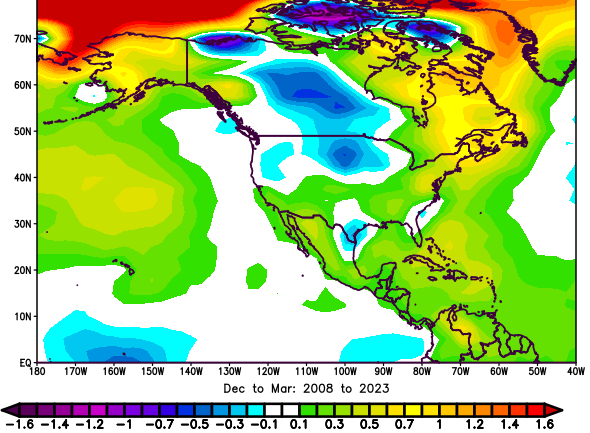
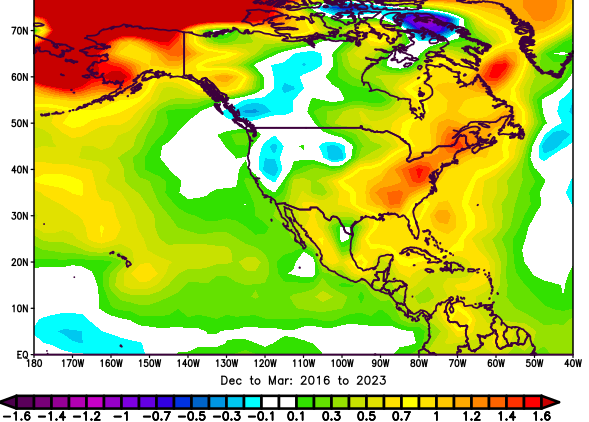
Here's 2008-2015 when we had a lot of colder winters mixed in. Total from 2008 to present: You can see southeast Canada is the warmest on both outside of the arctic sea ice regions further north.
-
Last year we couldn't buy even a stale polar high to our north. Doubt we keep up that weird anomaly. Even a marginal polar high in some of those storms last year would've made the entire complexion of winter different as some of those storms wouldve been large snow events much closer to the coast or even right to it. This is as good a season as any for some positive regression in our source region in SE Canada/NNE for colder temps and right down into much of the northeast....they've been the most anomalous for warmth in the past 8 seasons. No surprise who has been the coldest (that -PNA region from W Canada to N plains/N Rockies)
-
Boston has had some weird quirks of very large seasonal snowfall during strongly +NAO seasons....1992-93 and 1993-94 also are in the group....or even strongly positive NAO months like Jan 2005.
-
EPS mean doesn’t even get it to 70W…there is still a lot of work needed on this one to make it compelling outside the Cape/Islands.
-
The only thing that gives me a bit of pause is really haven’t seen a N PAC like that in a super Nino. Even the great Jan-early Feb 1966 period was mostly driven by an ideal Atlantic pattern and the PAC was just kind of meh…but not hostile enough to ruin the great NAO block. But the sample size for super ninos is admittedly pathetically small….and I don’t think enough people take that into account when expressing high confidence in pattern tendencies. Also, if this is effectively just a “strong Nino” (RONI, MEI, etc), then that changes things too I’m sure.
-
Big difference there is the Aleutian low and corresponding downstream ridging....in the Feb 2016 pattern, the low is well east in the GOA and therefore, the western ridge couldn't pump up as much. That kept the bulk of the cold in Canada in Feb 2016 while we had pseudo-zonal flow and mild temps in the mean...but in the Euro and CanSIP seasonal forecasts, it is further west and the downstream ridge is pumping the best height anomalies into the NW Territory/Yukon/AK instead of being flatter down in the US like 2016. This also allows the STJ to flow nicely underneath in classic split flow pattern. Regardless of the ENSO strength, this is the type of pattern you want to see. If that Aleutian low ends up in a 2016 position, then it will be a much warmer outcome.
-
If it moves 100-150 miles west then I'll be interested.
-
An awful lot of seasonal guidance has the Aleutian low well west in a favorable spot that we typically see during a weaker or modoki El Nino....that is really the main key for any eastern winter enthusiast....where that Aleutian low sets up. In previous torchy Super Ninos, the Aleutian low is displaced pretty far east well into the GOA and enlarged which sort of destroys the benefit of split flow and a colder southeast Canada/Northeast US.
-
Might have been weaker when it hit Yucatan or by the time it reached the more populated wets side of Cozumel....I know it was weakening pretty fast though regardless. If it had been holding more steady or intensifying, it would have been way worse than it was....and it was still really bad.
-
Yep....I remember Gilbert all over the news in 1988...probably one of my earlier Tropical cyclone memories. Its aerial coverage was insane....something like 600 miles IIRC. I still say that Cozumel/Yucatan peninsula used up 8 of their 9 lives on that one....it encountered some unfavorable upper air right before landfall there and weakened to a cat 4....otherwise it would have been an epic catastrophe. Hurricane Gilbert is still pretty well-known in Texas not for the tropical winds, but for all the tornadoes it spawned. It caused a bunch of tornadoes, several of which hit San Antonio where I had just moved away from back to New England.
-
Allen was 1980...but yeah, crazy strong that storm got.
-
You can see how little NW CCB was present in that....def like a WAA thump running into a brick wall on the NW side. That would be consistent with a dampening upper level wave which I believe this was. It was not amplifying on approach and throwing moisture 400 miles NW....it was getting squeezed which helped wring out that obscene snow in a narrow area.
-
Yeah that 3/4/19 storm def trended SE pretty decently in the final 24 hours. We never got that little bump back NW with the bands that we often see right at game time. That was legit stuff though. I think I had 17” and about a foot of that fell in 3 hours.
-
Wake Me Up When September Ends..Obs/Diso
ORH_wxman replied to 40/70 Benchmark's topic in New England
2009 was the coldest June/July combo on record at Logan. That’s a tough bar to breach. Hard enough getting the entire JJA period BN in this regime so that alone is a nice change. -
It’s been a few years since we had a legitimately good pacific for an extended period during the winter. You can maybe argue for a couple weeks in January 2022 but that’s really been it. The nice period of late Jan through mid Feb 2021 was mostly Atlantic-driven with a great NAO block but a -PNA (but that -PNA didn’t dig for oil in Baja CA so it was fine) Hoping we can get a standing wave near dateline for several weeks this winter.
-
The 2019 cold shot had bad wind too. It was a high of 1F with wind. Doesn’t get much worse than that. Jan ‘94 was not as windy iirc but still really nasty.
-
Jan 2019 had a daily high of 1F at ORH which tied 1994 for the coldest since Jan 1981 when a high of 0F occurred. Only Jan 1968 (high of -2F) was lower. The coldest reading since the 1950s was the Feb 2016 -16F reading....you had to go back to Jan 1957 to beat it.
-
We had a decent December in 2020 before the all-timer Grinch storm ruined it. But in terms of pure snowfall, it was a good month...but I know that isn't the only criteria around the holidays. But yeah, you gotta go back to Dec 2017 for a solid month area-wide....though Dec 2019 was decent for some in SNE...esp interior MA. During those classic La Nina (or neutral) 2007-2013 years, we seemed to get a good December almost every winter which probably really spoiled us. You could actually extend that back to 2002....between 2002 and 2013, ORH only had 2 Decembers where snowfall was below average....you could maybe count 2004 too but I consider that average since it was only about 1.5 inches below normal.
-
Yeah area tends to be at a minimum near the end of the first week of September or early in the 2nd week. Right now, we're about 40k above the min two days ago. We'll see if that 9/3 min holds.
-
The CONUS pattern isn’t that similar. The 2009 western ridge was way better placed for cool anomalies over the east and you had a simultaneous NAO block that kept it trapped in the northeast. If we had a 2009 pattern this year, it would be much colder. Not as cold as 2009 but a lot closer than this year was.
-
NSIDC SIA has seen a strong decline late in August and early September. Now down to 2.78 million sq km. That gets this season into a top 5 year. We need about another 100k to get into top 3 to beat out 2020. We’re running out of vulnerable ice but if we can decline another 2-3 days in a row, then we’ll have a chance.
-
Ok that's pretty awesome right there....almost all of that looks like sustained winds too.
-
74 knot (85mph) gust at Perry airport KFPY 301215Z AUTO 01054G74KT 1SM +TSRA OVC008 25/24 A2828 RMK AO2 LTG DSNT N AND NE P0029 T02470240

